Category Carbon Emissions
How can IoT sensors help businesses achieve sustainability goals
https://marketscale.com/industries/industrial-iot/putting-iot-to-work-for-u-s-sustainability-goals/
MarketScale Podcast with Daniel Litwin
Why More Energy Storage Investments are in Everyone’s Best Interest

Why Visual Data Analytics: Discovery, Innovation and Opportunities

A data analytics framework is applicable to insight discovery; provides a roadmap towards innovation; and enables capabilities that can optimize approaches to new business models and opportunities. The following paper provides examples revealing how and why to apply visual analytics for discovery, innovation and evaluating new opportunities.
Discover how waveforms and patterns are applied to science and finance, and how customer usage patterns can reveal new approaches to market micro-segmentation and persona classifications. Lastly we’ll reveal how the deployment of IoT devices across the enterprise fuels data flow in the physical world regarding the performance and conditions of business assets.
Introduction
Our theme is applying visual data analytics as a tool for discovery, innovation and evaluating market opportunities. We show how two metrics, price and volume, are able to convey insight and establish price targets for technical analysis. Why energy consumption patterns and waveforms lend themselves to understanding science and classifying human behavior. How proxy metrics can serve as measures for physical events. Why linking granular visibility into processes and the monitoring of conditions and operating performance help build an advantage in the digital economy.
Green Econometrics relies on visual analytics as a core fabric in our data analytics frameworks because visual analytics are integral to discovery, innovation and new opportunity development. Visual insights are easy to understand – allowing business objective and performance metrics to seamlessly transfer across business units. So how do we do it?
Why Analytics and Business Intelligence

Analytics and Business Intelligence provide a framework for process improvement that drives operating efficiencies and enhances business value. Most business owners and managers want to increase business value to benefit shareholders, stakeholders, and investors. Individual investors and investment professionals direct capital towards companies that can demonstrate sustainable value. Changes to performance in revenues, margins, and risks can become a catalyst to invest or divest. Business value is often measured by three performance criteria – revenues, operating margins, and risks. Therefore, factors that contribute to revenue growth, margin expansion, and risk mitigation become the overarching goals to improve business value. We add that sustainable value includes resource conservation and efficiency.
Just how does analytics and business intelligence address revenues, costs, and risks in improving business value? To understand the integration of analytics and business intelligence in improving business value, let’s look at two initiatives in formulating business strategy.
In his book Measure What Matters, John Doer describes how establishing goals and objectives along with the corresponding performance criteria provide a better method to assure that key metrics are aligned to goals and business objectives. This process of mapping performance metrics to business objectives defined as Objectives and Key Results (OKRs) determine what is relevant to measure and track. Adding to OKRs is the balanced scorecard approach which pulls reporting data from each business unit and department and explained by Robert Kaplan and David Norton in their Harvard Business Review article “Using the Balanced Scorecard as a Strategic Management System” to provide an assessment of conditions and performance.
Analytics Framework for Sustainability
Why the analytics framework for process improvement can translate into substantial benefits around sustainability improvements and energy efficiency. The Coronavirus pandemic has upended social interaction – a new normal, with social distancing and protocols, and so why does sustainability play a crucial role in facilitating a smoother transition into the is new normal. The reason is sustainability engenders confidence. Knowing facilities are safe and that indoor air quality monitoring is vital for occupant health and safety builds confidence. Health and safety are also essential in generating the confidence that changes consumer behavior. Therefore, the process by which you implement a sustainability plan plays an expanding role in orchestrating the activities that adhere to values and performance.
A sustainability framework provides the roadmap to monitor, measure and curate data thus enabling performance benchmarking of conditions and processes. The analytics framework serves as a roadmap to utilize insight gained from data analysis. Currently available tools such as data visual analysis, machine learning algorithms and cloud computing architecture enable cost effective approaches to achieve business and sustainability objectives.
A sustainability framework provides the foundation to drive business value across several dimensions and performance metrics. The use of the sustainability process can drive business value, improve our environment, enhance customer loyalty, and better engage healthier and happier employees while rewarding shareholders and stakeholders with higher business valuations.
2010 Update on Oil Consumption and CO2 Levels?
The worst global economic recession in since the Great Depression seems to be abating. Given the severity of the financial crisis, it might serve to review what impact the recession has had on oil consumption. In addition, what impact did the decline in oil consumption have on atmospheric CO2 concentration levels?
Since 2006, global oil consumption declined by 1.1 million barrels per day (BPD) from 85.2 in 2006 to 84.0 in 2009. Oil consumption in the US declined 9% to 18.8 million from 20.7 million BPD in 2006. Europe experienced a decline of 7% over this same period with a drop of 16.5 million to 15.2 million BPD. However, over this same period, oil consumption in China and India increased 16% and 13%, respectively. This data was complied from the US Department of Energy Information Administration (EIA) and is displayed in the following charts.
To measure how significant the impact has been, the following charts provide some insights in evaluating how deteriorating world economies may have impacted oil consumption and secondly, whether reduced oil consumption has mitigated heightened CO2 levels.
Figure 1 Global Oil Consumption 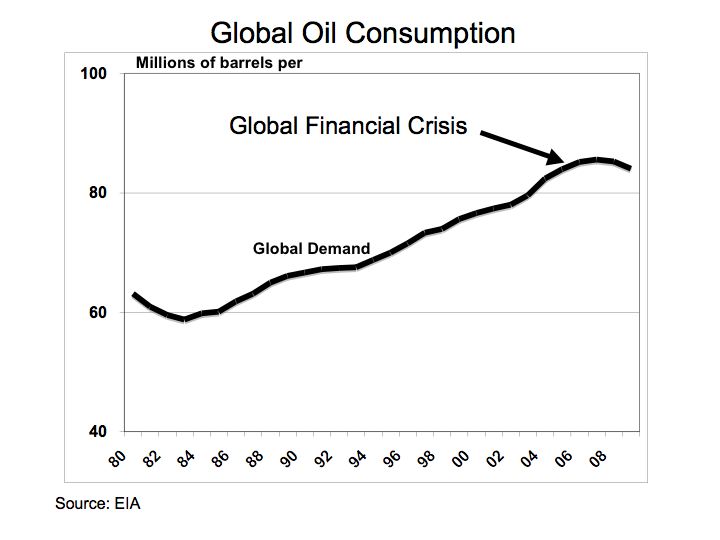
Source: EIA
From Figure 1, the impact of the global financial crisis is depicted with the decline in global oil consumption. When a comparison is applied to oil consumption between the US China, and India, the relative drop in oil consumption is less discernable.
Figure 2 US, China, and India 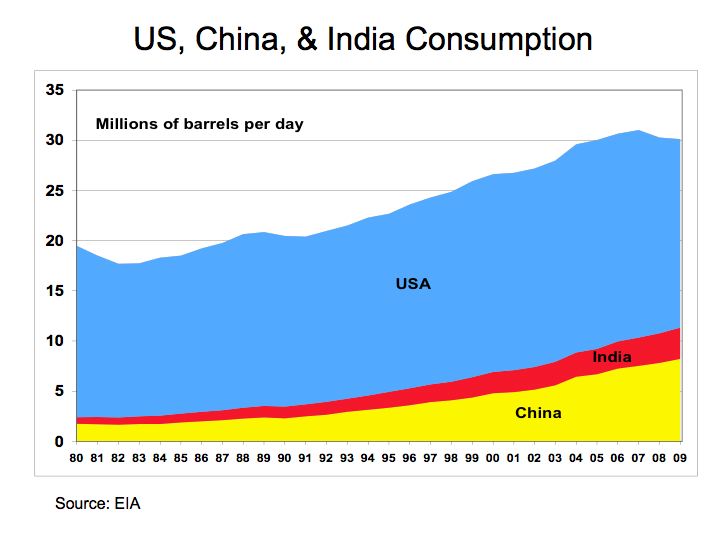
Source: EIA
Figure 2 provides a summary of oil consumption of the US, China, and India. A measurable decline in oil consumption can be seen, but only in the US market.
Figure 3 China and India 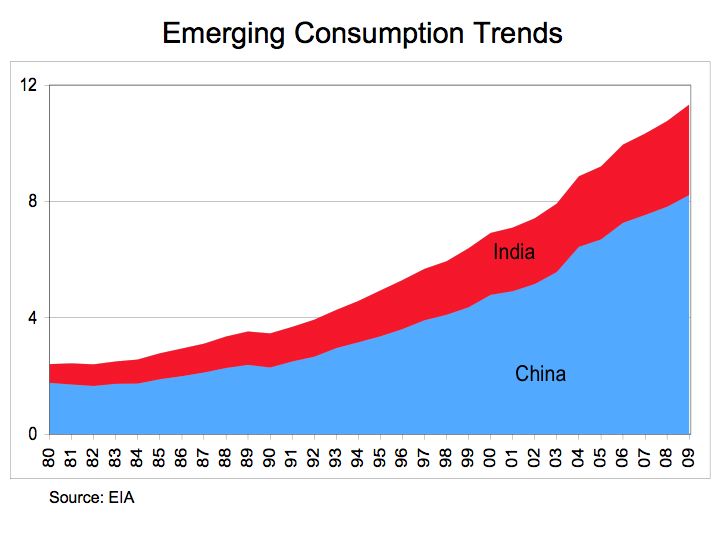
Source: EIA
Figure 3 demonstrates the steady and pronounced growth in oil consumption for China and India. Despite the global financial crisis, oil consumption significantly expands in China and India due to secular growth from rapid industrialization in both countries. When measured with respect to the European market, China and India have grown from 15% of the oil consumption rate of Europe in 1980 to over 74% of the consumption level in 2010.
Figure 4 CO2 Levels 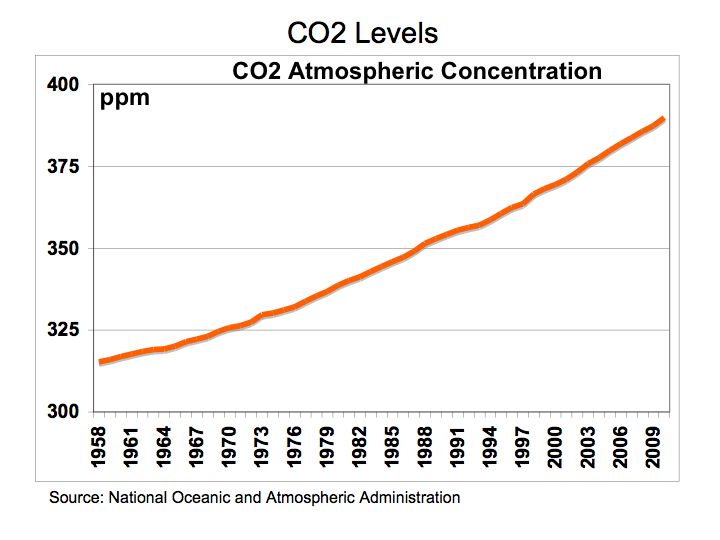
Source: NOAA
With the decline in global oil consumption, perhaps a positive benefit would be a fall in CO2 levels. The atmospheric CO2 readings in part per million (PPM) where taken from the National Oceanic and Atmospheric Administration (NOAA) from the Mauna Loa CO2 Levels monthly measurements. Figure 4 illustrates the average annual atmospheric CO2 concentration readings in Mauna Loa, Hawaii from 1980 through 2010.
The bottom line is even while global oil consumption declined during the recession, growth in China and India remained unabated and subsequently, CO2 concentrations in the atmosphere continue at elevated levels.
In memory of Jamie Kotula – loved by family, friends, teammates, and school.
Should we be Concerned over Elevated CO2 levels?
With the oppressive heat and appalling humidity along the Eastern Seaboard, one considers the possibility of climate change and the impact of that greenhouse gases may have on our environment. Without developing statistical regression models to gleam any semblance of understating of carbon dioxide’s impact on climate change, let’s just look at some charts that illustrate the changes of CO2 levels though history.
While industry experts and scientist debate whether elevated CO2 levels have an impact on climate change, the scientific data taken from ice core samples strongly suggests CO2 levels have remained in a range of 180-to-299 parts per million (PPM) for the last four-hounded thousand years. Scientists have developed models to suggest that rising CO2 levels contributes to global warning which are subsequently followed by dramatic climate changes that lead to periods of rapid cooling – the ice ages.
Scientific theories suggest that rising global temperatures melts the Polar ice which allows substantial amounts of fresh water to enter the oceans. The fresh water disrupts the ocean currents that are responsible for establishing a nation’s climate. As oceans warm near the equator, the warmer water travels towards each of the Polar areas. The cooler water near the Polar areas sinks and travels towards the equator. These ocean currents allows for stable climates. The issue is that fresh water is less dense because it is not salty like seawater. Therefore, the fresh water does not sink like the cold salinated seawater thereby disrupting the normal flow of the ocean currents.
Figure 1 CO2 Ice Core Data – illustrates the level of CO2 over the last four-hounded thousand years. The Vostok Ice Core CO2 data was compiled by Laboratoire de Glaciologie et de Geophysique de l’Environnement.
Ice Core Data
Figure 1 CO2 Levels – Vostok Ice Core CO2 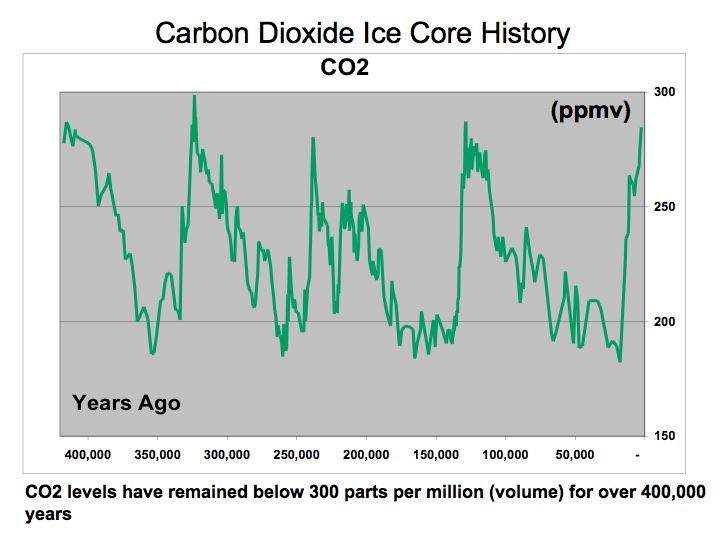
Source: Laboratoire de Glaciologie et de Geophysique de l’Environnement
If this Ice Core CO2 data is correct, then the current data on atmospheric CO2 levels is quite profound. CO2 data is complied by the National Oceanic and Atmospheric Administration NOAA at the Mauna Loa Observatory in Hawaii. The latest trend indicates CO2 levels for June 2010 are at a mean of 392 ppm versus 339 in June 1980 and 317 in 1960. Clearly these CO2 levels are elevated. The question is what is the impact on our environment.
Aside from the catastrophe in the Gulf of Mexico and the dire need to find an alternative to our dependence on oil, should we not accelerate our efforts to find an alternative energy solution and as a way to mitigate the impact of CO2 on our environment? Maybe investment into alternative energy could help solve multiple problems.
Figure 2 Mauna Loa CO2 Readings 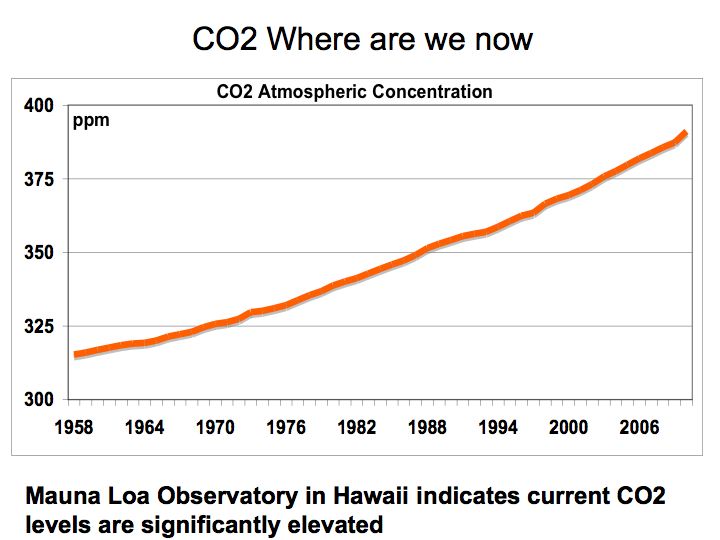
Source: Source data published by the National Oceanic and Atmospheric Administration (NOAA)
The bottom line is that we need to consider the possibility that elevated CO2 levels in our atmosphere could potentially have a detrimental impact on our climate. In any event, limiting our dependence on fossil fuels, the main contributor to CO2, should be paramount. Let us not forget oil is supply-constrained – there are no readily available substitutes aside from electric vehicles, and without a strategy to embrace renewable energy, supply disruptions will have a painful impact on our economy, national security, and environment.
Energy Perspective
After reviewing oil data from the Energy Information Administration (EIA), Global Petroleum Consumption , it may be helpful to put energy consumption into perspective. Most of us are quite familiar with alternative energy such as solar and wind, but the reality is, even if solar and wind could supply all of electric energy needs, the majority of our energy needs is still predicated on access to oil.
While industry experts and scientist debate whether more drilling will ameliorate the energy challenge we face, let’s look at a couple of data points. Figure 1 US Oil Field Oil Production and Drilling Rigs – illustrates that higher drilling activity as measured by Baker Hughes Rig Count data does not necessarily correlate to more oil production as measured by US Oil Field Production by the EIA. Higher drilling activity does not produce more oil.
Figure 1 US Oil Field Production and Drilling Rigs 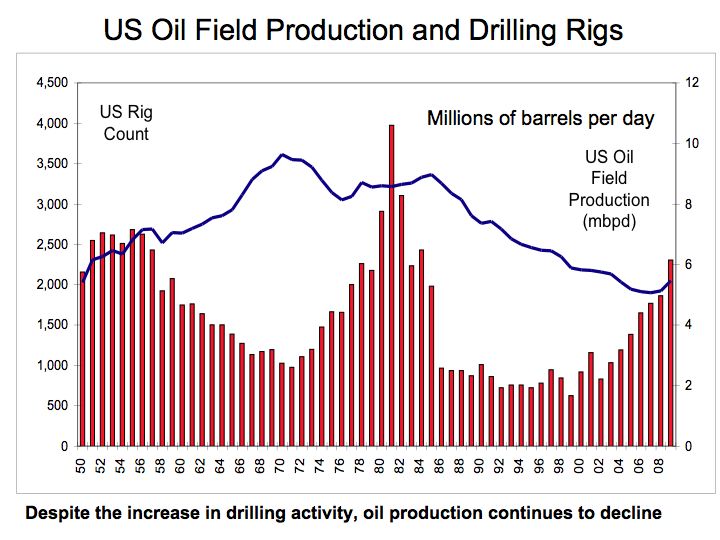
Source: Energy Information Administration and Baker Hughes research
Despite the large investment in drilling rigs that more than doubled from 1,475 in 1974 to over 3,100 in 1982, US oil production remained relatively flat. Moreover, even the most recent drilling expansion activity that again more than doubled from 1,032 rigs in 2003 to over 2,300 rigs in 2009, resulted in relatively flat oil production, suggesting that on the margin unit oil production per drilling rig was declining. Perhaps even more disturbing is that the most recent drilling activity in the US was accomplished through extensive use of technology. Seismic imaging technology is being used to better locate oil deposits and horizontal drilling technologies are employed to more efficiently extract the oil, yet oil production still lags historic levels. While on the margin, newly announced offshore drilling could add to domestic oil production, extraction costs of oil will continue to rise adding to further oil price increases.
However, what is most profound is our dependence on oil for most of our energy needs similar to how wood was used for fuel construction material during the 1300’s and 1600’s. If we translate energy consumption into equivalent measuring units such as kilowatt-hours, we can compare and rank energy consumption. Although electricity is captured through consumption of several fuels most notably coal, a comparison of energy usage between oil and electric provides an interesting perspective.
Figure 2 Energy Perspective – provides a simple comparison of the consumption of oil and electricity measured in gigawatt-hours (one million kilowatt hours). A barrel of oil is equivalent to approximately 5.79 million BTUs or 1,699 KWH and the US consumed approximately 19.5 million barrels per day equating to 12 million gigawatt-hours a year. The US uses 4 million gigawatt-hours of electric energy annually. The critical point is that even if solar and wind supplied all of our electric energy needs, it would still only comprise 30% of our total energy needs. Therefore, without an energy strategy that facilitates migration towards a substitute for oil, particularly for transportation, we are missing the boat.
Figure 2 Energy Perspective 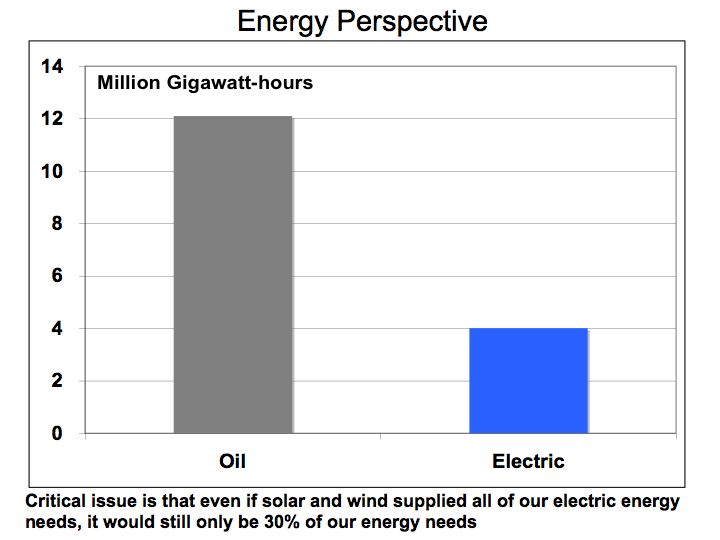
Source: Energy Information Administration and Green Econometrics research
It’s not all doom and gloom. Technologies are advancing, economies of scale are driving costs lower, and the economics for new approaches to transportation are improving. From hybrids and electric vehicles benefiting from advances lithium-ion batteries to hydrogen fuel cell vehicles getting 600 miles on a tank of fuel. These advanced technologies could mitigate our addiction to oil, however, without formulating an energy strategy directing investments towards optimizing the economics, energy efficiency, environment, and technology, we may miss the opportunity.
The bottom line is that oil is supply-constrained as there are no readily available substitutes, and therefore, without a means to rapidly expand production; supply disruptions could have a pernicious and painful impact on our economy, national security, and welfare.
Falling Panel Prices could bring Solar closer to Grid Parity
Rising inventory levels of photovoltaic (PV) panels and new production capacity coming online is driving solar PV prices lower and thereby, bringing solar energy closer to grid price parity. With the release of the latest earnings of solar energy companies, Wall Street’s keen attention to revenue guidance, inventory levels and pricing are paramount in diagnosing the health of the solar energy industry. Expectations call consolidation of the solar industry with some key players gaining market share and for others it becomes more challenging. However, despite the turbulence in the industry, consumers will benefit in the near-term as solar PV prices fall and government incentive fuel growth in solar PV deployment.
To get a better perspective on the solar PV industry, let’s examine inventory levels for some of the leading solar PV suppliers. The following chart, Figure 1, compares inventory levels in relationship to sales volume. While inventory levels have increased, the level of inventories to sales is not egregious
Figure 1 Sales and Inventory levels 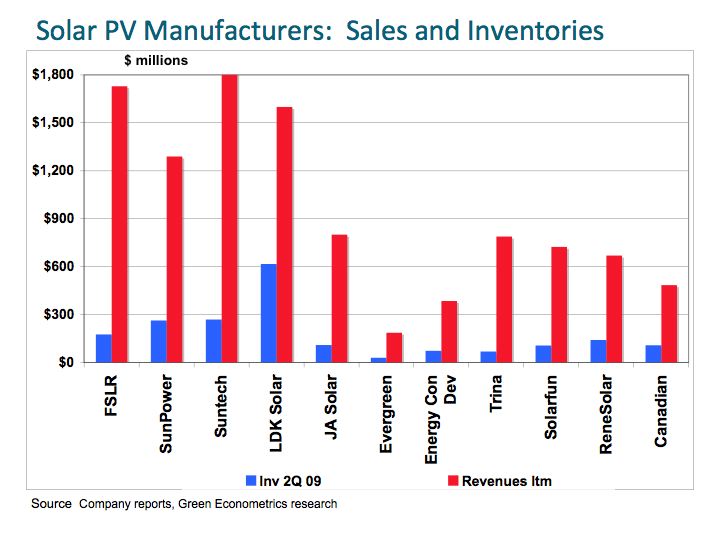
While it is important to control inventory levels in relationship to sales, revenue growth is predicated upon price, performance, and return on investment for prospective customers. Thin-film PV has emerged as the low-cost solar solution even with its lower efficiency levels in comparison to mono-and poly-crystalline PV panels. Thin-film still offers a lower cost/watt than crystalline PV, see Solar Shootout in the San Joaquin Valley , but prices for crystalline PV are falling as a result of rising production capacity and inventory levels.
Figure 2 Market Value 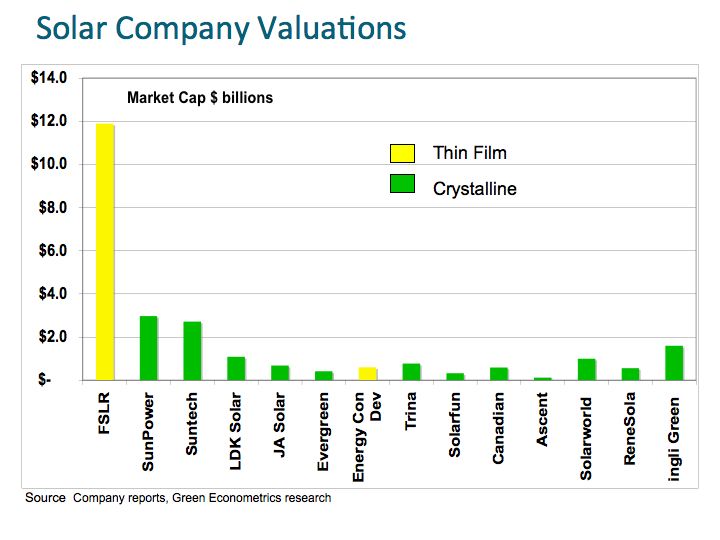
In Figure 2 Green Econometrics is comparing the market value of some of the leading PV suppliers as measured by their respective stock prices. In the valuation of solar PV suppliers, the stock market appears to be betting heavily on thin-film PV, as First Solar (FSLR), the leading thin-film PV supplier, enjoys a market value that accounts for over half the value of the entire solar industry. FSLR is positioned as the low-cost supplier in the solar industry with its announcement of $1 per Watt reducing its production cost for solar modules to 98 cents per watt, thereby braking the $1 per watt price barrier. However, new panel suppliers, mainly from China are pushing prices lower for poly-and mono-crystalline panels suppliers. ReneSolar (SOL) is seeing average selling prices for wafers at $0.93 per watt and bring PV panels prices to under $2.00 per watt.
There appears to be a lot riding on the success of thin-film PV and as prices fall for crystalline PV, the closer we get to grid parity. In the following chart, Figure 3, price for crystalline PV have declined quite dramatically in the last 30 years. According to the Energy Information Administration, in 1956 solar PV panels were $300 per watt, and in 1980, the average cost per solar modules was $27/watt and has fallen precipitously to approximately $2/watt in October 2009. As the installed cost of solar PV falls closer to $4/watt, pricing per kilowatt-hour (KWH) (depending on your climate and geography), equates to approximately $0.16/KWH that would be inline with utility rates after rates caps are removed.
Figure 3 Solar PV Prices 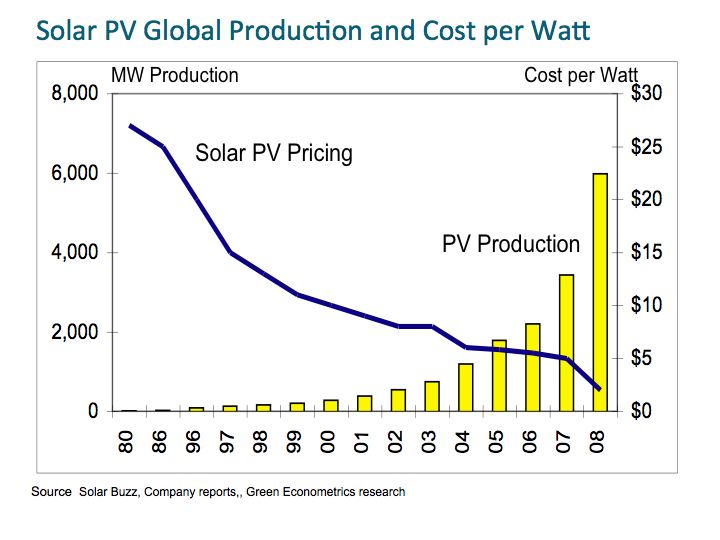
The bottom line is that despite the lower PV panel costs; we are still not at parity with hydrocarbon fuels such as coal and oil. Carbon based taxes or renewable energy incentives as well as more investment into alternative energy should improve the economics of solar and wind and bring us to grid parity.
A Case for Natural Gas CHP Systems
A combined heat and power system (CHP) is the cogeneration or simultaneous generation of multiple forms of energy in an integrated system. CHP systems consume less fuel than separate heat and power generating systems. According to the Environmental Protection Agency in their Combined Heat and Power Partnership report, (EPA), CHP systems typically consume only three-quarters the amount of energy separate heat and power systems require. By combining both heat and power into the same energy systems, efficiency gains for the total system. Heuristically, high temperature and high pressure fuel ratios results in higher efficiency systems. In addition, the thermal energy produced from the CHP system could be used to drive motor applications or to produce heat, steam, and hot water.
As an initial step to reducing greenhouse gas (GHG) emissions, natural gas turbines could improve overhaul efficiency of 65-80%. In addition, the CHP offers lower greenhouse gas (GHG) emissions in comparison to conventional standalone systems. Gas turbines CHP systems operate under a homodynamic principle called the Brayton cycle. The design characteristics of a CHP gas turbine provide: 1) high electric and total system efficiency; 2) high temperature/quality thermal output for heating or for heat recovery steam power electric generation; 3) offer options for flexible fuels such as propane, natural gas, and landfill gas; 4) high reliability with 3-to-5 years before overhaul running 24/7; and 5) significantly lower GHG emissions.
Figure 1 Gas Turbine CHP System
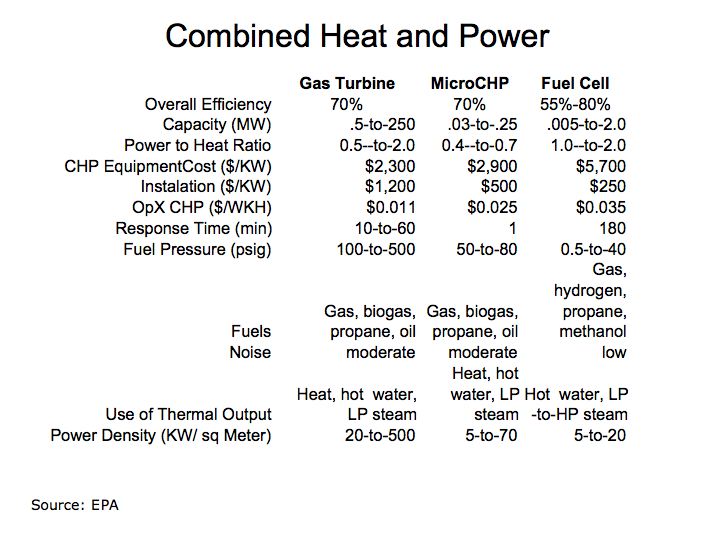
Figure 1 demonstrates the mechanics and variables of a CHP system. In summary, the CHP technology enables the supply of efficient heat and power while minimizing GHG emissions. Total CHP efficiency is defined as the sum of net power produced plus the thermal output used for heating divided by total fuel input.
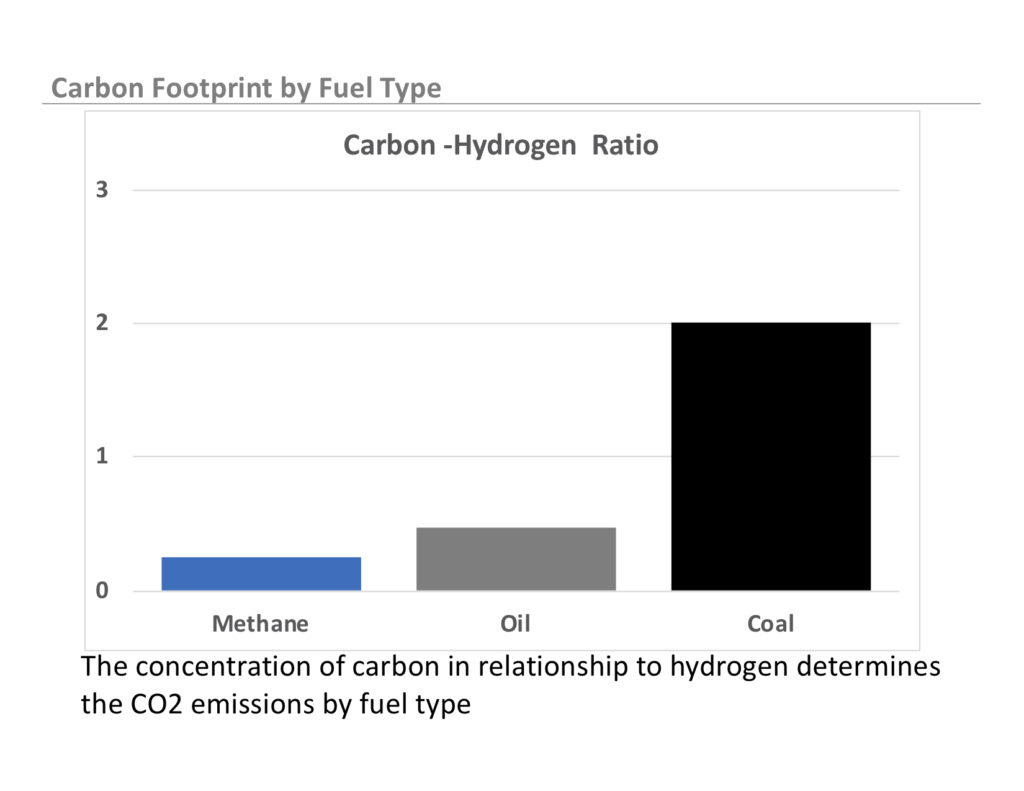
The use of methane (natural gas) as the main fuel for the CHP system offers advantages because methane offers the highest hydrogen-to-carbon ratio among fossil fuels, thereby, combusting with the lowest GHG emissions. According to EPA data, the emissions NOx particulates from gas turbines ranges between 0.17-to-0.25 lbs/MWH with no post-combustion emissions control versus 1.0-to-4.2 lbs/MWH for coal fed boilers. The carbon content of natural gas is 34 lbs carbon/MMBtu in comparison to coal at 66 lbs of carbon/MMBtu.
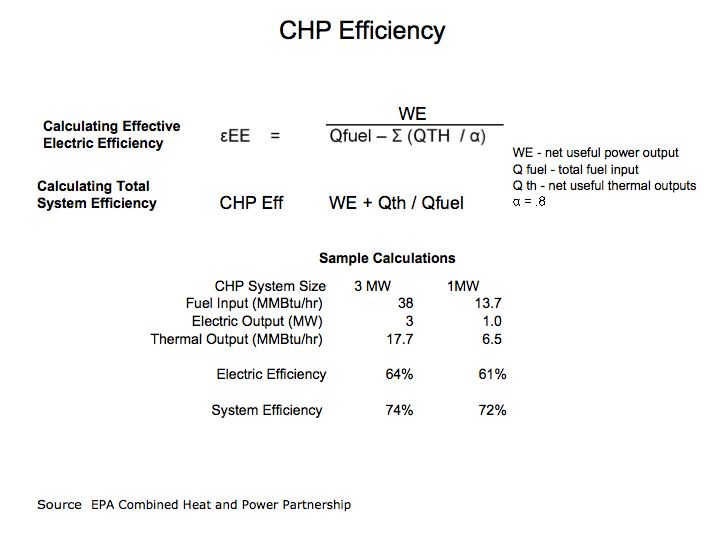
There are two valuable metrics used to measure efficiency for CHP systems. One is the total system efficiency which measures the overall efficiency of the CHP system including heat and electric and the other is the effective electric efficiency which is useful in comparing the CHP electric production versus grid supplied power. These two metrics, the total system and effective electric efficiencies are important for evaluating CHP system. The following provides a guideline foe measuring these two efficiency metrics and can be found at EPA – Efficiency Metrics for CHP Systems
Figure 2 CHP Efficiency
The economics of the CHP system depends on effective use of thermal energy n the exhaust gases. Exhaust gases are primarily applied for heating the facility and could also be applied to heat recovery steam generators (HRSG) to produce additional electric power. The total efficiency of the CHP system is directly proportional to the amount of energy recovered from the thermal exhaust. Another important concept related to CHP efficiency is the power-to-heat ratio. The power-to-heat ratio indicates the proportion of power (electrical or mechanical energy) to heat energy (steam or hot water) produced in the CHP system. The following provides an overview of the economics of a CHP system.
Figure 3 CHP Economics
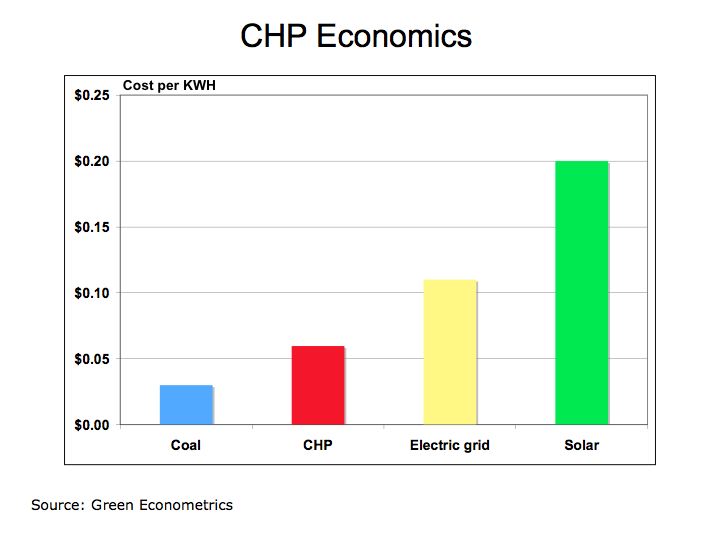
Figure 3 illustrates the economics of a CHP system in comparison to competing energy sources. While the CHP does not have the low cost of coal in producing electric, the economic value of reducing GHG emissions is quite significant and beyond the scope of this article. However, natural gas prices remain below that of oil and better ways of capturing heat exhaust will further improve CHP efficiency. The bottom line is that natural gas produces less GHG emissions than coal or oil therefore; businesses should consider the benefits of CHP as a source of heat and power.
Formulating an Effective Energy Efficiency Strategy with Measurement and Verification Copyright © 2009 Green Econometrics, LLC
The development of an energy efficiency strategy incorporates analysis of energy expenditures and energy consumption. The energy strategy must incorporate dynamics between costs, budgets and the consumption of energy including the monitoring of kilowatt-hours (KWH) of electricity and liquid hydrocarbon fuels consumed. By analyzing both the financial and the energy consumption components we are better positioned to frame the scope of the energy efficiency projects.
We start with a comprehensive energy audit analyzing energy consumption and expenditures. After determining which activities offer the fastest, cheapest, and greatest economic impact we are then able to define the scope of energy efficiency projects. The next step in the energy strategy process is to assess, rank and specify energy saving opportunities. At this phase, we have a broad understanding of the scope of energy efficiency projects within the appropriate budgetary considerations.
Conduct Energy Audit and Analyze Energy Spending
Upon analysis of the energy expenditures and the appropriate budgetary considerations, we commence with an energy audit to examine the dimensions of energy consumption. The energy audit establishes an energy efficiency baseline for buildings and vehicles. In the energy audit, energy consumption is measured by source and activity using monitors attached to branch circuits, gas pipes, and fuel lines. In this manner, energy consumption is evaluated from a financial and physical perspective and baseline usage patterns are established for electricity and other fuels.
During the energy audit, an analysis of energy intensity is measured. For buildings, energy consumption is measured in kilowatt-hours per square-foot to identify which activities consume the most energy. The energy intensity measurements are then ranked by consumption activity and compared to actual energy expenditures.
The purpose of the energy audit is to establish a baseline of energy consumption and the energy intensity associated with each building, department, vehicles, and/or activity usage category. By constructing an effective energy efficiency strategy that identifies and measures energy demand by activity, a better understanding of economic- and financial-impact is established. The critical component to the energy audit is measurement and verification were wireless Internet-based energy monitoring provide data before and after energy efficiency projects commence. The energy audit and energy monitoring systems together with financial analysis of energy consumption serve as the framework to rank and assess energy efficiency projects.
Heuristically, energy consumption in buildings is tied to lighting; and heating, cooling, and ventilation systems see Energy Intensity . The following chart, Figure 1 serves to illustrate which activities contribute most to energy consumption in buildings.
Figure 1 Kilowatt-hours (KWH) per Square Foot 
According to information provided by the DOE, lighting, cooling and ventilation alone account for nearly two-thirds of all energy consumption in a building. For perspective, electric energy demand is increasing at an annualized rate of 1.6%. According to the Energy Information Administration (EIA), demand for electricity grew 21% between 1995 and 2006.
The energy consumption audit provides a means to assess which activities should be further analyzed for energy efficiency projects. The baseline energy usage measured in KWH per square foot serves as the framework to evaluate that locations and activities could benefit from lighting retrofits, equipment upgrades, structural improvements, and energy monitoring systems.
As a consequence of increasing energy consumption in buildings, electric generation relies extensively on hydrocarbon fuels that carry adverse environmental effects. Figure 2 illustrates the proportion of coal and other hydrocarbon fuels that are used to generate electricity in comparison to renewable energy sources. Coal still accounts for nearly half of all electric generation while contributing the most in terms of harmful emissions such as carbon dioxide, nitrous oxide, and sulfur dioxide.
FIGURE 2: Electric Generation Method 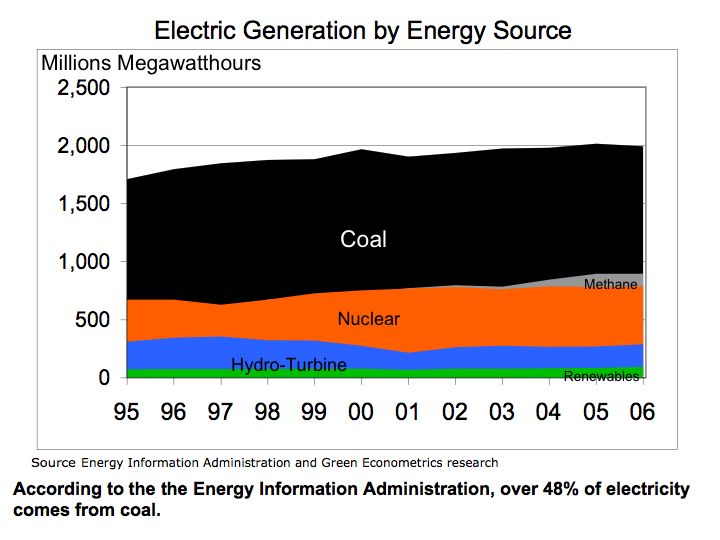
As part of the energy audit process for buildings, an energy consumption analysis of lighting and HVAC systems is evaluated along with the building’s insulation R-Value (resistance to heat flow where the higher the R-value, the greater the insulating effectiveness). In addition to lighting and HVAC systems, specialized equipment may also account for large energy demand. During our energy audit, we plan to identify and measure energy usage of special equipment in order to construct energy efficiency initiatives with clearly defined and measurable energy reduction targets.
Energy efficiency for transportation vehicles is one of the most significant factors to manage. The fact that there are no real substitutes for oil in the transportation industry illustrates two important points: 1) structural changes to driving patterns are required to see appreciable changes to oil consumption and 2) government authorities are vulnerable, with no readily available substitutes for oil, supply disruption could negatively impact transportation systems. Therefore, we emphasize fuel management systems for fleets and vehicles that monitor fuel consumption and efficiencies. DOE studies have indicated that changing driving habits could improve fuel efficiency by up to 30%.
Vehicle mounted devices that integrated fuel consumption feedback as the vehicle is driven promotes higher fuel efficiency. These off the shelf products are cost-effective, offering payback in months that dramatically improves fuel efficiencies. Aside from routine tune-ups, limiting weight, and checking tire pressure, augmenting driving patterns through gauges that provide feedback on fuel efficiency make the difference in saving energy.
In most situations, fuel management systems can be installed without significant mechanical aptitude. The ScanGaugeII from Linear-Logic is useable on most vehicles manufactured after 1996 including Gas, Diesel, Propane and Hybrid Vehicles and are designed to be installed by the consumer with plug-and-play instructions.
Identify and Measure Energy Demand by Activity
From the Energy Audit, the energy intensity of targeted buildings and fuel efficiencies of official vehicles are established. In buildings, it’s the lighting and heating, ventilation, and cooling that comprise the bulk of energy consumption.
Heating, ventilation, and cooling represent a significant portion of energy consumption in buildings and are a priority target for energy analysis. The Seasonal Energy Efficiency Ratio (SEER) is employed as an assessment of the equipment and analyzed in conjunction with building insulation. The efficiency of air conditioners is often rated in SEER ratio, which is defined by the Air Conditioning, Heating, and Refrigeration Institute and provides a standard unit measure of performance. The higher the SEER rating of a cooling system the more energy efficient the system is. The SEER rating is the amount of BTU (British Thermal Units) of cooling output divided by the total electric energy input in watt-hours.
For heating systems in a building, Annual Fuel Utilization Efficiency (AFUE) is used to measure and compare the performance of different systems. DOE studies have indicated that even with known AFUE efficiency ratings, heat losses defined as idle losses contribute to degradation in heating system efficiency,
To analyze energy consumption of heating and air conditioning systems (HVAC), we evaluate the building’s R-Value in comparison to the energy efficiency of the current heating and air conditioning systems. The energy demand evaluation includes a cost-benefit analysis comparing options in either HVAC system upgrade and/or improvements to the building’s insulation R-Value. By comparing the buildings R-Value in conjunction with HVAC efficiency performance, projects offering the greatest cost effectiveness are identified. The building’s R-Values can be measured using FLIR Systems infrared camera and software system. In this manner, the replacement cost of an HVAC system and costs to improve the building’s R-Value are analyzed to measure economic benefits. This information will allow the building owner to make an informed decision on whether any energy efficiency investment into HVAC upgrade or improvement to R-Value demonstrate economic benefit, i.e. positive financial return.
Consideration for heating and cooling systems upgrades are assessed by equipment SEER and AFUE ratings, installation costs, and efficiency payback. After equipment assessment is complete, proposals will be provided along with estimates for upgrade costs and payback analysis.
Benchmark and Analyze Energy Intensity
After conducting the energy audit, and compiling data on energy usage by activity category, we benchmark and analyze energy projects offering the greatest opportunities. As illustrated in Figure 3, energy efficiency for lighting systems can be substantially improved by retrofitting legacy light fixtures with higher efficiency fixtures and bulbs.
The energy audit and analysis provide the framework to evaluate energy efficiency projects. By analyzing energy consumption and the economic benefits associated with the energy savings projects, the most efficient and economically beneficial initiatives are identified and ranked.
FIGURE 3: Energy Savings in KWH per Square Foot Figure 1 Kilowatt-hours (KWH) per Square Foot 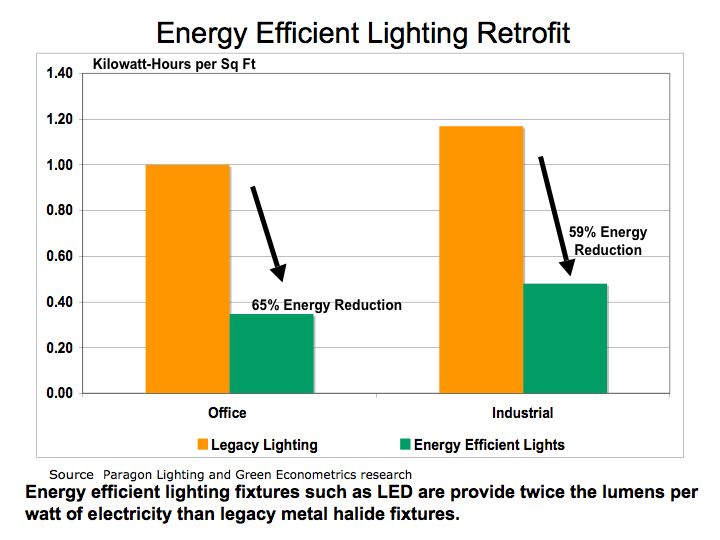
Establish Measurable Goals and Objectives
To establish relevant goals and objectives we are evaluating projects that are adhering to the SMART goal approach: specific, measurable, attainable, realistic and timely. Energy efficiency gains are most pronounced with lighting retrofits and energy monitoring in buildings in buildings and energy monitoring in vehicles.
After conducting an energy audit, analyzing energy consumption activities and the economics of energy efficiency projects, realistic and achievable energy savings goals are defined. Key performance metrics for energy savings are defined for buildings and vehicles. Key performance indicators are established for each project. For example, KWHs saved are defined for lighting retrofit projects, efficiency improvements for HVAC system upgrades, R-Value improvements for building insulation, and MPG gains for vehicles.
For each energy savings project, timelines are established with clearly defined milestones. Energy projects are presented with costs; expected energy savings measured in energy and dollar units, cost benefit analysis, and timelines.
Architect the Deployment of Energy Monitoring Systems
One of the first energy initiatives to consider in any energy savings project is the installation of an energy monitoring system for vehicles and buildings. Energy monitoring systems demonstrate the fastest and most economical pathways to achieving energy savings.
Energy monitoring systems for motor vehicles also demonstrate positive economic returns and real energy savings. The $180 energy-monitoring device with 10% fuel efficiency gain achieves breakeven at 14,500 miles with gasoline costing $2.50 a gallon.
Evaluate Feasibility of Renewable Energy Projects
Renewable energy projects such as solar and wind energy systems are often costly with long payback periods. Without tax incentives and grants, renewable energy projects are unable to demonstrate positive financial returns. However, utility rates for electric are expected to increase, improving the case for renewable energy projects. To improve the viability of alternative energy projects, energy efficiency projects such as lighting retrofit serve to lower energy consumption and therefore enhance the feasibility of solar and wind energy projects.
Obama, Energy Efficiency and Lighting Retrofit
As President Obama takes office, energy efficiency takes center stage. One of he fastest roads to energy efficiency is to reduce consumption and the simplest approach to energy conservation is to change a light bulb.
Compact Fluorescent Light bulbs (CFL) recommended by the U.S. Department of Energy (DOE) offer substantial savings to homeowners. In the commercial market, lighting fixtures consume the greatest amount of electric energy; three times the energy consumption of air conditioning. According to research report from the Energy Information Administration (EIA), Commercial Buildings Energy Consumption Survey lighting consumes the largest amount of electricity in commercial buildings as measured by Kilowatt-hours (KWH) per Square Foot
To calculate KWH, multiply the wattage of your lighting fixture x the yearly hours of operation for your facility divided by 1,000. KWH per square foot provides a useful means of measuring the energy intensity of a building. Just divide KWH by the total square footage of the building.
In an energy audit one can determine the energy intensity of your building as measured by KWH/Sq Ft. Figure 1 illustrates the energy intensity by end use according to the EIA’s report in 2008 Electricity Consumption (kWh) Intensities by End Use.
Figure 1 Lighting Consumes Most Energy 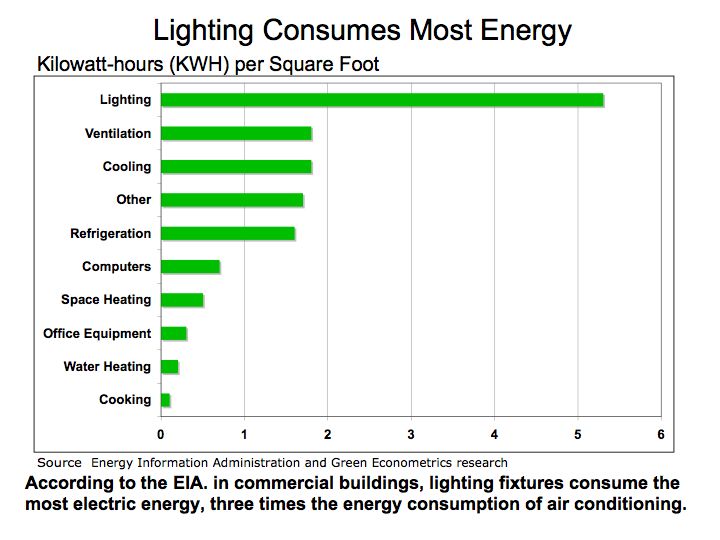
Furthermore, as part of the same research from the EIA, most commercial buildings are not using energy efficient lighting. The study finds that most commercial buildings, even those built after 1980, still rely on legacy incandescent and standard fluorescent light fixtures.
Figure 2 Most Commercial Buildings Lack Energy Efficient Lighting 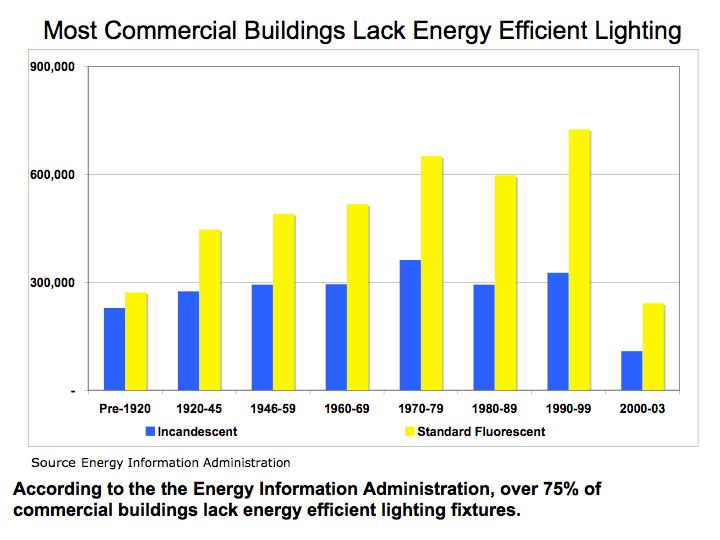
After your energy audit is complete and one knows their energy intensity the next step is to understand the efficiency of lighting systems. Lighting efficiency is measured in Lumens per Watt and is calculated by dividing the lumen output of the light by the Watts consumed. A lumen is one foot-candle foot-candle falling on one square foot of area.
While lumen output is important in measuring brightness, color temperature, measured in degrees Kelvin, indicates the hue color temperature of the light and is also important in evaluating lighting systems because lighting systems operating near 5500 degrees Kelvin simulate sunlight at noon. Energy efficient lighting fixtures provide twice the lumens per watt of electricity than legacy metal halide fixtures while offering higher color temperature enabling near daylight rendering.
Figure 3 Energy Efficient Lighting 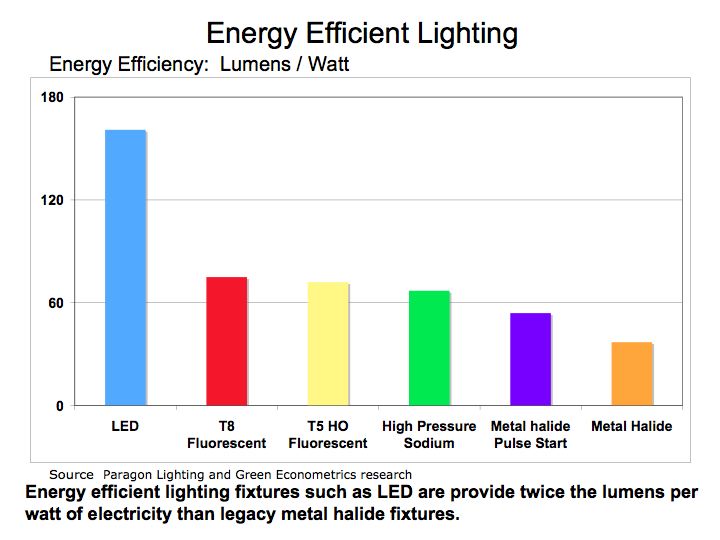
The bottom line is small steps sometimes produce big results. Retrofitting your building with energy efficient lighting systems saves energy, reduces operating expenses, and improves employee productivity and safety, while saving the environment. A 1.3 KWH reduction in power consumption reduces carbon dioxide (CO2) emissions by 1 pound. Coal generates about half the electric power in the U.S. and produces roughly ¾ of a pound of CO2 for every KWH of electric. In addition, the feasibility of alternative energy such as solar and wind are more viable by reducing energy consumption in buildings.
Vote the Economy by Voting for Energy
Access to energy was instrumental fueling the Industrial Revolution. Over the last 200 years, industrial nations have migrated from wood to coal and now to oil as a source of energy. During the 1700’s, wood was used for just about everything from fuel to constructing houses and building wagons and even tools. As demand for wood increased, the cost of wood rose as deforestation led to the scarcity. The scarcity of wood resulted in deteriorating economics.
It was the availability and access to coal that enabled the growth of Industrial Revolution by providing accessible energy. The Industrial Revolution was predicated upon the availability of Labor, Technology, Capital, and Energy. Scarcity of any of these inputs could undermine economic growth, as was the case with capital during the Great Depression of the 1930’s and the Energy Shock of the 1970’s.
Oil, driven by rapid growth in automobile usage in the U.S, has replaced coal as the main energy fuel. According to the Energy Information Administration (EIA), the 70% of oil consumption in the U.S. is for transportation .
Figure 1 US Oil Imports 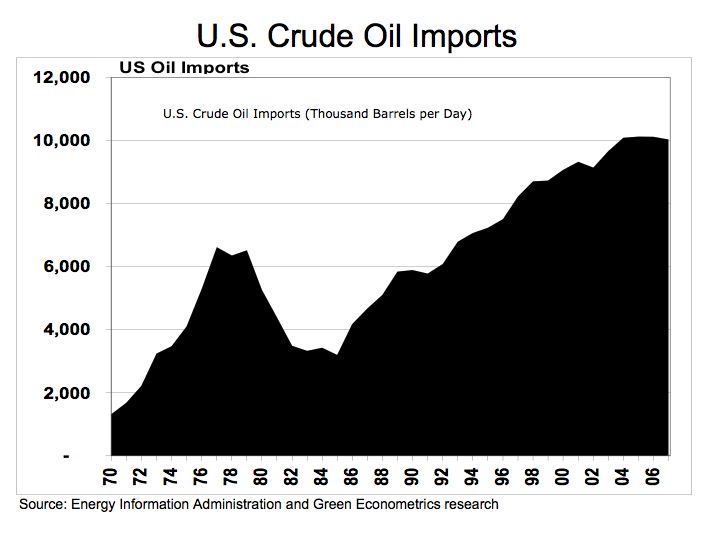
Figure 1 illustrates US historical oil imports, as measured by the Energy Information Administration in U.S. Crude Oil Field Production (Thousand Barrels per Day) that dates back to 1970. The EIA provides oil import data dating back to 1910. To estimate the amount of money the US spends on oil imports every year, we can use the data from the State of Alaska Department of Revenue, which provides historical data on the price of oil an derive an average yearly figure.
Figure 2 US Oil Import Spending 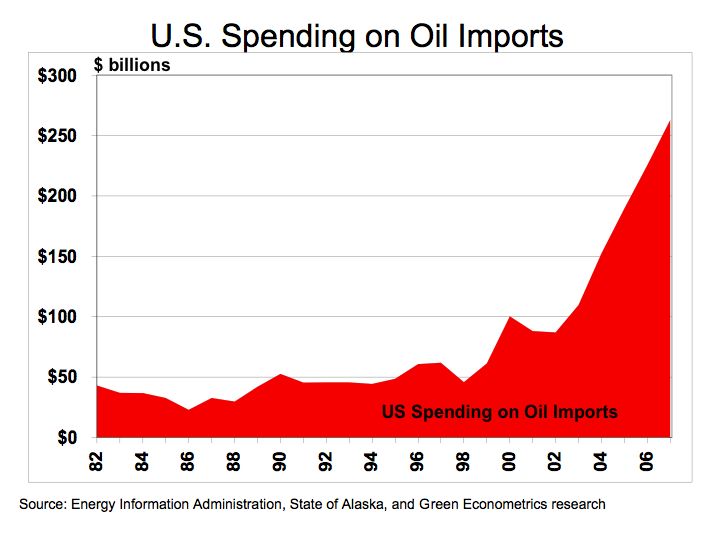
Figure 2. appears quite staggering given the amount of money we send to oil producing countries. The US is spending hundreds of billions to import oil. According to the EIA, the US imported an average of 10,031,000 barrels per day equating to $263 billion in imported oil during 2007 when the State of Alaska measured the yearly average spot price for a barrel of oil at $72.
According to Solarbuzz, Germany leads the world in solar photovoltaic (PV) installations with 47% of the market while China increased its market share of PV production from 20% to 35%. The US accounts for 8% of the world solar PV installations. Solarbuzz indicates the global solar PV industry was $17 billion in 2007 and the average cost of solar electricity is $0.2141 per KWH. If a portion of our $260 billion sent to oil producing countries were to be invested into solar energy, perhaps the US would not lag the world in alternative energy.
The bottom line is that the money spent on importing oil has a deleterious impact on our economy and continues our dependence on hydrocarbon fuels producing carbon and other harmful byproducts that negatively impact our climate and health of our children. The longer we are dependent on oil, the longer our economy and environment suffer. Use your vote for alternative energy and not drill baby drill.
Energy Crisis – What Can We Do
As energy and food prices set new world records, what can we do at home to avert the crisis? Food prices are rising because corn is diverted from food production to producing ethanol for use as fuel in motor vehicles and is exacerbated by the recent flooding in the Mid West. Oil prices continue to escalate as demand for oil in developing countries increases and supply constraints, rising production costs, and limited refining capacity constrain the supply of oil. These factors continue to weigh against homeowners that will face escalating fuel bills to heat or cool their homes. There are some viable alternative energy solutions including wind and solar as well as home insulation that should offset the rising cost of energy. As far as food for fuel, we need to break our dependence on hydrocarbons which continues to impact our climate and weather and transfer our wealth to oil producing nations
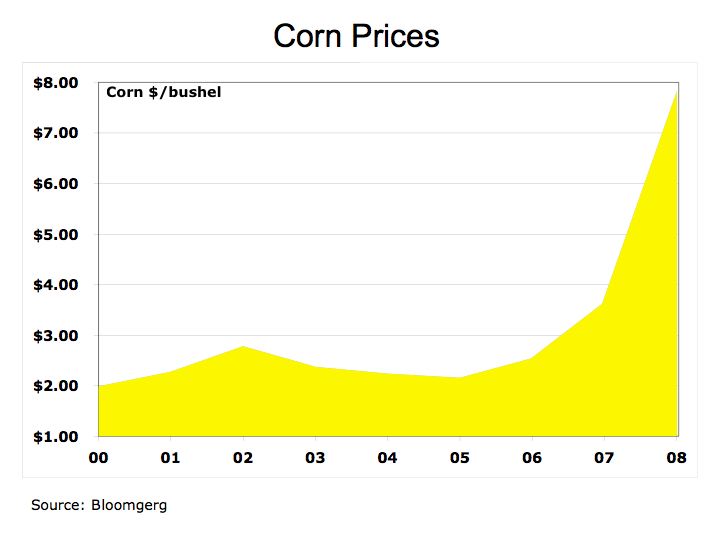
Corn Prices have increased 264% since 2005. The rising price of corn used for ethanol is causing farmers to plant more corn and less production of other grains such as wheat or soy. Lower supply of grains is driving up food prices. Rising food prices is most debilitating to the poor, especially those in developing countries.
Figure 1 Corn Prices
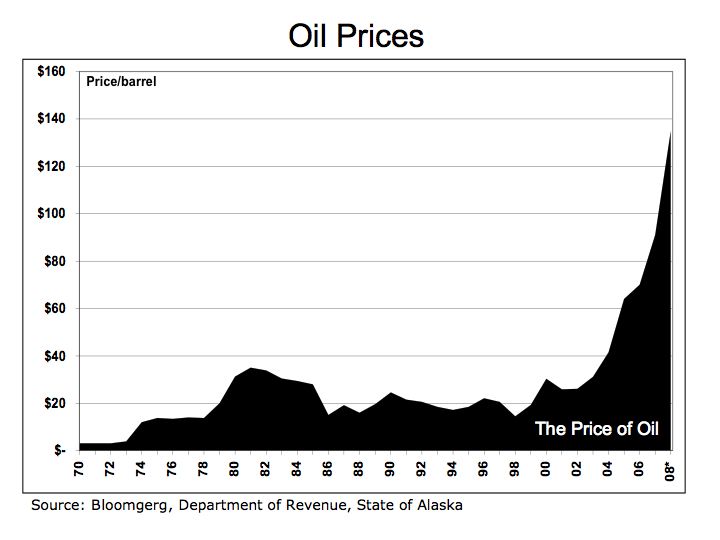
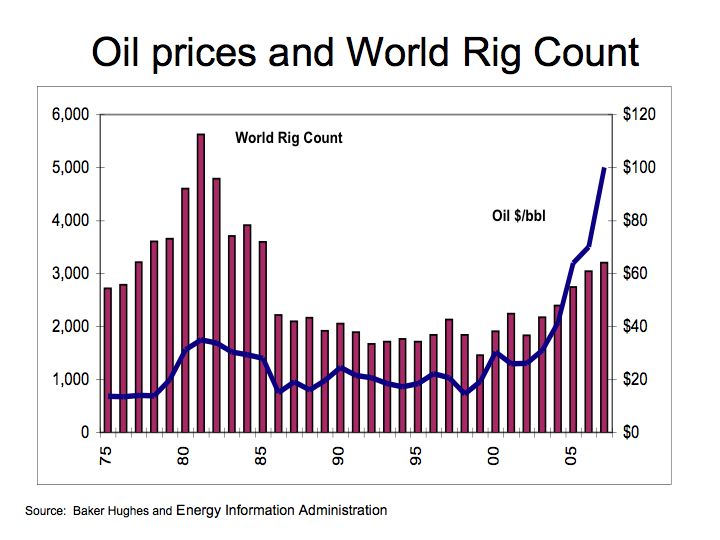
Growing demand for oil and questions over Peak Oil suggesting even with oil prices rising to such an elevated level, production is rather anemic. According to the Energy Information Administration (EIA) , while oil prices increased 344% since 2001, oil production from OPEC is up only 1.2% over this same period.
Figure 2 Oil Prices
According to the EIA The demand for oil in China is growing at an 8.1% CAGR over the last five years. With demand for oil growing significantly in developing countries and despite production developments in Saudi Arabia and the 5-to-8 billion deepwater Tupi oil discovery in over Brazil The Tupi announcement in January 2008 is the world’s biggest oil find since a 12-billion-barrel field discovered in 2000 in Kazakhstan according the International Herald Tribune. These new oil discoveries are often in inhospitable areas or deep ocean environments, which makes extraction costly and difficult.
Figure 3 Rig Count and OPEC Oil Production
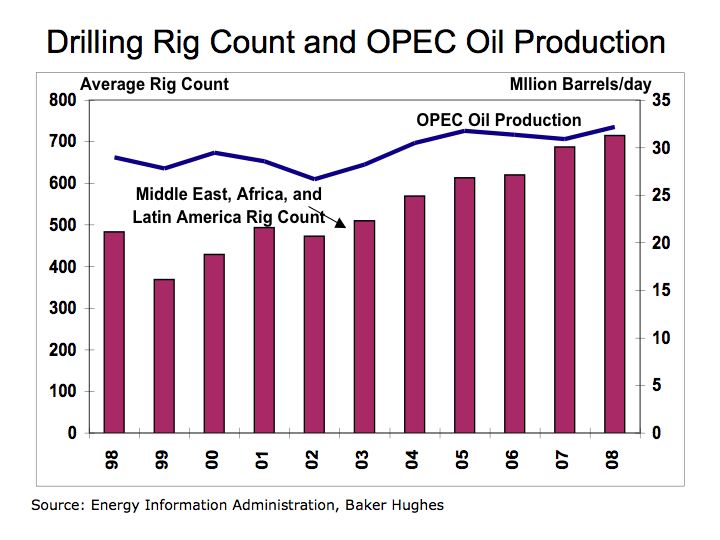
What can we do? . Forget drilling for more oil, electric vehicles and investment into alternative energy is the only way to avert this crisis. OPEC area drilling activity is up 48% since 1998 and yet, despite dramatically higher oil prices, up 5 fold since 1998, OPEC oil production increased only 11% over 1998.
Homeowners could begin to deploy energy saving and alternative energy systems. Wind and solar energy could help reduce some of the pain. As consumer embrace hybrids, electric, and fuel cell vehicles, wind and solar should begin to offer a stronger value proposition. Energy saving tips such as compact fluorescent bulbs, on-demand hot water heaters, and thicker home insulation products should help reduce heating and cooling costs.
According to the American Wind Energy Association AWEA a turbine owner should have at least a 10 mph average wind speed and be paying at least 10 cents per Kilowatt-hour (KWH) for electricity. There are electric utility and tax credits available in some areas. There are also questions regarding zoning restrictions, and whether to connect to batteries for energy storage, or directly to your electric utility. Consult the Wind Energy Resource Atlas of the United States Wind Resource Maps to get a better understanding of wind speeds in your area.
Cost wind systems will vary depending on model and installation costs will vary by your location. The Whisper 500 from Southwest Windpower offers electric production of 538 KWK/month at 12 mph (5.4 m/s). The system weighs 155 lb (70 kg) and has blade span of 15 feet (4.5 m) and must be mounted on a tower in cement. At 538 KWH per month, that is enough energy to cover the needs a modest house with conservative electric usage. Small wind systems can range from under $1,000 to over $20,000 with a payback period of approximately five years depending on wind resources and utility rates.
Solar photovoltaic (PV) panels cost an average of $4.80 per watt according to Solarbuzz which is about $0.24 per KWH over a 20 year life of the PV system. With an average output of approximately 10.6-watts/square foot (114 w/m^2), a five KW PV systems would cover 515 square feet (47.8 sq. meters) costing approximately $36,000 before credits and tax benefits and produce about 490 KWH per month. Of course installations costs are extra, but with PV production ramping and new PV suppliers entering the market we can expect costs to decline. Federal and local tax credits as well as selling unused electric to your local utility offers economic value on the margin.
The economic value is expected to increase as costs decline and electric rates increase and we can expect significantly higher utility rates in the near future. The economics of zero carbon emissions is not even measured as a benefit to the consumer. We are just beginning to see the cost impact of extreme weather and climate change.
Consumers should try to ameliorate the rising cost of energy by investing into solar and wind. There are several companies offering complete installation services. Among these include: Akeena Solar (AKNS) in California and The Solar Center in New Jersey.
The bottom line: energy and food prices are creating a crisis for consumers globally and there are several initiatives that could help minimize the pain. In addition, the erratic weather patterns around the world may be just a prelude to climate changes due to the impact of carbon dioxide on climate, which may cost us much more in the long run. Let’s stop the drain of wealth cause by oil and invest into clean and renewable energy solutions.
Oil Tax could Facilitate Alternative Energy Development
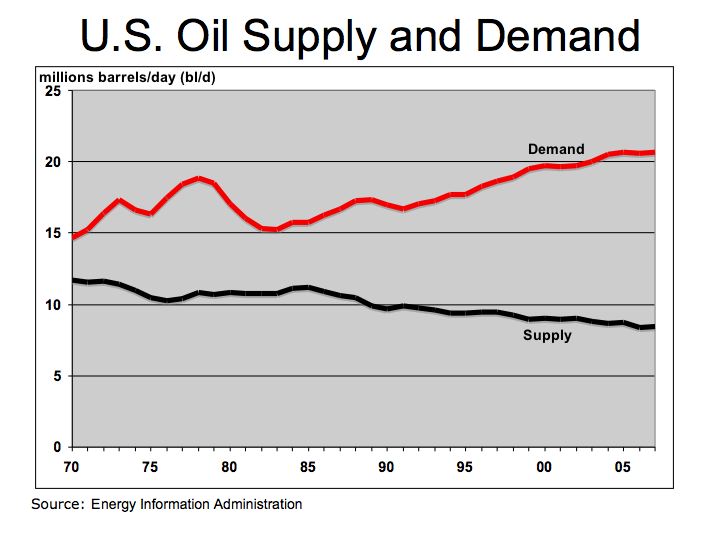
Oil continues to trade above $100 per barrel with the NYMEX CRUDE FUTURE closing at $101.84 on the last day of February 2008 and the US House of Representative passes legislation to raise $18 billion in new taxes for Big Oil to foster development of alternative energies. While President Bush plans to veto the legislation and Republicans claim the legislation unfairly impacts the oil industry, let’s look at the numbers. The legislation calls $18 billion tax over the next ten years so the impact amounts to $1.8 per year. The oil demand is approximately 20.6 million barrels per day according the to latest data from the Energy Information Administration. With oil at $100 per barrel the US will spend about $2 billion a day on oil and that equates to over $750 billion a year. In comparison to the total amount of oil we use, the tax is about 2/10th of one percent.
Figure 1 US Oil Supply and Demand
Well maybe that’s not a fare comparison. The bill, H.R. 6, the CLEAN Energy Act. would roll back two tax breaks for the five largest U.S. oil companies and offer tax credits for energy efficient homes and gas-electric hybrid vehicles.
According to the CNN article, the money to be collected over the 10-year period would provide tax breaks for solar, wind and other alternative energies and for energy conservation. The legislation was approved 236-182, and is expected to cost the five largest oil companies an average of $1.8 billion a year over that period, according to an analysis by the House Ways and Means Committee. So in other words this bill just repeals tax breaks given to Big Oil to become more competitive in the global market.
Figure 2 Oil Prices and World Rig Count
So what is the $1.8 in tax impact on Big Oil? Let’s just look at the impact this would have if just Exxon Mobil Corp (XOM) had to endure the tax only. Exxon Mobil generated $404 billion revenues in 2007, which means if Exxon had to face this tax only, it would be less than ½ of 1% of revenues. Considering that some states impose a 6% sales tax on consumers, a tax impact of 0.2% on the largest oil companies seems rather innocuous.
If the world has to depend upon OPEC oil production, questions do arise over the expansion of oil production and OPEC’s willingness to supply oil despite oil over $100 per barrel. As figure 3 illustrates production among OPEC nations is faltering. Could this be a prelude to Peak Oil?
Figure 3 OPEC Oil Production
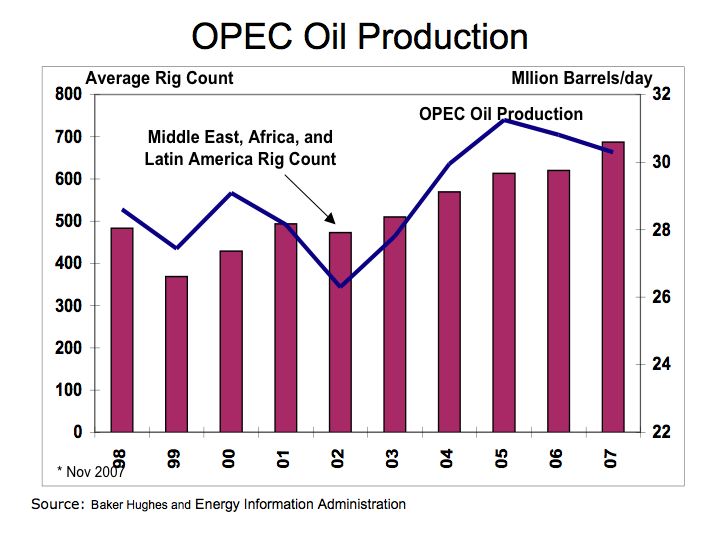
The bottom line is that without incentives and further research on alternative energies, the world continues to be held hostage to oil and hydrocarbon fuels which are directly linked to rising CO2 levels and climate change.
Hydrogen Fuel Cells – energy conversion and storage
World oil demand continues to rise despite efforts to limit demand. Renewable energies such as solar and wind have the potential to limit our dependence on hydrocarbon fuels, but one issue remains prominent – storing energy. While the sun provides radiation for solar and generates wind, when its cloudy or dark we are unable to produce solar energy. One must provide a means to store that energy for when it is needed. Fuel cells enable energy conversion and fill a reliable role in alternative energy strategies.
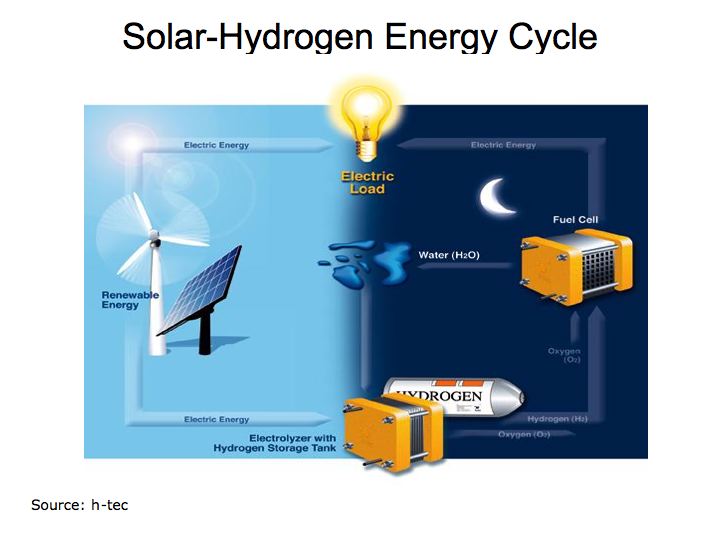
A chart compiled by Wasserstoff-Energie-Systeme GmbH (h-tec) provides an easy to understand depiction of how fuel cells integrate with solar and wind energy solutions. Fuel cells provide the enabling technology that allows hydrogen to serve as the storage and transport agent. The solar energy that is produced during the daylight hours is used in an electrolyzer to produce hydrogen that in turn, is then used to operate the fuel cell producing electricity at night when it is needed. This process is called the solar-hydrogen energy cycle. Figure 1 illustrates the importance of energy storage in adopting alternative energies.
Figure 1 Solar-Hydrogen Energy Cycle
Demand for oil and hydrocarbon fuels continues to grow despite effort to conserve. Total Petroleum Consumption shows increasing oil demand from China and India while demand in the U.S. grows at a slower pace. With improving efficiencies and lower production costs, fuel cells could provide a solution to our appetite for oil in motor vehicles. Figure 2 describes how fuel cells and electrolyzers (fuels running in reverse) work.
Figure 2 Fuel Cells
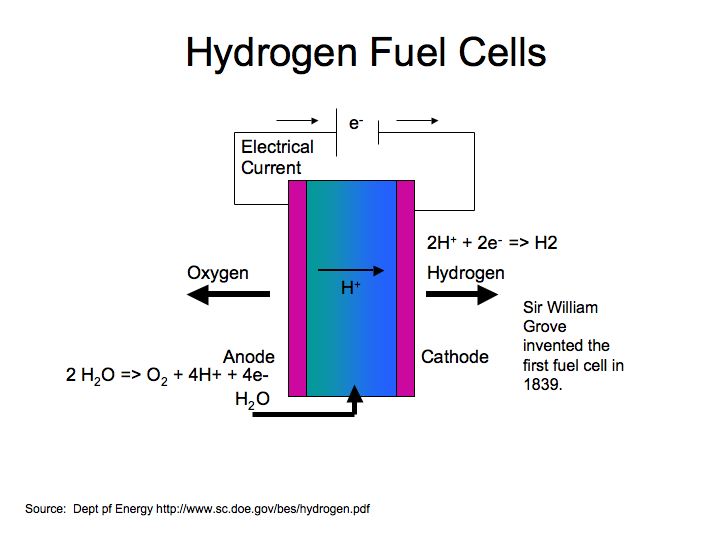
Fuel cells are devices that convert chemical to electrical energy – in essence; it’s an electrochemical energy conversion device. In the chemical process of a fuel cell, hydrogen and oxygen are combined into water, and in the process, the chemical conversion produces electricity. In the electrolyzer, an electrical current is passed through water (electrolysis) and is the reverse of the electricity-generating process occurring in a fuel cell.
Hydrogen fuel cells offer tremendous opportunity for storing and transporting energy enabling broad applications for home, business, motor vehicle and large-scale energy projects. The follow provides a review of current technologies applicable to hydrogen fuel cells. Factors to consider in using hydrogen fuel cells include operating efficiency, operating temperature range, and material used for the electrolyte (the catalyst that separates hydrogen) and fuel oxidant (that transfers the oxygen atoms).
Figure 3 Hydrogen Fuel Cell Technologies
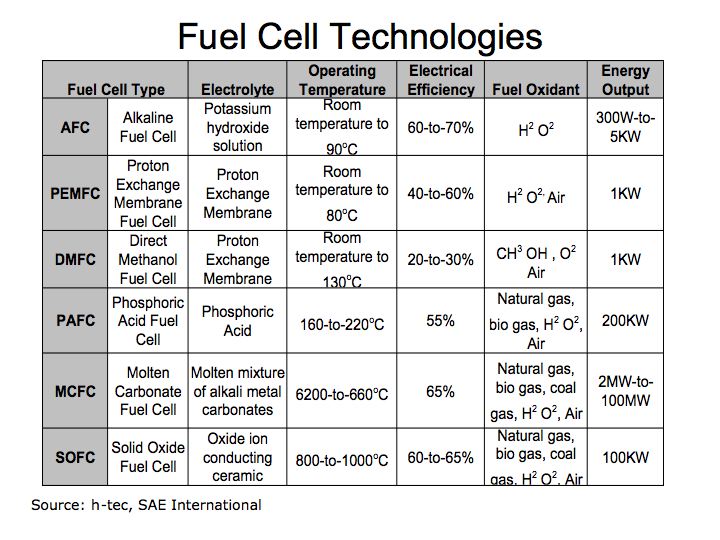
One of the most practical fuel cell technologies for motor vehicle use include Proton Exchange Membrane (PEM) because it operates at normal ambient temperatures and offers high electrical efficiency. There are several useful web sites that illustrate the benefits of hydrogen fuel cells. h-tec and the National Renewable Energy Laboratory provide some very useful information on hydrogen fuel cells.
We are also seeing progress on fuel cell vehicles that could ultimately ameliorate are demand for oil, if not eliminate it entirely, all with no carbon dioxide or other harmful emissions. We see most major automakers developing hydrogen powered fuel cell vehicles. GM is making progress introducing several models using GM’s Fuel Cell Technology.
Honda’s experimental hydrogen refueling station in Torrance, CA uses solar to produce hydrogen for their hydrogen fuel cell vehicle Honda’s FCX .
The bottom line is that the availability of cheap oil is on the decline and without further research on alternative energies we may find the global economy in a very tenuous position. Further research into solar and hydrogen fuel cells could significantly reduce our dependence on oil.