Category Fuel Cells

Energy Perspective
After reviewing oil data from the Energy Information Administration (EIA), Global Petroleum Consumption , it may be helpful to put energy consumption into perspective. Most of us are quite familiar with alternative energy such as solar and wind, but the reality is, even if solar and wind could supply all of electric energy needs, the majority of our energy needs is still predicated on access to oil.
While industry experts and scientist debate whether more drilling will ameliorate the energy challenge we face, let’s look at a couple of data points. Figure 1 US Oil Field Oil Production and Drilling Rigs – illustrates that higher drilling activity as measured by Baker Hughes Rig Count data does not necessarily correlate to more oil production as measured by US Oil Field Production by the EIA. Higher drilling activity does not produce more oil.
Figure 1 US Oil Field Production and Drilling Rigs 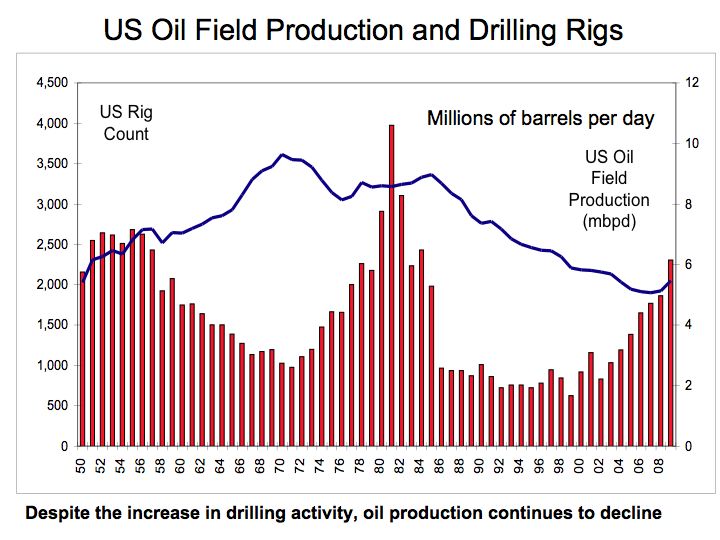
Source: Energy Information Administration and Baker Hughes research
Despite the large investment in drilling rigs that more than doubled from 1,475 in 1974 to over 3,100 in 1982, US oil production remained relatively flat. Moreover, even the most recent drilling expansion activity that again more than doubled from 1,032 rigs in 2003 to over 2,300 rigs in 2009, resulted in relatively flat oil production, suggesting that on the margin unit oil production per drilling rig was declining. Perhaps even more disturbing is that the most recent drilling activity in the US was accomplished through extensive use of technology. Seismic imaging technology is being used to better locate oil deposits and horizontal drilling technologies are employed to more efficiently extract the oil, yet oil production still lags historic levels. While on the margin, newly announced offshore drilling could add to domestic oil production, extraction costs of oil will continue to rise adding to further oil price increases.
However, what is most profound is our dependence on oil for most of our energy needs similar to how wood was used for fuel construction material during the 1300’s and 1600’s. If we translate energy consumption into equivalent measuring units such as kilowatt-hours, we can compare and rank energy consumption. Although electricity is captured through consumption of several fuels most notably coal, a comparison of energy usage between oil and electric provides an interesting perspective.
Figure 2 Energy Perspective – provides a simple comparison of the consumption of oil and electricity measured in gigawatt-hours (one million kilowatt hours). A barrel of oil is equivalent to approximately 5.79 million BTUs or 1,699 KWH and the US consumed approximately 19.5 million barrels per day equating to 12 million gigawatt-hours a year. The US uses 4 million gigawatt-hours of electric energy annually. The critical point is that even if solar and wind supplied all of our electric energy needs, it would still only comprise 30% of our total energy needs. Therefore, without an energy strategy that facilitates migration towards a substitute for oil, particularly for transportation, we are missing the boat.
Figure 2 Energy Perspective 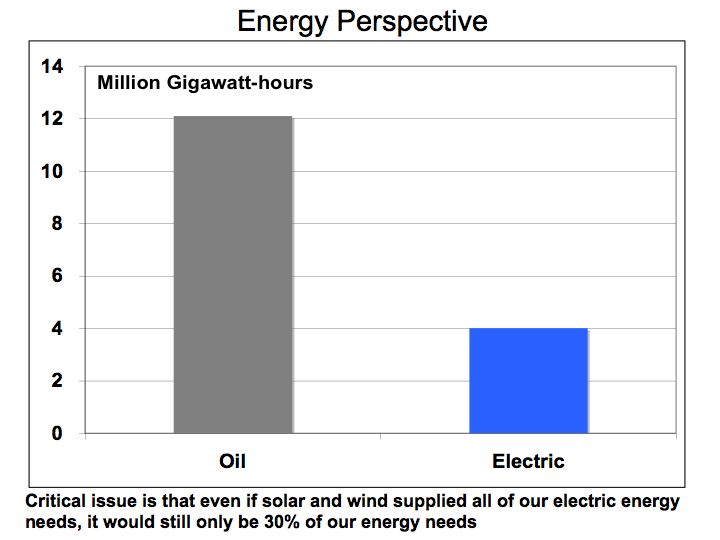
Source: Energy Information Administration and Green Econometrics research
It’s not all doom and gloom. Technologies are advancing, economies of scale are driving costs lower, and the economics for new approaches to transportation are improving. From hybrids and electric vehicles benefiting from advances lithium-ion batteries to hydrogen fuel cell vehicles getting 600 miles on a tank of fuel. These advanced technologies could mitigate our addiction to oil, however, without formulating an energy strategy directing investments towards optimizing the economics, energy efficiency, environment, and technology, we may miss the opportunity.
The bottom line is that oil is supply-constrained as there are no readily available substitutes, and therefore, without a means to rapidly expand production; supply disruptions could have a pernicious and painful impact on our economy, national security, and welfare.
A Case for Natural Gas CHP Systems
A combined heat and power system (CHP) is the cogeneration or simultaneous generation of multiple forms of energy in an integrated system. CHP systems consume less fuel than separate heat and power generating systems. According to the Environmental Protection Agency in their Combined Heat and Power Partnership report, (EPA), CHP systems typically consume only three-quarters the amount of energy separate heat and power systems require. By combining both heat and power into the same energy systems, efficiency gains for the total system. Heuristically, high temperature and high pressure fuel ratios results in higher efficiency systems. In addition, the thermal energy produced from the CHP system could be used to drive motor applications or to produce heat, steam, and hot water.
As an initial step to reducing greenhouse gas (GHG) emissions, natural gas turbines could improve overhaul efficiency of 65-80%. In addition, the CHP offers lower greenhouse gas (GHG) emissions in comparison to conventional standalone systems. Gas turbines CHP systems operate under a homodynamic principle called the Brayton cycle. The design characteristics of a CHP gas turbine provide: 1) high electric and total system efficiency; 2) high temperature/quality thermal output for heating or for heat recovery steam power electric generation; 3) offer options for flexible fuels such as propane, natural gas, and landfill gas; 4) high reliability with 3-to-5 years before overhaul running 24/7; and 5) significantly lower GHG emissions.
Figure 1 Gas Turbine CHP System
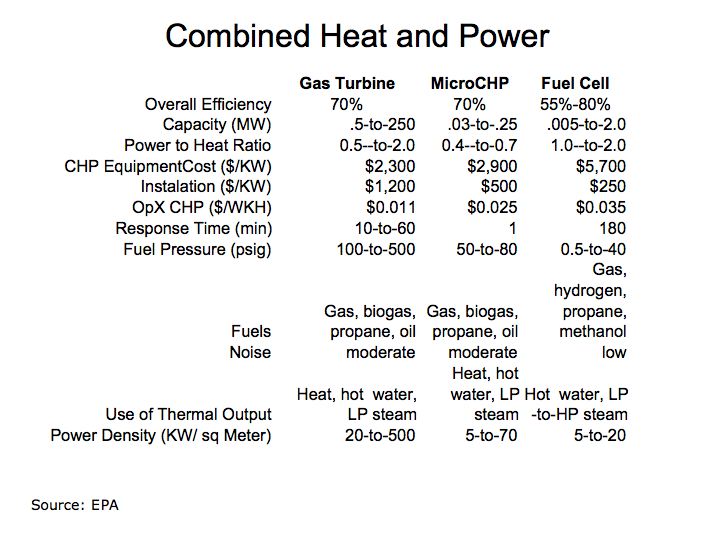
Figure 1 demonstrates the mechanics and variables of a CHP system. In summary, the CHP technology enables the supply of efficient heat and power while minimizing GHG emissions. Total CHP efficiency is defined as the sum of net power produced plus the thermal output used for heating divided by total fuel input.
The use of methane (natural gas) as the main fuel for the CHP system offers advantages because methane offers the highest hydrogen-to-carbon ratio among fossil fuels, thereby, combusting with the lowest GHG emissions. According to EPA data, the emissions NOx particulates from gas turbines ranges between 0.17-to-0.25 lbs/MWH with no post-combustion emissions control versus 1.0-to-4.2 lbs/MWH for coal fed boilers. The carbon content of natural gas is 34 lbs carbon/MMBtu in comparison to coal at 66 lbs of carbon/MMBtu.
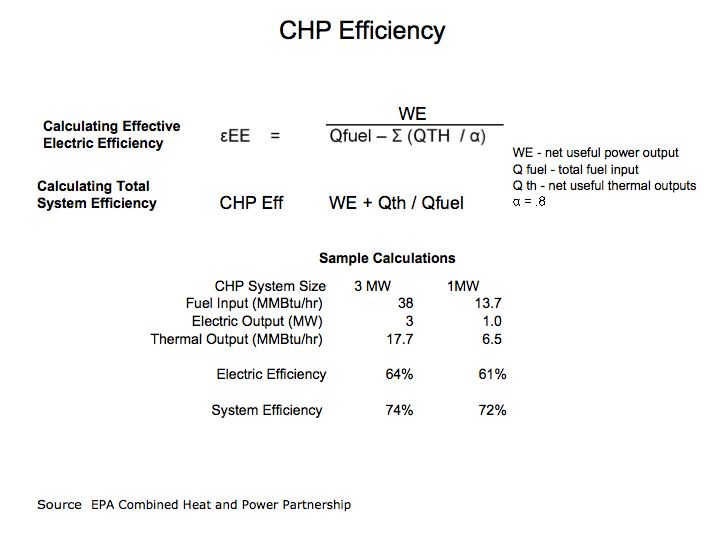
There are two valuable metrics used to measure efficiency for CHP systems. One is the total system efficiency which measures the overall efficiency of the CHP system including heat and electric and the other is the effective electric efficiency which is useful in comparing the CHP electric production versus grid supplied power. These two metrics, the total system and effective electric efficiencies are important for evaluating CHP system. The following provides a guideline foe measuring these two efficiency metrics and can be found at EPA – Efficiency Metrics for CHP Systems
Figure 2 CHP Efficiency
The economics of the CHP system depends on effective use of thermal energy n the exhaust gases. Exhaust gases are primarily applied for heating the facility and could also be applied to heat recovery steam generators (HRSG) to produce additional electric power. The total efficiency of the CHP system is directly proportional to the amount of energy recovered from the thermal exhaust. Another important concept related to CHP efficiency is the power-to-heat ratio. The power-to-heat ratio indicates the proportion of power (electrical or mechanical energy) to heat energy (steam or hot water) produced in the CHP system. The following provides an overview of the economics of a CHP system.
Figure 3 CHP Economics
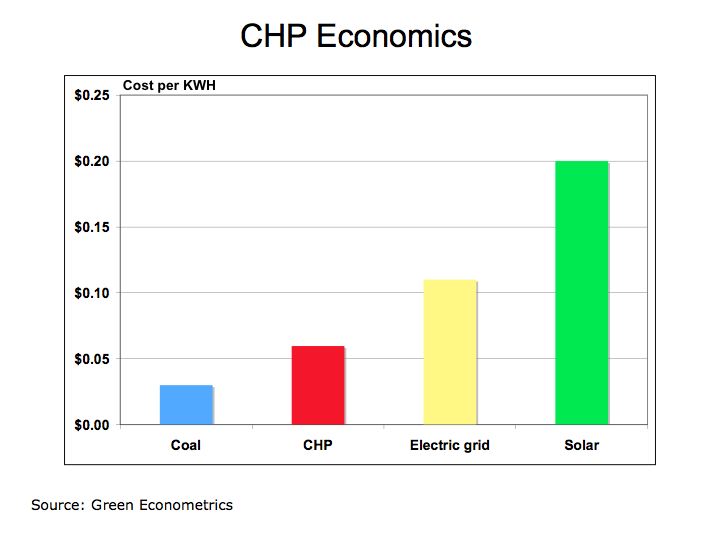
Figure 3 illustrates the economics of a CHP system in comparison to competing energy sources. While the CHP does not have the low cost of coal in producing electric, the economic value of reducing GHG emissions is quite significant and beyond the scope of this article. However, natural gas prices remain below that of oil and better ways of capturing heat exhaust will further improve CHP efficiency. The bottom line is that natural gas produces less GHG emissions than coal or oil therefore; businesses should consider the benefits of CHP as a source of heat and power.
Energy Storage – the Key to Alternative Energies
Energy storage enables the electric generated though solar photovoltaic devices or wind turbines to be used when it’s dark, cloudy, or calm. As Nathan Lewis, Professor of Chemistry, Division of Chemistry and Chemical Engineering Lewis Group at California Institute of Technology, framed it, energy storage is integral in facilitating the development of alternative energy programs.
While hydrogen fuel cells offer future promise to our energy storage needs, battery technologies could provide some immediate results. As with all technologies there are tradeoffs.
There are several competing approaches to battery development. Among these approaches include the lead acid, nickel metal hydride, and lithium-ion cells.
Lead acid: batteries are the oldest approach and are typically found under the hood of your car or truck. Nickel metal hydride batteries have been around for more than 25 years and are used in hybrid electric vehicles such as the Toyota Prius. Lithium-ion cells have been on the market since 1991 and are used extensively in cellular phones, laptop computers, and digital cameras.
There are several issues in dealing with batteries such as environmental, economic, power, safety, and useful life. Lithium-ion cells possess many advantages, but incidences such as laptop computers erupting into flames, leaves many concerns for applicability in motor vehicles. Despite the setbacks, lithium-ion technology could provide solutions to the electric vehicle.
Why is this battery technology important? Solving the energy needs of the motor vehicle has profound implications in solving our energy needs. Nearly 70% of our oil consumption is direct towards transportation essentially motor vehicles. Without a dedicated strategy to address the transportation market and specifically the automobile, our progress towards energy independence is an illusion.
There are several issues with the nickel metal hydride batteries currently used in hybrid electric vehicles. Nickel metal hydride batteries are heavy, bulky, require large storage space in the vehicle, and don’t offer great acceleration. Lithium-ion offer power, size, and weight advantages over nickel metal hydride batteries, and numerous companies are working to improve performance and ameliorate the negative connotations associated with flaming laptops.
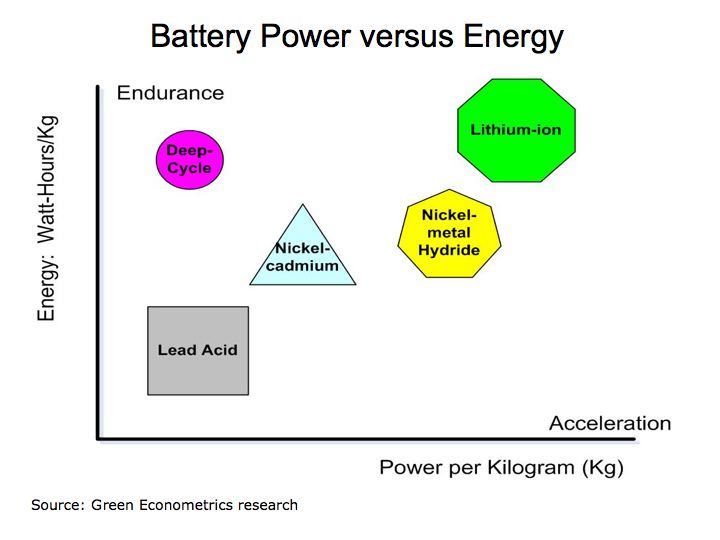
One of the basic concepts in dealing with batteries is the measure of battery energy versus battery power. The amount of battery energy refers to endurance, how long will the battery last and is often measured in ampere-hours or watt-hours per kilogram of battery weight. The amount of power refers to the energy draw and is akin to delivering acceleration in an electric vehicle.
The following figure illustrates the measurement of battery power and energy. Lithium-ion batteries are differentiated in their ability to bridge the power and energy tradeoff.
Figure 1 Battery Power vs Energy
For home renewable energy projects such as solar or wind energy deployment, it is often recommended that a deep-cycle battery be used. Deep cycle batteries are able to draw down 70%-80% of their full power, offering longer energy life than a typical lead acid battery. In addition, newer materials such as Gel batteries and absorbed glass mat (AGM) that are sealed, maintenance free, and can’t spill, and therefore, are less hazardous. For a tutorial on home use batteries visit
BatteryStuff.com
An interesting perspective on battery design is presented Energy vs. Power by Jim McDowall. For a primer on how batteries work visit presented Battery Power The premise is that there are tradeoffs between designing a battery for high power versus high energy.
Research conducted at Stanford University suggest the battery life of lithium-ion batteries could be extended through the use of Nano-technology. The bottom line: energy storage is paramount to sustaining the development of alternative energies and battery technologies play a critical role in energy storage and further expanding the role of alternative energies.
Hydrogen Fuel Cells – energy conversion and storage
World oil demand continues to rise despite efforts to limit demand. Renewable energies such as solar and wind have the potential to limit our dependence on hydrocarbon fuels, but one issue remains prominent – storing energy. While the sun provides radiation for solar and generates wind, when its cloudy or dark we are unable to produce solar energy. One must provide a means to store that energy for when it is needed. Fuel cells enable energy conversion and fill a reliable role in alternative energy strategies.
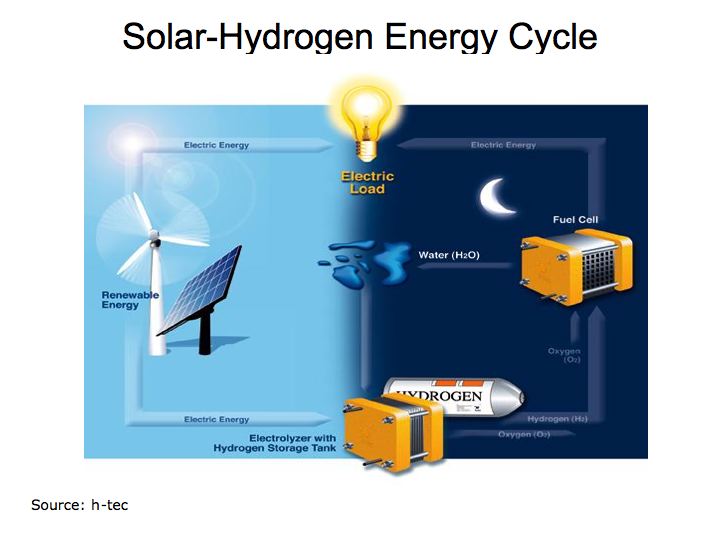
A chart compiled by Wasserstoff-Energie-Systeme GmbH (h-tec) provides an easy to understand depiction of how fuel cells integrate with solar and wind energy solutions. Fuel cells provide the enabling technology that allows hydrogen to serve as the storage and transport agent. The solar energy that is produced during the daylight hours is used in an electrolyzer to produce hydrogen that in turn, is then used to operate the fuel cell producing electricity at night when it is needed. This process is called the solar-hydrogen energy cycle. Figure 1 illustrates the importance of energy storage in adopting alternative energies.
Figure 1 Solar-Hydrogen Energy Cycle
Demand for oil and hydrocarbon fuels continues to grow despite effort to conserve. Total Petroleum Consumption shows increasing oil demand from China and India while demand in the U.S. grows at a slower pace. With improving efficiencies and lower production costs, fuel cells could provide a solution to our appetite for oil in motor vehicles. Figure 2 describes how fuel cells and electrolyzers (fuels running in reverse) work.
Figure 2 Fuel Cells
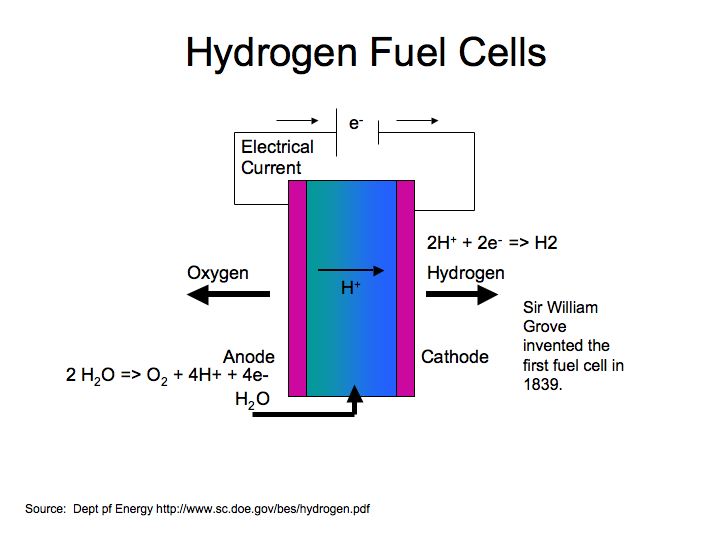
Fuel cells are devices that convert chemical to electrical energy – in essence; it’s an electrochemical energy conversion device. In the chemical process of a fuel cell, hydrogen and oxygen are combined into water, and in the process, the chemical conversion produces electricity. In the electrolyzer, an electrical current is passed through water (electrolysis) and is the reverse of the electricity-generating process occurring in a fuel cell.
Hydrogen fuel cells offer tremendous opportunity for storing and transporting energy enabling broad applications for home, business, motor vehicle and large-scale energy projects. The follow provides a review of current technologies applicable to hydrogen fuel cells. Factors to consider in using hydrogen fuel cells include operating efficiency, operating temperature range, and material used for the electrolyte (the catalyst that separates hydrogen) and fuel oxidant (that transfers the oxygen atoms).
Figure 3 Hydrogen Fuel Cell Technologies
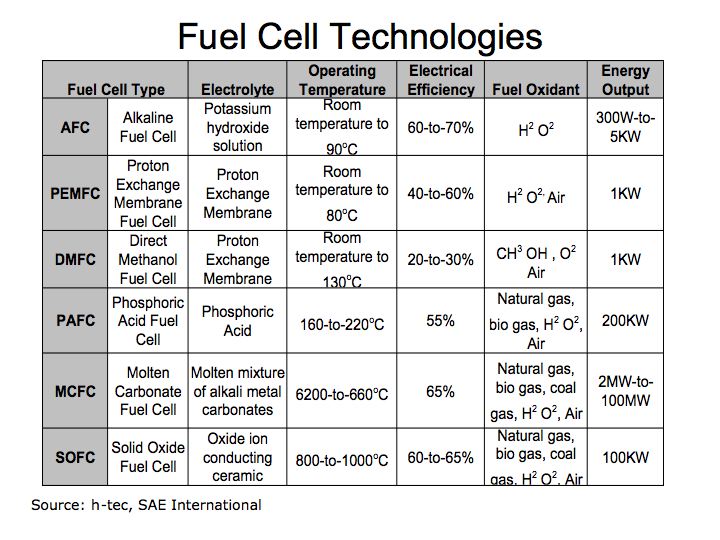
One of the most practical fuel cell technologies for motor vehicle use include Proton Exchange Membrane (PEM) because it operates at normal ambient temperatures and offers high electrical efficiency. There are several useful web sites that illustrate the benefits of hydrogen fuel cells. h-tec and the National Renewable Energy Laboratory provide some very useful information on hydrogen fuel cells.
We are also seeing progress on fuel cell vehicles that could ultimately ameliorate are demand for oil, if not eliminate it entirely, all with no carbon dioxide or other harmful emissions. We see most major automakers developing hydrogen powered fuel cell vehicles. GM is making progress introducing several models using GM’s Fuel Cell Technology.
Honda’s experimental hydrogen refueling station in Torrance, CA uses solar to produce hydrogen for their hydrogen fuel cell vehicle Honda’s FCX .
The bottom line is that the availability of cheap oil is on the decline and without further research on alternative energies we may find the global economy in a very tenuous position. Further research into solar and hydrogen fuel cells could significantly reduce our dependence on oil.
The Economics of Energy – why wind, hydrogen fuel cells, and solar are an imperative
From the Industrial Revolution we learned that economic growth is inextricably linked to energy and as a result, our future is dependent upon equitable access to energy. When the Stourbridge Lion made entry as the first American steam locomotive in 1829 it was used to transport Anthracite coal mined in nearby Carbondale, PA to a canal in Honesdale that in turn linked to the Hudson River and onto New York City. Coal fueled the growth of New York and America’s Industrial Revolution because coal was cheap and more efficient than wood.
Advances in science and technology gave way to improvements in manufacturing, mining, and transportation. Energy became the catalyst to industrial growth. Steam power such as Thomas Newcomen’s steam powered pump in 1712 developed for coal mining and James Watt’s steam engine in 1765 were initially used to bring energy to market.
In terms of heating efficiency, coal at the time offered almost double the energy, pound for pound, in comparison to wood. Energy Units and Conversions KEEP Oil offers higher energy efficiencies over coal and wood, but as with most hydrocarbon fuels, carbon and other emissions are costly to our economy and environment.
With rapid growth in automobile production in the U.S., oil became the predominant form of fuel. According to the Energy Information Administration, in 2004 the U.S. spent over $468 billion on oil.
Figure 1 U.S. Energy Consumption by Fuel
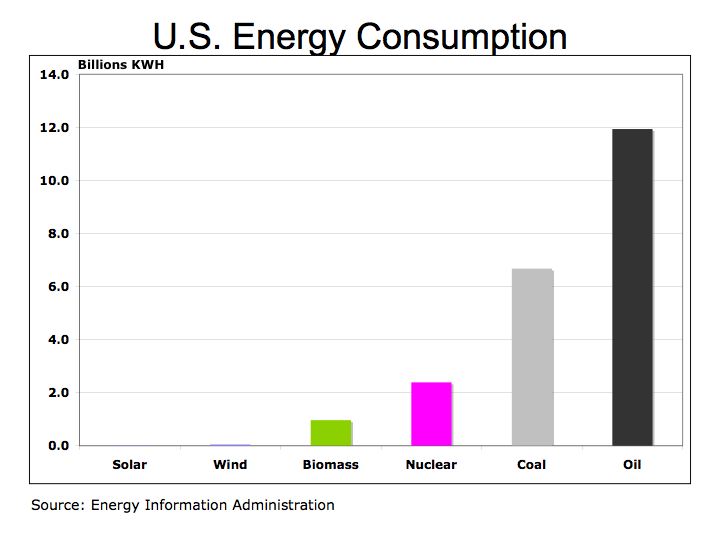
We all need to become more conversant in understanding energy costs and efficiency and as a corollary, better understand the benefits of renewable energy such as solar, wind, and hydrogen fuel cells. A common metric we should understand is the kilowatt-hour (KWH) – the amount of electricity consumed per hour. The KWH is how we are billed by our local electric utility and can be used to compare costs and efficiency of hydrocarbon fuels and alternative energies.
One-kilowatt hour equals 3,413 British Thermal Units (BTUs). One ton of Bituminous Coal produces, on the average, 21.1 million BTUs, which equals 6,182 KWH of electric at a cost of about $48 per short ton (2,000 pounds). That means coal cost approximately $0.01 per KWH. To put that into perspective, a barrel of oil at $90/barrel distilled into $3.00 gallon gasoline is equivalent to 125,000 BTUs or 36.6 KWH of energy. Gasoline at $3.00/gallon equates to $0.08 per KWH. So gasoline at $3.00 per gallon is eight times more expensive than coal.
Is oil and gasoline significantly more efficient than coal? Let’s compare on a pound for pound basis. A pound of coal equates to about 10,500 BTUs or approximately 3.1 KWH per pound. A gallon of gasoline producing 125,000 BTUs weighs about 6 pounds equating to 6.1 KWH per pound (125,000 /3,413 /6). While gasoline is almost twice as efficient as coal, coal’s lower cost per KWH is why it is still used today to generate electric.
The Bottom Line: the economics of energy determines its use – coal still accounts for approximately half of our electric generation because it has a lower cost than other fuels. However, there are two factors to consider 1) the cost of carbon is not calculated into the full price of coal or other hydrocarbon fuels and 2) the cost of conventional fuel is calculated on a marginal basis while alternative fuel costs are calculated on a fixed cost basis. Meaning the cost of roads, trucks, and mining equipment is not factored into the price of each piece of coal, only the marginal cost of producing each ton of coal. For solar, hydrogen fuel cells, and wind energy systems, the cost to construct the system is factored into the total cost while the marginal cost of producing electric is virtually free. We need a framework to better measure the economics of alternative energy. The impact of carbon on our climate and global warming are clearly not measured in the costs of hydrocarbon fuels nor is the cost of protecting our access to oil such the cost the Iraq War.
Despite the carbon issues surrounding coal, (coal has higher carbon-to-hydrogen ratio in comparison to oil or gas) coal is more abundant and therefore is cheaper than oil. As electric utilities in 24 states embrace alternative energies through such programs as Renewable Portfolio Standards (RPS), perhaps the benefits of alternative energies will begin to combat the negative economics of hydrocarbon fuels.
Ethanol offers short-term solutions, but corn-based ethanol is not the answer
Ethanol may emit less CO2 and help reduce the demand for foreign oil in the short term, but ethanol and in particular, corn-based ethanol raises food prices, is less efficient than gasoline, diesel, and biodiesel, and is not a substitute for oil.
According to research compiled by National Geographic Magazine , the energy balance of corn ethanol, (the amount hydrocarbon fuel required to produce a unit of ethanol) is 1-to-1.3 whereas for sugar cane ethanol the ratio is 1-to-8. This suggests corn-based ethanol requires significantly more energy to produce than sugar cane ethanol. Corn ethanol is only marginally positive.
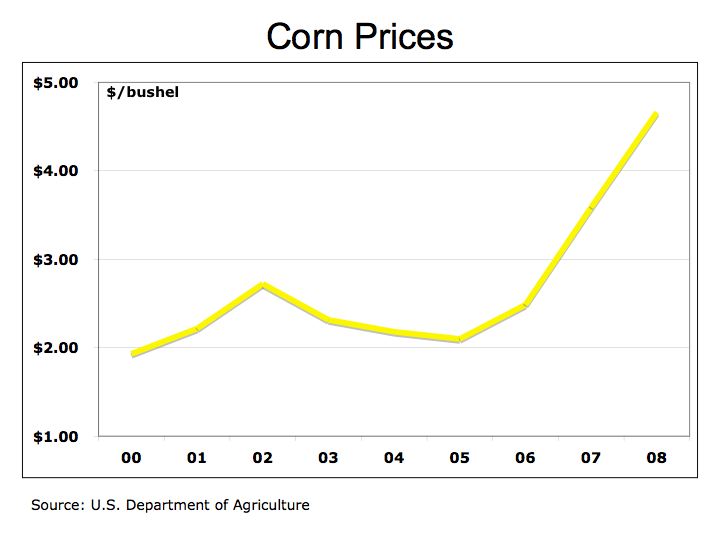
A major issue with corn ethanol is its impact on corn prices and subsequently, food prices in general. It is the price of oil that is impacting the price of corn because nearly all ethanol produced in the U.S. is derived from corn. Therefore, corn prices are inextricably linked to oil prices as well as to the supply and demand of corn as food and feedstock. Corn Prices while volatile and impacted from weather and other variables appear to follow the rising price of oil as illustrated in Figure 1. In turn, corn prices are also influencing other commodity prices where corn is used for feed for livestock.
The rising motor vehicle usage in China and India is escalating the already tenuous situation in the oil markets. With ethanol tied to oil prices we are beginning to see corn prices exacerbate the inflationary pressures at the retail level. Over the last year consumers are paying more for food with large increases in the prices of eggs, cereal poultry, pork, and beef which are tied to corn.
Figure 1 Corn Prices
Senate legislation for Renewable Fuels Standard calls for ethanol production to increase to 36 billion gallons by 2022 with 21 billion derived from as cellulosic material such as plant fiber and switchgrass . Corn is expected to comprise 42% of the ethanol production in 2002 from virtually all today. The fact is that ethanol production at its current level of 6 billion gallons equates to only 4% of our gasoline usage and is already impacting food prices. Gasoline consumption in 2005 amounted to 3.3 billion barrels or 140 billion gallons. Current estimates put gasoline consumption at 144 billion gallons a year in 2007. Even if vehicles could run entirely on ethanol, there is not enough corn harvest to substitute our demand for oil. We need a cohesive and coordinated effort using multiple technologies to develop alternative energies to reduce our dependence on foreign oil.
Performance
According to Renewable Fuels Association ETHANOL FACTS:
ENGINE PERFORMANCE, ethanol offers higher engine performance with octane rating of 113 in comparison to 87 for gasoline and has a long history in the racing circuit. In 2007, the Indy Racing League, sponsors of the Indianapolis 500 started using ethanol in racecars. However, the higher engine performance may come at a cost of lower fuel efficiency.
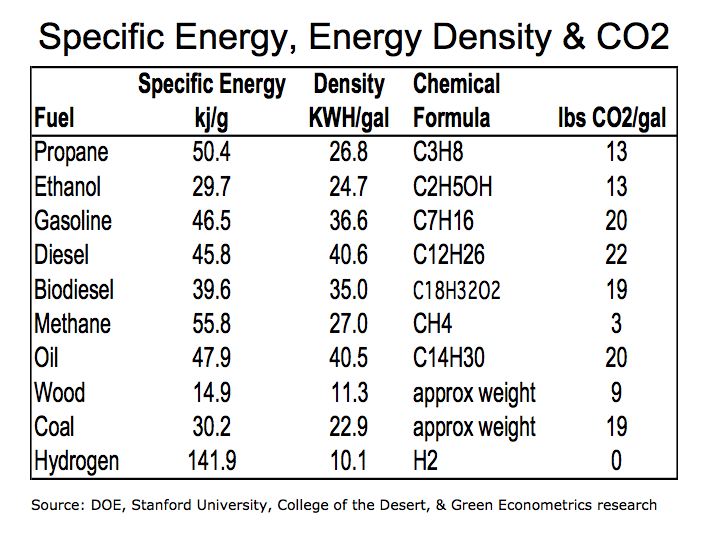
Table 1 Specific Energy, Energy Density & CO2
Efficiency
Gasoline offers 56% higher energy efficiency (specific energy) over ethanol as measured by kilo-joules per gram (kj/g). (As a reference: 1 kilowatt-hour = 3,600 kilojoules = 3,412 British Thermal Units) Biodiesel with 35 kj/g is 33% more energy efficient than ethanol at 24.7 kj/g.
In terms of energy density, ethanol would require larger storage capacity to meet the same energy output of gasoline diesel, and biodiesel. Ethanol requires a storage tank 48% larger than gasoline and 41% larger than diesel for the same energy output.
Please see Hydrogen Properties and Energy Units
For a quick review of Specific Energy and Energy Density – (Molecular Weight Calculator) the specific energy of a fuel relates the inherent energy of the fuel relative to its weight and is measured in kilo-joules per gram.
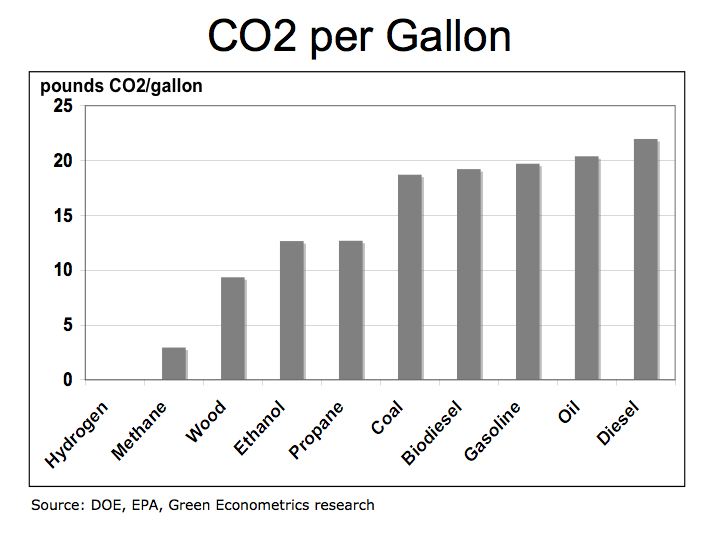
CO2 Emission
The molecular weight of CO2 is approximately 44 with two oxygen molecules with an approximately weight of 32 and one carbon atom with a weight of 12. During the combustion process, oxygen is taken from the atmosphere producing more CO2 then the actual weight of the fuel. In the combustion process a gallon of gasoline weighing a little over six pounds produces 22 pounds of CO2.
CO2 emission is a function of the carbon concentration in the fuel and the combustion process. During combustion ethanol produces approximately 13 pounds of CO2 per gallon. Gasoline and diesel produce approximately 22 and 20 pounds per gallon, respectively. CO2 emissions per gallon appear quite favorable for ethanol. However, the results are less dramatic when CO2 emissions are compared per unit of energy produced.
Figure 2 CO2 per KWH
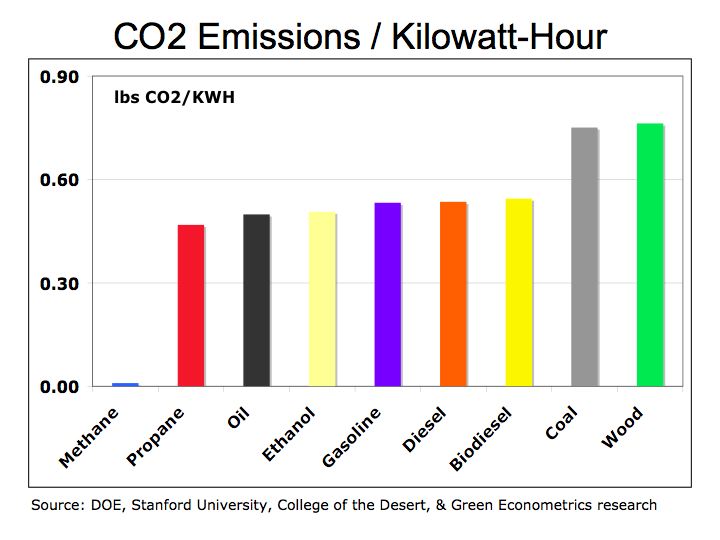
When measured in pounds of CO2 per kilowatt-hours (KWH) of energy, the results show ethanol producing 6% less CO2 than diesel or biodiesel and 5% less than gasoline. In the case of ethanol, the lower specific energy of the fuel negates the benefit of its lower CO2 emissions. Meaning more ethanol is consumed to travel the same distance as gasoline or diesel thereby limiting the benefit of its lower CO2 emissions.
The bottom line is ethanol does not ameliorate our dependence on foreign oil and while it demonstrates higher performance for racecars, it is still less efficient than gasoline diesel, and biodiesel, and diverts food production away from providing for people and livestock. The reality is there are special interest groups that obfuscate the facts about ethanol for their own benefit. The real solution to our imminent energy crisis is alternative energies including cellulosic ethanol, solar, hydrogen fuel cells, and wind.
Energy Shocks: Peak Oil Question
Peak oil has been a discussion for several decades after the theory developed by Dr. M. King Hubbert was put forth to alert the world of the impending decline in oil production. Recent data from the Energy Information Administration (EIA) oil production from the twelve members of OPEC has declined from its peak in 2005, despite increased global drilling activity.
Figure 1 OPEC Oil Production
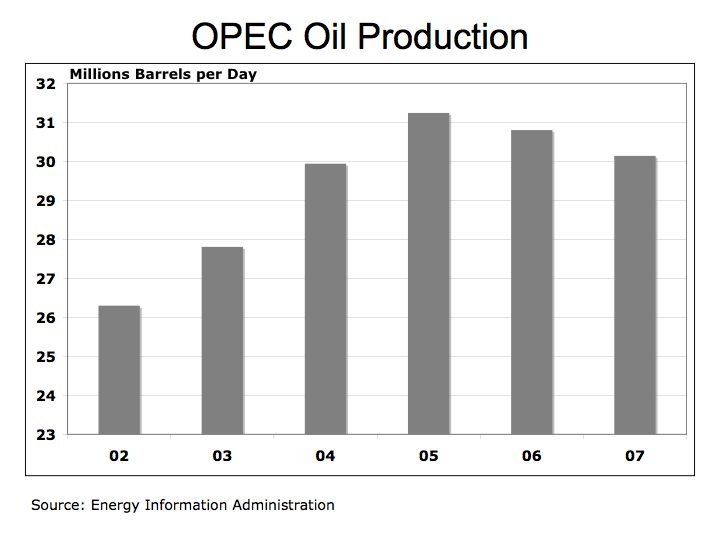
Higher oil prices is driven demand for energy exploration and drilling is up significantly in the U.S. and the world according to Baker Hughes Worldwide Rig Count. Oil price continue to remain above $90/barrel and despite the increased oil drilling activity, oil production remains relatively flat.
Figure 1 demonstrates the tenuous nature of OPEC oil production with oil production declining almost 4% from the peak average production of 31.2 million barrels per day. One must remember that oil production is variable with up and down trends over time. However, with oil over $900 a barrel we are not seeing significant production increase despite the rise in oil drilling. Figure 2 illustrates world-drilling rigs in comparison to oil prices on a global basis. The U.S. accounts for over half the world oil drilling rigs yet our production is less than 10% of total global production.
Figure 2 Rig Count and Oil Production
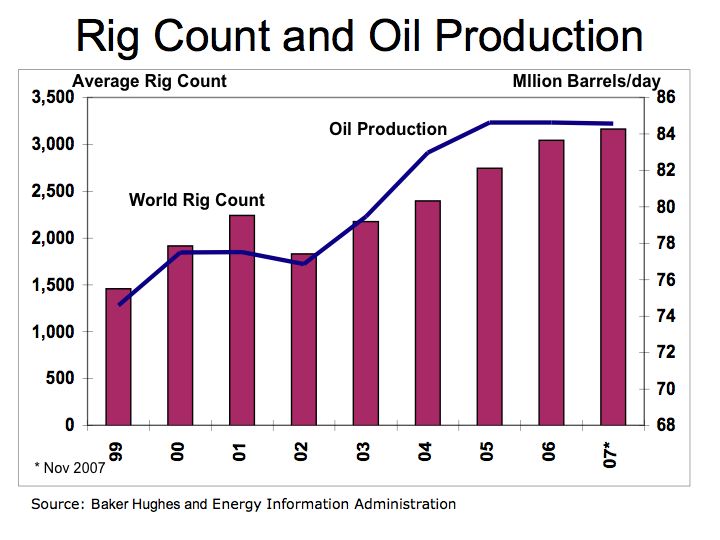
What does all this mean? For one peak oil may be a reality or sooner then we like. Secondly, with concern over climate change and global warming, there is no real spending on alternative energy to help mitigate a potential shortage in oil. More spending on solar and hydrogen fuel cells is required to ameliorate the eminent disruption in oil flow. Without an orchestrated government mandate to develop alternative energies all nations face a national security issue that has the potential to cripple economic activity.
Solar and Hydrogen Energy – where vehicle fuel efficiency is headed
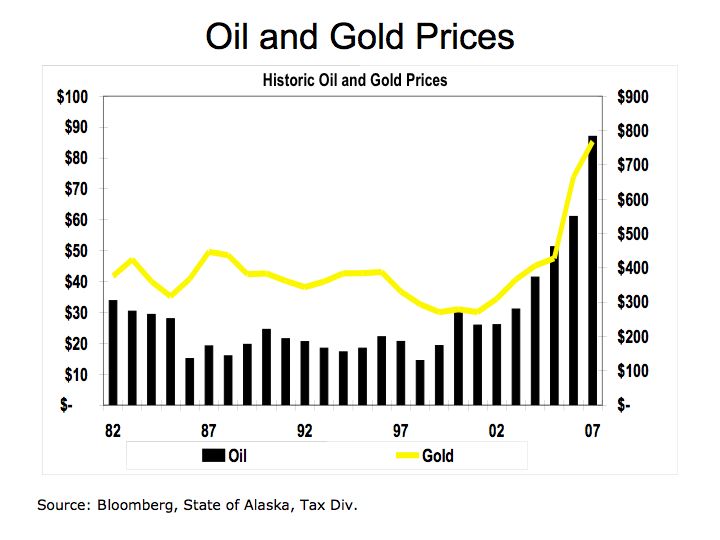
Despite efforts that have enabled the U.S. to limit its demand for oil, world oil demand is up significantly. Advances in technology such as solar energy and vehicle fuel cell could help the world reduce its dependence on oil.
Figure 1 Oil and Gold Prices
The U.S. Department of Energy (DOE) and the U.S. Environmental Protection Agency (EPA) today released the Fuel Economy Guide for 2008 model year vehicles Fuel Economy Leaders: 2008 Model Year Coming in first place is the Toyota Prius (hybrid-electric) with city/highway miles per gallon (MPG) of 48/45. With higher fuel costs more people are factoring in fuel efficiency into their purchase decision. However, it is the purchase of pickup trucks and SUV that account for most of the vehicle purchases in the U.S. and these vehicles are dramatically less fuel-efficient than hybrids and small four-cylinder automobiles.
Despite the trend towards larger vehicles, the U.S is not experiencing a rapid rise in oil demand. Yet oil prices continue to climb. While geopolitical risk may account for the bulk of the recent price increase, latest information from the U.S. Energy Information Administration (EIA) Total Petroleum Consumption shows increasing oil demand from China.
Figure 2 Oil Demand: U.S. and China
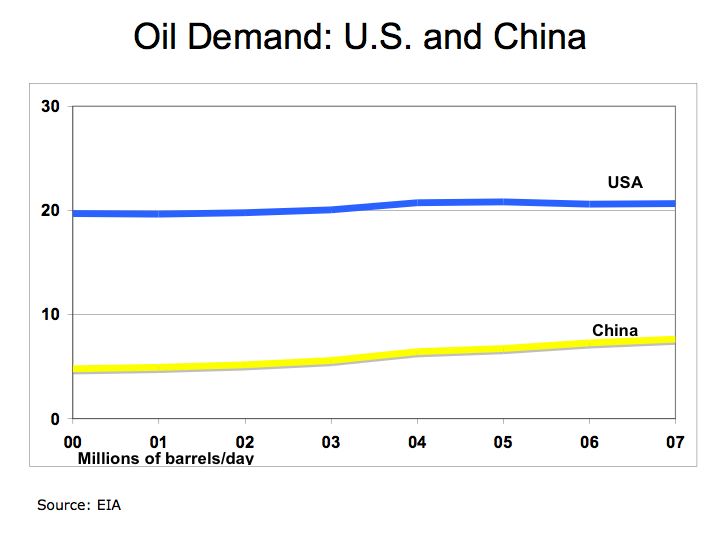
Figure 2 illustrates that while oil demand in the U.S. has grown only modestly since 2000, the growth in China’s oil demand is rising rapidly. The recent data from the EIA shows oil demand through Q2/07. The demand for oil in the U.S. is up 5% from 2000 while in China oil demand is up 59% over the same period.
Improving vehicle fuel efficiency may abate rapidly rising oil demand in the U.S., but more emphasis on diesel and hybrids could take us a lot further. For example, Toyota has been slow to introduce its diesel line of pickup trucks in the U.S. while it offers a broad line of more fuel-efficient vehicle outside the U.S. Toyota offers several cars and trucks in Europe with impressively high fuel efficiencies that are not available in the U.S. Infact, the Toyota Hilux two-wheel drive pickup truck offers a four-cylinder diesel engine with an MPG of 44.8 on the highway and 29.1 in the city.
We are also seeing progress on fuel cell vehicles that could ultimately ameliorate are demand for oil, if not eliminate it entirely, all with no carbon dioxide or other emissions. We see most major automakers developing hydrogen powered fuel cell vehicles. Honda for one has the right concept in employing solar energy to make hydrogen.
Honda’s experimental hydrogen refueling station in Torrance, CA increases the solar incre3ases the efficiency of hydrogen fuel by using solar energy to produce hydrogen. The hydrogen is then used to power Honda’s Honda’s FCX concept hydrogen fuel cell vehicle with the only emission being pure water vapor. These fuel cell vehicles may not be ready for prime time, they provide a clear reality to what is achievable.
The bottom line is that supply and demand dictate price and the availability of cheap oil is on the decline. Further research into solar and hydrogen fuel cells could significantly change our dependence on oil.
With choices like Biodiesel and Ethanol, what’s the best fuel for your vehicle?
With the rapid growth in vehicle use around the world, it would be nice to know what are the most efficiency, economic, and least carbon emitting fuels. The number of motor vehicles on the road is increasing rapidly. The number of cars and trucks in China is up over 3,600 percent in the last thirty years. Data from the U.S. Department of Energy (DOE) and Ward’s Communications, Ward’s World Motor Vehicle Data provide an interesting view of the growth in motor vehicle use.
Figure 1 China Truck and Car Registration
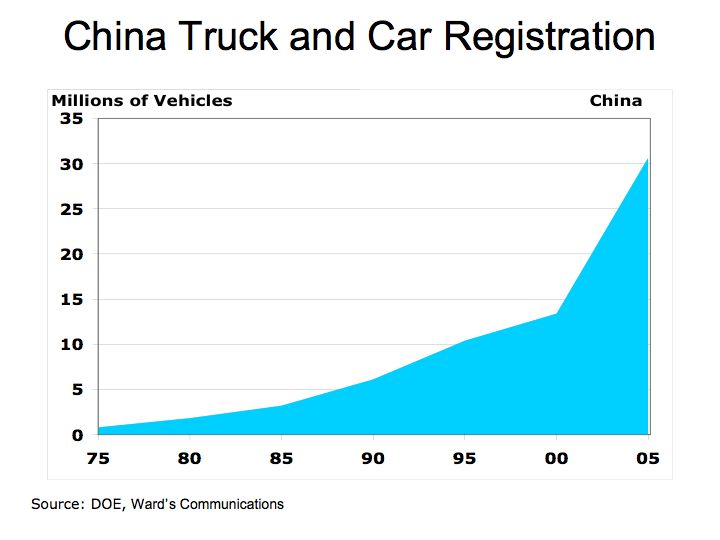
While the U.S. still accounts for the largest motor vehicle market, the rest of the world is quickly accelerating towards more vehicles on the road. Figure 2 shows the number of vehicle registrations over the last thirty years for China, the U.S. and the rest of the world (ROW). Vehicle registration growth in the U.S. has been growing at a 2% per year rate from 1975 to 2005. The largest growth in vehicle registration is in China and India where growth in the last ten years is up 195% and 99%, respectively.
Figure 2 World Vehicle Registration

With an explosion in motor vehicle use, what fuel should we be using to better performance and reduce emissions? Let’s go back to two basic concepts of energy: Specific Energy and Energy Density. For a quick review, (Molecular Weight Calculator) the specific energy of a fuel relates the inherent energy of the fuel relative to its weight. Specific energy is often measured in kilo-joules per gram (kj/g). One kilo-joule equals one kilowatt-second meaning one kilowatt-hour (KWH) equals to 3,600 kilo-joules. Also one British Thermal Unit (BTU) equals 1,055.05585 joules. A reference to the specific energy and energy values of most fuels can be found at Hydrogen Properties
Figure 3 Specific Energy
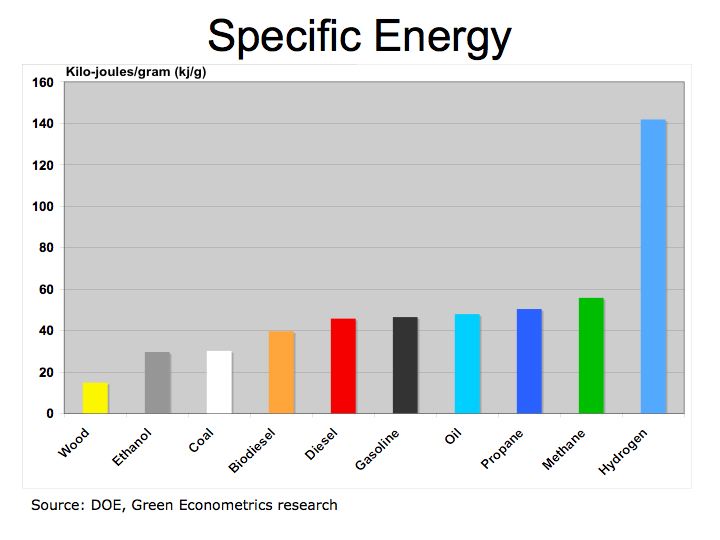
By specific energy hydrogen is the clear leader. However, vehicles must inherently carry their fuel supply, so to determine which fuel is best for motor vehicles, energy density of the fuel is the next measurement. While vehicle fuel efficiency is dependent upon a number of factors such as engine type and performance, make and model of vehicle, road conditions and fuel, we are focusing on fuel energy.
Figure 4 Energy Density: KWH per Gallon
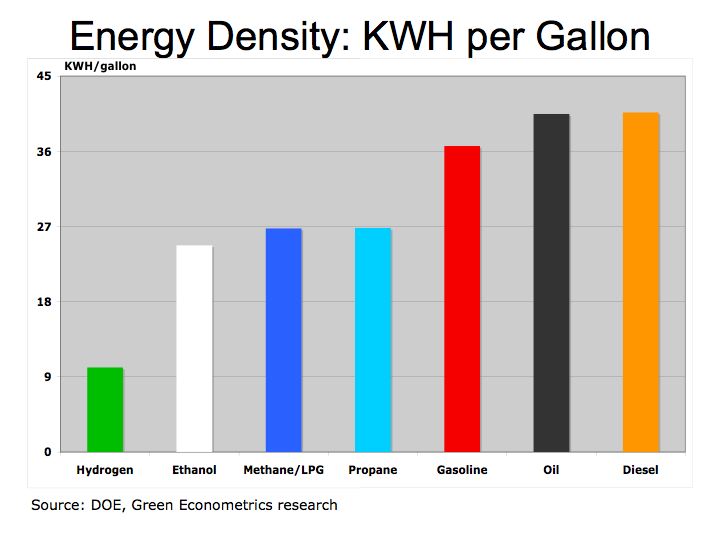
Figure 4 illustrates how fuels compare with respect to energy density, that is, energy relative the container size. We again are using KWH to measure energy value. Hydrogen, because it is so light, requires 15.9 times the container volume to provide the same energy as diesel. Biodiesel provides more power per gallon than Ethanol, which requires 1.6x, the container size for the same amount of energy as diesel. Biodiesel and diesel are relatively similar with respect to energy density. While both Ethanol and Biodiesel are both form of renewable energy, Biodiesel offers more bang per gallon. Before we are able invest more into hydrogen and solar energy to bring alternative energy into parity with conventional hydrocarbon fuels, diesel and biodiesel offer better energy efficiency among hydrocarbon fuels.
Table 1 Specific Energy, Energy Density & CO2
As a final assessment of hydrocarbon fuels, let’s compare carbon dioxide (CO2) emissions among our list of fuels. CO2 emission is a function of carbon concentration and combustion process of the fuel. Fuel energy research at the Department of Environmental Protection (EPA) and DOE indicate 99% to nearly 100% combustion of with fuels used in vehicles. That means almost all of the atoms in the fuel are converted to either heat or byproducts such as CO2.
Figure 5 illustrates how much CO2 is produced per gallon of fuel. Remember the molecular weight of CO2 is about 44 with oxygen contributor nearly 73% of the weight and is taken from our atmosphere during combustion. This is why more CO2 is created than the actual weight of the fuel. A second factor needs to be considered when evaluating CO2 emission and that is how much CO2 is produced per energy value. In comparing CO2 emissions per KWH of energy, Ethanol produces about 7% less CO2 than diesel or Biodiesel and 5% less than gasoline. Neither of these estimates considers the emissions from the processing to produce Ethanol or Bioiesel.
Figure 5 CO2 per Gallon
The bottom line is Ethanol and Biodiesel provide marginal relief to our energy crisis with biodiesel offering better efficiency and Ethanol marginally less CO2 missions. The only real solution to our imminent energy crisis is alternative energies such as solar, hydrogen fuel cells, and wind.
Can Canadian Tar Sands rescue our appetite for Oil?
Oil prices remain at historically high levels and threaten our economy with higher home heating and transportation costs. With a lot of rhetoric over Peak Oil as well as claims that Tar Sands offer a viable substitute for oil, let’s examine a couple of facts to determine the feasibility and sustainability of supplementing our current demand for oil with tar sands.
According to Bureau of Land Management’s on line resource for Oil Shale and Tar Sands, tar sands are a mixture of clay, sand, water, and bitumen, which is liquid hydrocarbon oil like substance. Tar sands consist of about 10%-to-15% liquid hydrocarbon and an 80%-to-85% mixture of mineral water, clay, and sand, and 4%-to-6% water. It takes about two tons of tar sands, which are extracted, mainly through strip mining, and processed to produce one barrel of oil.
According to Alberta Energy, sand oil production was at 966,000 barrels per day (bbl/d) in 2005 and is expected to reach 3 million bbl/d by 2020 and possibly even 5 million bbl/d by 2030. Alberta’s sand oil reserves at 1,704 million barrels, but proven and extractable using current technology, the estimate is 175 billion barrels which is second to Saudi Arabia’s 260 billion according to CBS 60 Minutes
However, with productions level of Alberta’s sand oil at 3 or even 5 million barrels per day, it represents just 4%-to-6% of the world’s oil needs. The U.S. consumed an average of approximately 20.5 million bbl/d in 2006 as indicated by the Energy Information Administration.
If it takes two tons of tar sand to produce one barrel of oil, the ability to increase production to 3 million barrels per day would amount to mining of 2.1 billion tons of tar sand. Total coal mining in the U.S. for 2006 was 1.1 billion tons according to EIA Coal Data At 5 million barrels per day, equivalent to about 6% of the world oil production in 2006, would amount to 3.6 billion tons of tar sand. That would be significantly larger than the 1.3 billion tons total world production of Iron ore in 2005 Info Comm. That appears to be a lot of mining for a 6% increase of oil on the world market. The added tar sand oil would make a significant contribution to U.S. oil needs.
According to the Canadian Association of Petroleum Producers capital investment in Alberta’s oil sands amounted to $10.4 billion in 2005. That’s not a bad investment considering that even with production levels of 1 million barrels a day, revenue potential could be $29 billion a year with oil over $80 per barrel.
Figure 1 U.S. Oil Supply and Demand
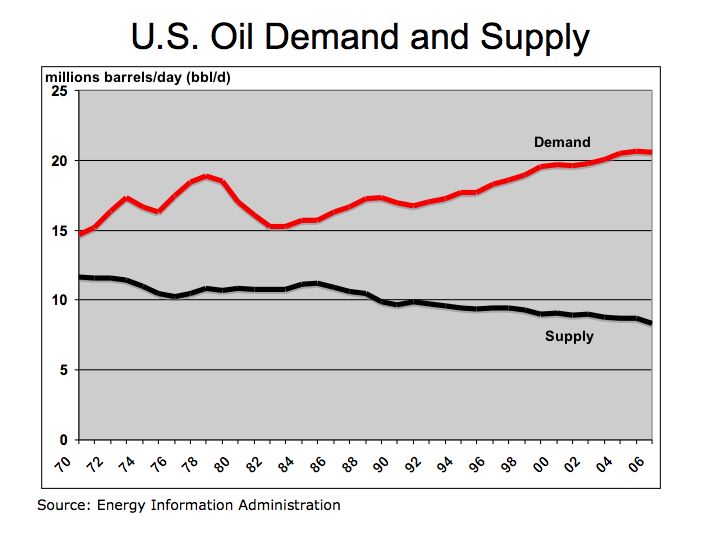
Given the that tar sands only provide a fraction of our energy requirements and is burdened by carbon emission even during extraction, a commitment to solar energy fuel cells may offer a better return on investment. The bottom line is oil derived from tar sand is only a supplement to our energy demands, it’s non-renewable, adds to carbon emissions, requires extensive processing, and must be mined.
Research at Caltech may provide clues to improving solar cell efficiency
With rising energy prices and growing concern over global warming, will advances in solar and alternative energies enable the development of affordable and efficient energy solutions. Caltech research on the energy conversion process may offer some insight.
Energy conversion, ways of converting sunlight to electric and chemical energy, offers promising advancements to make solar and hydrogen energies more practical and affordable. On the forefront of energy conversion research, the framework of developing disruptive energy technologies, is The Lewis Group, that is part of the California Institute of Technology’s division of Chemical and Chemical Engineering. The Lewis Group is working in several research areas some geared towards to better understanding of energy capture, conversion of light into electrical and chemical energy, and energy storage. These research projects include photo-electrochemical, which focuses on the chemistry of semiconductors and materials, surface modification of semiconductors to improve electrical properties, and nanocrystalline titanium dioxide that could potentially lead to significantly lower cost for converting sunlight to electrical energy. The Lewis Group research projects are much more than improving photovoltaic devices; they are also exploring ways to convert sunlight into stored fuel energy.
While we are providing a brief and very oversimplified view of the solar energy research, it is important to understand the dynamics of energy conversion because the conversion process impacts the efficiency and the production cost of photovoltaic (PV) devices and fuels cells. The Lewis Group has an interesting PowerPoint presentation available for download providing an overview of energy from consequences of CO2 emissions to the latest in new technologies to improve alternative energies. Of particular interest are the historical efficiency trends for various materials used in crystalline and thin-film solar cells, energy conversion strategies of turning light to fuel and electric, and the cost/efficiency tradeoff in photovoltaic devices.
Cost/Efficiency Tradeoff
Photovoltaic devices are limited in their practical efficiencies governed by the thermodynamic limits and production costs that involve tradeoffs in materials, production processes, and PV device packaging. The Lewis Group provides a thorough illustration of the efficiency trends for various PV devices materials such as crystalline silicon used in semiconductors as well as the new approaches to thin film PV including amorphous silicon, cadmium telluride (CdTe), copper indium deselenide (CIS) and copper indium gallium deselenide materials (CIGS). These thin film material could offer substantial PV devices price reductions as a result of higher efficiency or lower production costs.
Figure 1 Cost/Efficiency Tradeoff
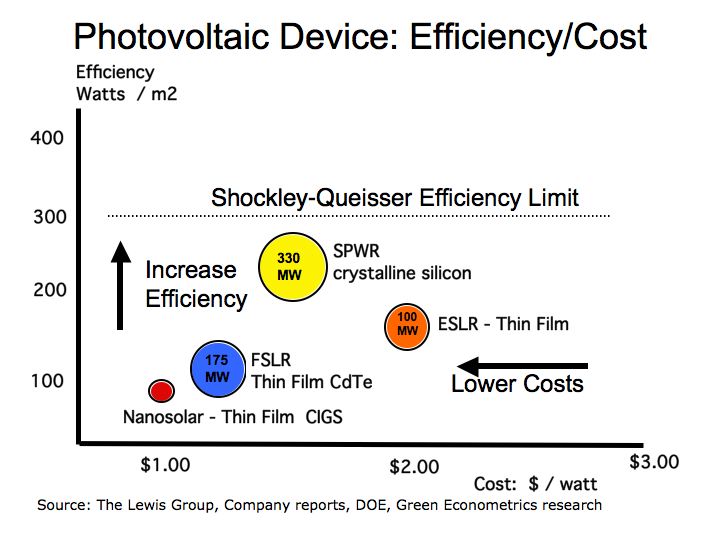
There is a tradeoff between improving the efficiency of a PV device, that is the amount of electric energy per solar panel, and the cost to produce the PV device. The average efficiency for a PV device is between 15%-to-16% and the average cost between $100-to-$350 a square meter. The cost per square meter and PV efficiency measured in watts per square meter can equate to a cost per watt, which ranges from $1.25/watt to $2.00/watt. SunPower (SPWR), offers the leading PV single junction device efficiency of 22% employing crystalline silicon and is expected to reach 500 megawatts (MW) production capacity by late 2009 from 330 MW in 2007. First Solar (FSLR) is ramping its thin film cadmium telluride (CdTe) solar technology by leveraging its low cost advantage with high volume production with its 75 MW in operations Ohio and 100 MW coming online in Germany. Startup Nanosolar is focusing on thin film solar PVs with a blend of copper indium gallium deselenide (CIGS) materials along with a manufacturing process much like printing, by placing the material blend upon metal foil. Evergreen Solar (ESLR) employs an integrated manufacturing process from wafers to cells and panels based on its proprietary String Ribbon Wafer technology with production levels at 118 MW in 2007.
There is presently a practical limit to solar efficiencies of approximately 30% and a thermodynamic limit of about 83%. The Shockley-Queisser limit at 30% for single junction solar cell efficiency is a function photon absorption in a material. “Detailed Balance Limit of Efficiency of p-n Junction Solar Cells” (W Shockley and HJ Queisser, Journal of Applied Physics, 1961) found that photons delivering excitation energy above a threshold (the band gap) for charge carrier electrons is lost to heating, meaning excess photon energy generates heat and not electric current. Photons with energy levels below the band gap pass through the material and photons above the threshold are absorbed. The absorbed photons transfer their energy to excite the electrons in the material and create pairs of negative electrons and positive charges that, because of their repulsion, travel to opposite ends thereby generating electric current.
According to the Lewis Group, other factors that limit PV cell efficiency include reflective loss of approximately10% for a material like silicon and a fill factor constraint that peaks at 83%. The fill factor restraint is attributable to the current-voltage characteristics of a PV cell that deals with matching the photocurrent density and voltage.
NREL (DOE lab) and Spectrolab (a Boeing company BA) using a multijunction semiconductor approach along with solar concentrators have achieved solar cell efficiencies of 40.7% in lab experiments while commercial products operate at 26.5%-to-28.3% efficiency range. Solar cell suppliers could reduce costs through production improvements or improve PV efficiencies without adding to costs. PV cell suppliers should benefit from economies of scale to reduce production costs while advances in technology improve PV efficiencies.
Research conducted by the Lewis Group at Caltech indicates that materials selected for PV devices have unique properties in their ability to absorb sunlight and generate electricity. In their analysis of semiconductor materials, the Lewis Group research found two parameters, determined by the physical properties of the material, that influence the PV’s efficiency. One is the thickness of the material, measured in microns, required to absorb enough sunlight to bring particular atoms in the material to an excited state, thereby freeing the electron to generate an electric current. The second parameter in the PV material is length of time the excited electrons last before recombining to generate heat instead of electric. Some materials such as silicon require material thickness of 100 microns while gallium arsenide (GaAs) only 1-to-3 microns.
Energy Conversion
Conversion of energy into electric or fuel is advancing through research in photoelectrochemical materials for solid and liquid fuels. Improvements in efficiencies for PV devices and fuel cells offer tremendous potential for transportation and home electric use.
Figure 2 Efficiency of Photovoltaic Devices
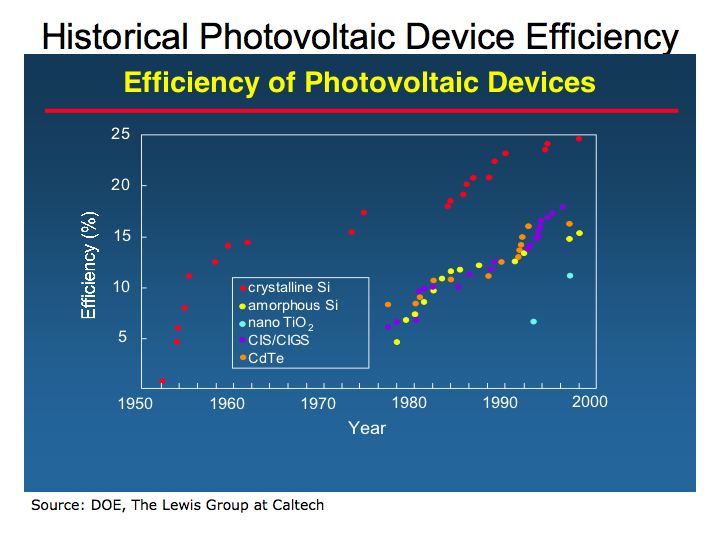
From figure 2, it seams quite apparent that PV efficiency has improved substantially since the 1950’s. Please see the Department of Energy (DOE) Basic Research Needs for Solar Energy Utilization for detailed analysis of solar energy. Further progress in PV and fuel cell technologies is predicated upon successful funding of further research. The bottom line is that only through innovative research will a truly disruptive technology be developed that has the ability of changing the economics to deliver an energy solutions to all nations.