Perspective on Global Oil Consumption – Possible Plateau for Oil Consumption?

Global oil demand grew 0.6% in 2012 and over the last ten years oil consumption grew at a compounded annual growth rate (CAGR) of 1.3%. With near term oil demand at a lower level then the trend for the past ten years suggests the pace in oil consumption is slowing.

According to the Energy Information Administration (EIA), EIA the trend in oil consumption is pointing towards slower if not anemic growth. In the two largest areas, the US and Europe, demand is for oil is declining. While the increasing demand for oil in China and India is significant, the rate of growth is slower.

Figure 1 Global Oil Demand Oil

In the US, oil demand declined 2.1% in 2012 and over the last ten years oil consumption is down 0.6%. The oil consumption trend in the US suggests the decline maybe more structural, particularly as vehicle fuel efficiency is improving and high oil prices may change consumer-driving habits.

Figure 2 Oil Consumption – Major Countries Oil Demand

While the economic weakness in Europe and moderating growth in China, it is not surprising to see weakness in global oil demand. The trend is lower oil consumption might just be the result of short term economic weakness.

Europe and the US account for over 37% of the global demand for oil and that demand has declined over the last ten years. While the US was down 0.6%, demand for oil in Europe was down 1.1% in the last ten years.

Figure 3 Oil Consumption Perspective Global Oil Demand

There is still strong demand for oil in China and India, but the rate of growth has slowed. China and India represent 15% of the global demand for oil. China and India have one-year oil demand growth rates below their respective ten-year rates.

Figure 4 Oil Consumption Trends Global Oil Demand

The bottom line is that is demand for oil has slowed and it maybe at a point where oil prices may soon reflect slowing demand.

Should we be Concerned over Elevated CO2 levels?

With the oppressive heat and appalling humidity along the Eastern Seaboard, one considers the possibility of climate change and the impact of that greenhouse gases may have on our environment. Without developing statistical regression models to gleam any semblance of understating of carbon dioxide’s impact on climate change, let’s just look at some charts that illustrate the changes of CO2 levels though history.

While industry experts and scientist debate whether elevated CO2 levels have an impact on climate change, the scientific data taken from ice core samples strongly suggests CO2 levels have remained in a range of 180-to-299 parts per million (PPM) for the last four-hounded thousand years. Scientists have developed models to suggest that rising CO2 levels contributes to global warning which are subsequently followed by dramatic climate changes that lead to periods of rapid cooling – the ice ages.

Scientific theories suggest that rising global temperatures melts the Polar ice which allows substantial amounts of fresh water to enter the oceans. The fresh water disrupts the ocean currents that are responsible for establishing a nation’s climate. As oceans warm near the equator, the warmer water travels towards each of the Polar areas. The cooler water near the Polar areas sinks and travels towards the equator. These ocean currents allows for stable climates. The issue is that fresh water is less dense because it is not salty like seawater. Therefore, the fresh water does not sink like the cold salinated seawater thereby disrupting the normal flow of the ocean currents.

Figure 1 CO2 Ice Core Data – illustrates the level of CO2 over the last four-hounded thousand years. The Vostok Ice Core CO2 data was compiled by Laboratoire de Glaciologie et de Geophysique de l’Environnement.
Ice Core Data

Figure 1 CO2 Levels – Vostok Ice Core CO2 Ice Core
Source: Laboratoire de Glaciologie et de Geophysique de l’Environnement

If this Ice Core CO2 data is correct, then the current data on atmospheric CO2 levels is quite profound. CO2 data is complied by the National Oceanic and Atmospheric Administration NOAA at the Mauna Loa Observatory in Hawaii. The latest trend indicates CO2 levels for June 2010 are at a mean of 392 ppm versus 339 in June 1980 and 317 in 1960. Clearly these CO2 levels are elevated. The question is what is the impact on our environment.

Aside from the catastrophe in the Gulf of Mexico and the dire need to find an alternative to our dependence on oil, should we not accelerate our efforts to find an alternative energy solution and as a way to mitigate the impact of CO2 on our environment? Maybe investment into alternative energy could help solve multiple problems.

Figure 2 Mauna Loa CO2 Readings  Mauna Loa
Source: Source data published by the National Oceanic and Atmospheric Administration (NOAA)

The bottom line is that we need to consider the possibility that elevated CO2 levels in our atmosphere could potentially have a detrimental impact on our climate. In any event, limiting our dependence on fossil fuels, the main contributor to CO2, should be paramount. Let us not forget oil is supply-constrained – there are no readily available substitutes aside from electric vehicles, and without a strategy to embrace renewable energy, supply disruptions will have a painful impact on our economy, national security, and environment.

Global Oil: Economic Recovery should Drive Demand and Price

Despite the global economic recession, preliminary data suggest oil demand remains rather resilient. According to the latest reported information from the Energy Information Administration (EIA), Global Petroleum Consumption is down one percent y/y in 2008 while China and India show increases of 4% and 5%, respectively. However, current data through September 2009, show oil demand fell quite precipitously in the US. Through September 2009, oil consumption is down over two million barrels per day form the 2007 annual average (an 11% decline). Most of the change in oil consumption is cyclical and with an economic recovery expected, oil demand should rebound and perhaps drive prices higher.

Figure 1 US Average Annual Oil Consumption US Oil Demand

Historically, the US has seen this type of demand erosion before. From 1979 to 1983, oil demand in the US declined 28% with annualized rate of a 10% decline per year. Over this same period, oil prices actual rose despite the fall in demand. Oil prices by barrel (42 US gallons) rose from $3.60 in 1972 to $25.10 in 1979. Oil prices are up significantly in 2009. In January 2009, oil was traded at $33.07 a barrel and in January 2010, oil is trading at 2010 Oil prices $78.00 per barrel.

On a global basis, oil demand has only contracted by one percent in 2008, the latest data from the IEA. Despite the fall out in US oil demand, global markets driven from demand from China and India, has kept the global demand for oil relatively stable.

Figure 2 Global Oil Demand Oil

The growing demand for oil from China and India increased their respective share of the global oil markets from 3% and 1%, respectively in 1980 to over 9% and 3% in 2008. At the same time, the US share of global oil consumption has declined from 27% in 1980 to under 23% in 2008. See Figure 3 China and India Oil Demand.

Figure 3 China and India Oil Demand Global Oil Demand

The bottom line is that as financial growth emerges across the globe, oil demand should increase commensurately and with oil process already at elevated levels, further prices increases are expected. – demand for oil will increase and so will oil prices.

Falling Panel Prices could bring Solar closer to Grid Parity

Rising inventory levels of photovoltaic (PV) panels and new production capacity coming online is driving solar PV prices lower and thereby, bringing solar energy closer to grid price parity. With the release of the latest earnings of solar energy companies, Wall Street’s keen attention to revenue guidance, inventory levels and pricing are paramount in diagnosing the health of the solar energy industry. Expectations call consolidation of the solar industry with some key players gaining market share and for others it becomes more challenging. However, despite the turbulence in the industry, consumers will benefit in the near-term as solar PV prices fall and government incentive fuel growth in solar PV deployment.

To get a better perspective on the solar PV industry, let’s examine inventory levels for some of the leading solar PV suppliers. The following chart, Figure 1, compares inventory levels in relationship to sales volume. While inventory levels have increased, the level of inventories to sales is not egregious

Figure 1 Sales and Inventory levels install

While it is important to control inventory levels in relationship to sales, revenue growth is predicated upon price, performance, and return on investment for prospective customers. Thin-film PV has emerged as the low-cost solar solution even with its lower efficiency levels in comparison to mono-and poly-crystalline PV panels. Thin-film still offers a lower cost/watt than crystalline PV, see Solar Shootout in the San Joaquin Valley , but prices for crystalline PV are falling as a result of rising production capacity and inventory levels.

Figure 2 Market Value Market Value

In Figure 2 Green Econometrics is comparing the market value of some of the leading PV suppliers as measured by their respective stock prices. In the valuation of solar PV suppliers, the stock market appears to be betting heavily on thin-film PV, as First Solar (FSLR), the leading thin-film PV supplier, enjoys a market value that accounts for over half the value of the entire solar industry. FSLR is positioned as the low-cost supplier in the solar industry with its announcement of $1 per Watt reducing its production cost for solar modules to 98 cents per watt, thereby braking the $1 per watt price barrier. However, new panel suppliers, mainly from China are pushing prices lower for poly-and mono-crystalline panels suppliers. ReneSolar (SOL) is seeing average selling prices for wafers at $0.93 per watt and bring PV panels prices to under $2.00 per watt.

There appears to be a lot riding on the success of thin-film PV and as prices fall for crystalline PV, the closer we get to grid parity. In the following chart, Figure 3, price for crystalline PV have declined quite dramatically in the last 30 years. According to the Energy Information Administration, in 1956 solar PV panels were $300 per watt, and in 1980, the average cost per solar modules was $27/watt and has fallen precipitously to approximately $2/watt in October 2009. As the installed cost of solar PV falls closer to $4/watt, pricing per kilowatt-hour (KWH) (depending on your climate and geography), equates to approximately $0.16/KWH that would be inline with utility rates after rates caps are removed.

Figure 3 Solar PV Prices econ

The bottom line is that despite the lower PV panel costs; we are still not at parity with hydrocarbon fuels such as coal and oil. Carbon based taxes or renewable energy incentives as well as more investment into alternative energy should improve the economics of solar and wind and bring us to grid parity.

Oil Consumption Impacted More by Price than Deteriorating Economic Conditions

The fall in oil consumption was most dramatic following the escalating price of crude oil to $145.16 per barrel on July 14, 2008 then at any other point over the last several years. Price elasticity, a key concept in Economics 101, which measures the impact of price change to changes in unit volume sold, is helpful in determining which products have readily available substitutes or which, like oil are inelastic with no real substitutes.

As illustrated by Benjamin Graham and David Dodd in their book Security Analysis, 1940 edition, during the 1930’s the economy had a dramatic impact on spending and consumption particularly on discretionary items such as travel. In one illustration, the change in demand was most pronounced in railroad revenues where tickets purchased for railroad travel, declined 51% from 1929 to 1993 as measured by gross receipts for the railroad industry. Over this same period, spending on the consumer staples (inelastic demand), such as electricity encountered a decline of only 9%.

While almost everyone would agree that the current economic climate is one of the most challenging since the 1930’s, a quick review of oil consumption over the last several years illustrates that demand has not significantly contracted, suggesting driving habits only changed when prices escalated to over $100 per barrel. Oil consumption dropped only 4.9% from January 2008 through January 2009.

Figure 1 Oil Consumption Oil

As seen from Figure 1, the sharp drop in oil consumption in September 2008 of 8.3% appears as an aberration when measured over the whole year. The fact there are no real substitutes for oil in the transportation industry illustrates two important points: 1) structural changes to driving patterns are required to see appreciable changes to oil consumption and 2) how vulnerable we are as a nation with no readily available substitutes for oil in the transportation systems.

Figure 2 Oil Demand in China and India Wood Prices

With China and India undergoing significant structural changes as they rapidly migrate towards motor vehicles for transportation suggests the demand for oil should continue to grow relatively unabated. Until the price of oil climbs back over $100 per barrel, we will not see the structural changes necessary to develop alternatives to oil in the transportation market.

The bottom line: energy and in particular, oil has not experienced a dramatic drop in demand during 2008 suggesting driving patterns were influenced more by the price of oil then the struggling economy. We must begin to shift emphasis to alternative energies such as solar as well as hybrids and electric vehicles.

A Historical Perspective on Energy Prices and Economic Challenges

To understand current energy prices it may serve us to examine historical energy prices. Our theme is energy economics and specifically that energy prices follow the laws of supply and demand to set pricing.

There are some interesting perspectives on historical energy prices from several books including Security Analysis, 1940 edition by Benjamin Graham and David Dodd, The Great Wave, by David Hackett Fischer; and The Industrial Revolution in World History, by Peter Stearns. These books provide extensive data on pricing, industry revenues, and the framework that energy and technology serve in the economics of the industrial world.

Figure 1 Historical Energy Prices Energy Prices

With the risk of oversimplification, our first figure shows there have been four distinct energy prices waves that have rippled through history. The scarcity of wood that was used for building homes, heating, and tools became increasing scarce as deforestation spread through Europe in the 1300s and followed again in the 1600’s. Coal prices rose rapidly with the War of 1812 and the Napoleonic Wars. Oil prices peaked in 1982 and to an all time high of $145.16 on July 14, 2008.

Figure 2 Medieval Wood Prices Wood Prices

During the Medieval period in world history wood prices increased nearly threefold according to David Fischer in the The Great Wave. Wood prices rose with scarcity and peaked in 1320 as impact of the Bubonic Plague began to kill a quarter of Europe’s’ population. Twenty years from its peak in 1320, wood prices declined by 48% as the Bubonic Plague reduces the population and in turn, lowering the demand for wood.

Figure 3 Wood Prices Wood Prices

Figure 3. Illustrates the rapid rise in the demand for wood as the growing world populations benefited advances in science and agriculture from the Renaissance period. Wood is used for just about everything and prices climb as more land is used for agriculture leading to deforestation exacerbating the wood shortage. As demand for wood increases, prices subsequently follow. By the end of the 1600’s, coal begins to substitute for wood as an energy alternative.

With advances in technology came improvements in coal mining and transportation that allowed coal to substitute for wood as an energy source. With the invention such as Thomas Newcomen’s steam, powered pump in 1712 that facilitated coal mining and James Watt’s steam engine in 1765 that lead to advances in transportation including railroads and machinery, coal grew in importance as an energy source. These advances in technology enabled greater supplies of coal to enter the market which lead to declines in energy prices.

Figure 4 Coal Prices Coal Prices

We can gleam from Figure 4 that coal prices peaked in 1810-to-1815 coinciding with the War of 1812 and the Napoleonic Wars. The technological advances in mining and transportations fostered the development of an infrastructure to support the coal industry. The price of coal rose as wars ragging in Europe and the US, increased the demand for materials and supplies such as coal. However, as the wars came to an end, the abundant supplies of coal allowed prices to fall keeping energy prices low.

Oil entered the picture with the drilling of the first oil well in northwestern Pennsylvania in 1859 and the Internal Combustion Engine in 1860 that facilitated the development of the oil industry.

As oil emerged to become the dominant fuel of the 20th Century, it’s only recently that we face supply shortages. To better understand the dynamics of energy pricing in the face of changing demand, a review of spending on railroads and electricity may serve as a surrogate for discretionary and consumer stable spending patterns.

Figure 5 Industry Segment Revenues Industry Revenues

Figure 5 illustrates changes in the aggregate revenues of railroads in comparison to electric utilizes during the Great Depression. Copious notes taken by Graham and Dodd for their book Security Analysis help to demonstrate the economic laws of supply and demand.

The change in demand was most pronounced in railroad revenues. Expenditures on railroads, the more discretionary of the two industries, declined 51% from 1929 to 1993 as measured by gross receipts for the railroad industry. Over this same period, spending on the consumer stable, electricity only encountered a decline of 9%. In economic terms, railroads demonstrate greater demand elasticity meaning there is greater change in demand at prices change or this period, disposable income. While there is some discretionary portion of our spending associated with oil, a large portion of spending on oil is out of necessity. Therefore, even during times of great economic distress, the propensity for energy consumption is not eradicated entirely.

The bottom line: Energy pricing will continue to be dictated by supply and demand. Hydrocarbon fuels such as oil are finite in nature and therefore, without definitive strategies to cultivate alternative energy resources we will remain hostage to the vagaries in energy prices..

Don’t let the fall in Oil Prices Lead to Energy Complacency

The precipitous drop in oil prices may not hold for long. Speculators and fears of oil flow disruptions drove oil prices to an all time high of $145.16 on July 14, 2008 and is now down to $49.50 in November 20, 2008. Now the fear has shifted to the economy where deteriorating fundamentals suggest demand for oil will abate, at least in the near term. However, if history is any guide, demand for oil should be influenced by both structural changes such as consumers driving more fuel-efficient motor vehicles and cyclical factors such as the state of the economy.

Figure 1 US Historic Oil Imports Oil Imports

To get an understanding of the impact that both structural and economic factors had in reducing the demand for oil is to look at oil import from 1978 to 1988. Figure 1 illustrates the US demand for oil during the last major economic recession. The Oil Shock of the 1970’s severely impacted the US economy and the term stagflation captured our attention while interest rates reached exorbitant levels. From 1979 to 1982, US oil imports decline by 46% as the oil embargo of 1973 led to structural changes in oil consumption. US oil imports, as measured by the Energy Information Administration in U.S. Crude Oil Field Production (Thousand Barrels per Day) demonstrated a significant decline as a result of changing driving habits as fuel efficient import vehicles encroached on the domestic auto makers. The US consumers opted for foreign vehicles demonstrating higher fuel efficiencies and MPG entered our lexicon. These economic and structural changes dramatically reduced the demand for oil and subsequently, oil prices fell. It was not until 1985 before oil imports began to increase.

What’s missing from this analysis is the fact that during this period the US accounted for 27% of total world oil demand. . According to the Energy Information Administration (EIA), in 1980, China and India accounted for 2.8% and 1.0%, respectively, of the global demand for oil. In 1986, China and India increased their oil demand to account for 3.2% and 1.5% of the world market, respectively, an increase in oil demand of 57% for China and 44% for India.

In 2005, China and India account for 8.0% and 2.9% of global oil demand while US dropped to 24.9% of global oil demand. While even China and India are not immune to the current blissful economic environment, when the global economy does improve, their demand for oil will more than negate any structural changes the US consumers make in their driving habits. The demand for oil should continue to grow as an economic recovery ensues thereby leading to an increase in oil prices.

Figure 2 China and India Oil Consumption CHINA AND INDIA

Figure 2. illustrates the rapid rise in the demand of oil from China and India. From 1980 to 2005, demand for oil increased 280% in China and 125% in India. Despite the improving fuel consumption in the US, the global oil market is more apt to be impacting from the growth in developing countries than conservation in the US.

The bottom line: don’t remain complacent, strive for energy efficiency and invest into alternative energies.

For further reading on oil prices please refer to
oil price analysis .

Vote the Economy by Voting for Energy

Access to energy was instrumental fueling the Industrial Revolution. Over the last 200 years, industrial nations have migrated from wood to coal and now to oil as a source of energy. During the 1700’s, wood was used for just about everything from fuel to constructing houses and building wagons and even tools. As demand for wood increased, the cost of wood rose as deforestation led to the scarcity. The scarcity of wood resulted in deteriorating economics.

It was the availability and access to coal that enabled the growth of Industrial Revolution by providing accessible energy. The Industrial Revolution was predicated upon the availability of Labor, Technology, Capital, and Energy. Scarcity of any of these inputs could undermine economic growth, as was the case with capital during the Great Depression of the 1930’s and the Energy Shock of the 1970’s.

Oil, driven by rapid growth in automobile usage in the U.S, has replaced coal as the main energy fuel. According to the Energy Information Administration (EIA), the 70% of oil consumption in the U.S. is for transportation .

Figure 1 US Oil Imports Oil Imports

Figure 1 illustrates US historical oil imports, as measured by the Energy Information Administration in U.S. Crude Oil Field Production (Thousand Barrels per Day) that dates back to 1970. The EIA provides oil import data dating back to 1910. To estimate the amount of money the US spends on oil imports every year, we can use the data from the State of Alaska Department of Revenue, which provides historical data on the price of oil an derive an average yearly figure.

Figure 2 US Oil Import Spending Oil Spending

Figure 2. appears quite staggering given the amount of money we send to oil producing countries. The US is spending hundreds of billions to import oil. According to the EIA, the US imported an average of 10,031,000 barrels per day equating to $263 billion in imported oil during 2007 when the State of Alaska measured the yearly average spot price for a barrel of oil at $72.

According to Solarbuzz, Germany leads the world in solar photovoltaic (PV) installations with 47% of the market while China increased its market share of PV production from 20% to 35%. The US accounts for 8% of the world solar PV installations. Solarbuzz indicates the global solar PV industry was $17 billion in 2007 and the average cost of solar electricity is $0.2141 per KWH. If a portion of our $260 billion sent to oil producing countries were to be invested into solar energy, perhaps the US would not lag the world in alternative energy.

The bottom line is that the money spent on importing oil has a deleterious impact on our economy and continues our dependence on hydrocarbon fuels producing carbon and other harmful byproducts that negatively impact our climate and health of our children. The longer we are dependent on oil, the longer our economy and environment suffer. Use your vote for alternative energy and not drill baby drill.

”DRILL BABY DRILL” – NO INVEST INTO ENERGY TECHNOLOGY

Using the latest data from the Energy Information Administration (EIA) , oil production remains significantly below historical levels achieved in ‘70’s and ‘80’s. The peak production in 1970 has not been replicated despite significant expansion of drilling activity during the 1980’s.

Oil Drilling and Production

Figure 1 Oil Drilling and Production Oil Production

Figure 1 illustrates US historical oil production, as measured by the Energy Information Administration in U.S. Crude Oil Field Production (Thousand Barrels per Day) that dates back to 1920 juxtaposed against U.S. rig count, as measured by Bakers Hughes. The chart suggests that during the first energy shock to hit the US and the world, drilling activity expanded dramatically. By 1981, weekly North American oil rig count reached a high of 4,530 oil rigs in 1981.

U.S. Crude Oil Field Production reached a peak of 9.6 million barrels per day in 1970. In 1981, the height of US oil drilling, oil production was 8.57 million barrels per day. By 2002, U.S. Crude Oil Field Production was 5.74 million barrels per day. Over the last six years oil production declined 10.7% while over this same period, drilling activity as measured by Baker Hughes’ North American Rigs Running weekly rig count, increased 125%.

The decline in U.S. oil production is quite disturbing. During the last decade, a host of new technologies were introduced to help facilitate oil production. Companies such as Dawson Geophysical Co. (DWSN) that enhanced the market for energy exploration by providing seismic data acquisition services. Dawson Geophysical acquires and processes data using 2-D and 3-D seismic imaging technology to assess the potential of hydrocarbon sources below the earth’s surface.

Companies such as W-H Energy Services Inc. that was recently acquired by Smith International, Inc (SII) , offer an array of drilling services such as horizontal and directional drilling for onshore and offshore oil drilling, and 3-demensional rotary steering drilling systems. Smith Int’l is growing revenues at over 19% annually and Dawson’s revenues are growing 53%. With these oil drilling and energy exploration technologies growing at double rates, and drilling activity expanding at 14%, why is oil production falling?

With the rancor of “drill baby drill’ heard as call to solve the energy crisis, energy technologies such as solar and wind energy solutions deserve greater emphasis. Oil will eventually run out. There is a finite amount of oil in the ground. The Tar Sands will not solve the problem. According to Alberta Energy, sand oil production was 966,000 barrels per day (bbl/d) in 2005 and is expected to reach 3 million bbl/d by 2020. Tar sands would only contribute 3.5% towards our current oil consumption of 84.5 million barrels per day.

The bottom line is that our dependence on oil leaves our economy vulnerable. Energy is the catalyst that enables economic development. The longer we are dependent on importing oil from countries hostile to civilized existence, the more tenuous grows the environment. We need to conserve existing energy use and invest into energy technologies that foster the development of alternative energies, thereby, limiting our dependence on oil period.

Energy Crisis- Can we drill our way out?

Rising energy prices and our diminishing supply of oil threaten our national security. Without access to energy our economy and national defense are vulnerable to collapse. As a solution to our energy needs, we hear political rhetoric to expand oil drilling, but our energy strategy requires a long term solution that means embracing alternative/renewable energy technologies such as solar and wind. It only takes a quick review of oil production statistics to realize how formidable the challenge is that we face.

According to the Energy Information Administration (EIA) in 2007, the US consumed 20.6 million barrels of oil per day (bpd) but we were only able to produce 8.5 million bpd, leaving a deficit of approximately 12.2 million bpd. This means the US needs to import 60% of its oil and at a cost of $130 per barrel, the US will spend approximately $600 billion a year on imported oil.

Oil prices have increased dramatically with an increase of 420% since 2001. The combined impact of rising prices and diminishing oil production leaves the US in a precarious position. Yet, drilling for more oil may not rectify this tenuous situation.

As an example, back in the 1980’s, drilling activity in Alaska helped to ameliorate the oil crisis of the 1970’s. Today, oil production in Alaska has declined significantly. From its peak in 1988, oil production in Alaska has decline 64%. In Figure 1, oil production in Alaska in contrasted to the price of oil per barrel from 1980 to June 2008.

Figure 1 Alaska Oil Production
Alaska Oil

When we measure the supply and demand for oil, we find in the US, it is really a supply problem. According to the EIA , US demand for oil is growing at an annual rate of one percent over the last ten years, but oil production is down 20% since 1987.

Figure 2 US Oil Production
Oil

The energy problem however, is global. The demand for oil in the US may slow, yet supply constraints driven by growing consumption in developing countries could exacerbate this already bleak picture. On a per capita basis, the US consumes approximately 25 barrels of oil per person annually or a little over 600 gallons a year. That figure greatly exceeds other countries and particularly those in developing nations such as China.

In China, oil consumption per person is only 2 barrels or 84 gallons a year. However, oil consumption in China on a per capita basis has increased 88% from 1996 to 2006 according to data from the EIA. Despite China’s one percent population growth, at its current oil consumption growth rate, China is expected to double its current oil consumption by 2015 to over 14 million bpd and exceed the US in oil consumption by 2020. China’s current oil appetite suggests that in 14 years China will require an additional 14.6 million barrels per day. Even if oil producing countries are able to produce the additional oil, those countries that are unable to meet their own needs such as the US and China, will continue to be held hostage to oil producing states.

Figure 3 China Oil Consumption per Capita
China Oil

The bottom line: the energy model based on hydrocarbon fuels is broken. Neither drilling for more oil will not satisfy our energy needs nor will corn-based ethanol. We need to rapidly embrace electric vehicles using solar, wind, and fuel cell technologies to provide alternative energy solutions. It time to put energy as the most critical component of our national security. Energy should be front and center for the US election. It’s time to invest into clean and renewable energy solutions.

Peak Oil – Time for Investments into Alternative Energy

The question of Peak Oil, first proposed by Dr. M. King Hubbert can best be illustrated by analyzing the supply and demand for oil. With use of statistics complied by Energy Information Administration (EIA) , the tenuous position our energy needs becomes more apparent. Let’s examine the latest data from the EIA to provide a picture of the global demand and supply of oil.

Oil Demand

Figure 1 Oil Demand U.S. and China
Oil Demand

From Figure 1 we can see that while the demand for oil in the U.S. has grown at a rather moderate rate in comparison to China. The demand for oil in the U.S. declined at an average annual rate of 0.4% during the 1980’s. U.S. oil demand has averaged at a 1.5% compounded annual growth rate (CAGR) during the 1990’s and 1.0% in the last five years since 2001.

In China, demand for oil is grew at 2.7% CAGR during the 1980’s and increased to 7.6% in the 1990’s. Since 2001, the demand for oil in China is growing at an 8.1% CAGR over the last five years. The strong demand for oil from China is remains unabated and is driven by growing motor vehicle usage. In nine years, at its current growth rate, China’s oil consumption will exceed the level of oil consumption the U.S. had in 1991 and in twelve years exceed our current level.

Figure 2 Oil Demand in China
China Oil

Figure 2 illustrates that the demand for oil in China is quite substantial. With the rate of growth in oil consumption in China exceeding 8% it won’t take very long to exacerbate our tenuous current energy position. Perhaps a review of oil production will shed some light on the topic.

Oil Supply

The following graphs provide a review of oil supply from the Middle East, Saudi Arabia, OPEC, Russia and surrounding Eurasia countries including the former Soviet Union.

Figure 3 Oil Production Middle East and Saudi Arabia
Saudi OIL

While oil production contracted somewhat during the 1980’s, oil production in the Middle East and Saudi Arabia has grown since 1980, but recent oil production appears constrained. Oil production in the Middle East is up 3.1% on a CAGR during the 1990’s, and has remained at that level since 2001. Saudi oil production grew 3.0% during the 1990’s, but has dropped slightly to 2.1% since 2001.

Meanwhile, among the countries of the former Soviet Union, we see oil production gaining strength. In the countries comprising the former Soviet Union (Eurasia), oil production is up 6.7% on a CAGR since 2001.

Figure 4 Oil Production Eurasia, Middle East and Saudi Arabia
Oil ME

Currently OPEC accounts for approximately 37% and Saudi Arabia 11% of the world’s oil production. Saudi Arabia is recognized as having the largest oil reserves in the world and its Ghawar oil field is the single most productive oil field in the world, according to a recent article in the Wall Street Journal . “Saudis Face Hurdle in New Oil Drilling” The Saudis are developing new fields such its Khurais field, but are finding production efforts challenging as they employ deep horizontal drilling and water injection to achieve production. Given what we glean from the EIA production statistics, achieving moderate oil production growth maybe more of a challenge then we think.

Figure 5 Monthly Oil Production
Monthly Oil

The bottom line is that our dependence on oil leaves us vulnerable not only to supply disruptions but also in trying to protect supply in countries that gravitate towards violence and terrorism. If more global efforts were employed to develop alternative energies, we could limit our dependence on oil, improve global economics by offering affordable energy to the world, and save our environment and climate – a small step for our planet.

The Economics of Energy – why wind, hydrogen fuel cells, and solar are an imperative

From the Industrial Revolution we learned that economic growth is inextricably linked to energy and as a result, our future is dependent upon equitable access to energy. When the Stourbridge Lion made entry as the first American steam locomotive in 1829 it was used to transport Anthracite coal mined in nearby Carbondale, PA to a canal in Honesdale that in turn linked to the Hudson River and onto New York City. Coal fueled the growth of New York and America’s Industrial Revolution because coal was cheap and more efficient than wood.

Advances in science and technology gave way to improvements in manufacturing, mining, and transportation. Energy became the catalyst to industrial growth. Steam power such as Thomas Newcomen’s steam powered pump in 1712 developed for coal mining and James Watt’s steam engine in 1765 were initially used to bring energy to market.

In terms of heating efficiency, coal at the time offered almost double the energy, pound for pound, in comparison to wood. Energy Units and Conversions KEEP Oil offers higher energy efficiencies over coal and wood, but as with most hydrocarbon fuels, carbon and other emissions are costly to our economy and environment.

With rapid growth in automobile production in the U.S., oil became the predominant form of fuel. According to the Energy Information Administration, in 2004 the U.S. spent over $468 billion on oil.

Figure 1 U.S. Energy Consumption by Fuel
Energy Consumption

We all need to become more conversant in understanding energy costs and efficiency and as a corollary, better understand the benefits of renewable energy such as solar, wind, and hydrogen fuel cells. A common metric we should understand is the kilowatt-hour (KWH) – the amount of electricity consumed per hour. The KWH is how we are billed by our local electric utility and can be used to compare costs and efficiency of hydrocarbon fuels and alternative energies.

One-kilowatt hour equals 3,413 British Thermal Units (BTUs). One ton of Bituminous Coal produces, on the average, 21.1 million BTUs, which equals 6,182 KWH of electric at a cost of about $48 per short ton (2,000 pounds). That means coal cost approximately $0.01 per KWH. To put that into perspective, a barrel of oil at $90/barrel distilled into $3.00 gallon gasoline is equivalent to 125,000 BTUs or 36.6 KWH of energy. Gasoline at $3.00/gallon equates to $0.08 per KWH. So gasoline at $3.00 per gallon is eight times more expensive than coal.

Is oil and gasoline significantly more efficient than coal? Let’s compare on a pound for pound basis. A pound of coal equates to about 10,500 BTUs or approximately 3.1 KWH per pound. A gallon of gasoline producing 125,000 BTUs weighs about 6 pounds equating to 6.1 KWH per pound (125,000 /3,413 /6). While gasoline is almost twice as efficient as coal, coal’s lower cost per KWH is why it is still used today to generate electric.

The Bottom Line: the economics of energy determines its use – coal still accounts for approximately half of our electric generation because it has a lower cost than other fuels. However, there are two factors to consider 1) the cost of carbon is not calculated into the full price of coal or other hydrocarbon fuels and 2) the cost of conventional fuel is calculated on a marginal basis while alternative fuel costs are calculated on a fixed cost basis. Meaning the cost of roads, trucks, and mining equipment is not factored into the price of each piece of coal, only the marginal cost of producing each ton of coal. For solar, hydrogen fuel cells, and wind energy systems, the cost to construct the system is factored into the total cost while the marginal cost of producing electric is virtually free. We need a framework to better measure the economics of alternative energy. The impact of carbon on our climate and global warming are clearly not measured in the costs of hydrocarbon fuels nor is the cost of protecting our access to oil such the cost the Iraq War.

Despite the carbon issues surrounding coal, (coal has higher carbon-to-hydrogen ratio in comparison to oil or gas) coal is more abundant and therefore is cheaper than oil. As electric utilities in 24 states embrace alternative energies through such programs as Renewable Portfolio Standards (RPS), perhaps the benefits of alternative energies will begin to combat the negative economics of hydrocarbon fuels.

Energy Shocks: Vulnerability Update

Rising oil prices have driven exploration and drilling activity, yet oil production remains anemic in comparison. Could the latest data suggest oil production is nearing a peak? With global demand expected to rise over 30% by 2030 according to a recent article in the Wall Street Journal, Handicapping the Environmental Gold Rush the latest oil production figures suggest we are indeed vulnerable to energy shocks.

High oil prices have driven demand for energy exploration and investment into oil and gas drilling rigs. In the U.S., rig count is up 181% with 1,749 rigs in operation in 2007 from 622 in 1999 according to Baker Hughes Worldwide Rig Count. Oil prices are up quite dramatically in the last few weeks with latest price above $94/barrel.

Figure 1 Worldwide Rig Count and Oil Prices
Worldwide Rig Count

Figure 1 illustrates world-drilling rigs in comparison to oil prices. The U.S. accounts for over half the world oil drilling rigs yet our production is less than 10% of total global production. While oil prices are nearly as high as they were back in the 70’s (accounting for inflation) we are not witnessing the tremendous oil-drilling explosion as we did back then.

Part of the explanation could lie with oil production. If we look at recent data, oil production appears to be leveling off while demand is expected to increase significantly as developing countries increase their use of motor vehicles. Data from the U.S. Department of Energy (DOE) and Ward’s Communications, Ward’s World Motor Vehicle Data show that the number of motor vehicle on the road is up 48% from 1990 to 2005 with countries like China experiencing the most dramatic increase. Yet oil production over this same period is up only 27%.

Figure 2 US Rig Count and Oil Production
Rig Count and Oil Production

In the U.S., rig count is up 118% from 1999, yet petroleum production is actually down 7%. On a global basis, oil and petroleum product production increased 13% since 1999 while global rig count increased 112%. The U.S. and the rest of the world is experiencing diminishing returns on investments in oil production wile usage, led by motor vehicle consumption continues to escalate. In the U.S. more than 60% of oil consumption goes to vehicle use.

With all of the attention given to oil and hydrocarbon fuels, alternative energies are just a small fraction of our energy needs. We need to dramatically increase our research efforts into alternative energies such as solar, wind, and hydrogen fuel cells energies.

Solar and Hydrogen Energy – where vehicle fuel efficiency is headed

Despite efforts that have enabled the U.S. to limit its demand for oil, world oil demand is up significantly. Advances in technology such as solar energy and vehicle fuel cell could help the world reduce its dependence on oil.

Figure 1 Oil and Gold Prices
Oil Prices

The U.S. Department of Energy (DOE) and the U.S. Environmental Protection Agency (EPA) today released the Fuel Economy Guide for 2008 model year vehicles Fuel Economy Leaders: 2008 Model Year Coming in first place is the Toyota Prius (hybrid-electric) with city/highway miles per gallon (MPG) of 48/45. With higher fuel costs more people are factoring in fuel efficiency into their purchase decision. However, it is the purchase of pickup trucks and SUV that account for most of the vehicle purchases in the U.S. and these vehicles are dramatically less fuel-efficient than hybrids and small four-cylinder automobiles.

Despite the trend towards larger vehicles, the U.S is not experiencing a rapid rise in oil demand. Yet oil prices continue to climb. While geopolitical risk may account for the bulk of the recent price increase, latest information from the U.S. Energy Information Administration (EIA) Total Petroleum Consumption shows increasing oil demand from China.

Figure 2 Oil Demand: U.S. and China
Oil Demand

Figure 2 illustrates that while oil demand in the U.S. has grown only modestly since 2000, the growth in China’s oil demand is rising rapidly. The recent data from the EIA shows oil demand through Q2/07. The demand for oil in the U.S. is up 5% from 2000 while in China oil demand is up 59% over the same period.

Improving vehicle fuel efficiency may abate rapidly rising oil demand in the U.S., but more emphasis on diesel and hybrids could take us a lot further. For example, Toyota has been slow to introduce its diesel line of pickup trucks in the U.S. while it offers a broad line of more fuel-efficient vehicle outside the U.S. Toyota offers several cars and trucks in Europe with impressively high fuel efficiencies that are not available in the U.S. Infact, the Toyota Hilux two-wheel drive pickup truck offers a four-cylinder diesel engine with an MPG of 44.8 on the highway and 29.1 in the city.

We are also seeing progress on fuel cell vehicles that could ultimately ameliorate are demand for oil, if not eliminate it entirely, all with no carbon dioxide or other emissions. We see most major automakers developing hydrogen powered fuel cell vehicles. Honda for one has the right concept in employing solar energy to make hydrogen.

Honda’s experimental hydrogen refueling station in Torrance, CA increases the solar incre3ases the efficiency of hydrogen fuel by using solar energy to produce hydrogen. The hydrogen is then used to power Honda’s Honda’s FCX concept hydrogen fuel cell vehicle with the only emission being pure water vapor. These fuel cell vehicles may not be ready for prime time, they provide a clear reality to what is achievable.

The bottom line is that supply and demand dictate price and the availability of cheap oil is on the decline. Further research into solar and hydrogen fuel cells could significantly change our dependence on oil.

Home Heating Concerns

With oil prices over $80 per barrel, the National Energy Assistance Directors’ Association in its press release today Record Home Heating Prices for Heating is expecting the average home heating cost for the ’08-’08 season to rise 9.9%. For homeowners using oil heat, heating costs are expected to increase 28% and for homes using propane, a 30% increase is expected.

With rising energy costs driven by costly oil extraction, the potential impact from carbon emissions with our continuing use of oil on climate change and rising sea levels, as well as the potential for fuel supply disruptions, could exacerbate our tenuous relationship with energy.

Eventually, as price rise dramatically, alternative energy becomes more compelling. The problem is our economy is so inextricably link to oil, that our energy security is based on securing foreign oil.

Figure 1 Oil Prices and Home Heating CostsHome Heating

Without support and research on alternative energies such as solar and fuel cell technologies, we are hostage to oil. The U.S. economy is facing one of the most crises since the Oil Embargo of the 1973. Inflation driven by escalating oil prices is impacting the cost of home heating, transportation, production, materials, and food, particularly as corn is diverted to ethanol production. The housing market is in turmoil with falling home values, rising foreclosures, and a credit crisis that is making it more difficult to secure a mortgage may lead to slower consumer spending. With rising inflation and slower growth we may find ourselves in an economic world described as stagflation that was coined in the ’70’s to describe the bleak environment when gas stations rationed fuel, unemployment grew and the Federal Reserve raised rates dramatically to quell inflation.If we could limit our dependence on foreign oil through investment into solar energy and fuel cell technologies, we would not be impacted by the exogenous events in oil producing nations.

We believe there are a number of catalyst that could serve to dramatically lower the cost of alternative energies. It takes initiatives from all of us to change the balance. After all, oil is becoming more costly to extract, new oil discoveries are in difficult and challenging environments, and oil will eventually run out – it is finite. If we wait to long, our ability to make a difference may not be available.

Coal: Fueling the American Industrial Revolution to Today’s Electric

Why the economics of coal helps us better understand the benefits of wind and solar energy

On August 8, 1829, the Stourbridge Lion made entry as the first American steam locomotive in Honesdale, PA initiating the American Railroad. The steam locomotive railroad was the first developed to transport Anthracite coal mined in nearby Carbondale, PA to a canal in Honesdale, linking to the Hudson River in New York.

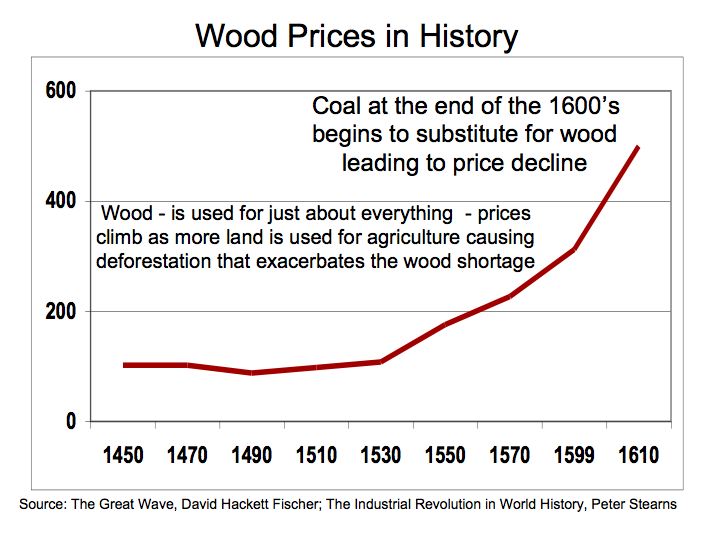
Coal as fuel energy has had an early use in American history with the 50 tons dug in 1748. Coal 1748 The history of coal dates backs to 2,000 BC and for oil it is even longer. Coal was cheaper and more efficient than wood. Coal was also more efficient to run most steam-powered engines, but was costly to transport and mine.

In terms of heating efficiency, coal offers almost double the energy, pound for pound, in comparison to wood. Energy Units and Conversions KEEP
Coal was difficult to mine and transport so engineers in America during the Industrial Revolution faced many challenges. Anthracite coal commanded a premium price because it emitted less smoke, was harder and contained more carbon giving it more fuel content than softer Bituminous or Lignite coals. There are several types of coal along a hard-to-soft classification. The makeup of coal changes according to compounds of lower hydrogen content and higher carbon – types of coal. Coal Ash Research Center University of North Dakota
The Anthracite coal deposits in Northeastern, PA are the largest deposit in the U.S. The gravity railroad linking Carbondale to Honesdale was an example of capital, knowledge, and technology meeting the growing need for energy.

Figure 1 Gravity Railroad
Gravity Railroad

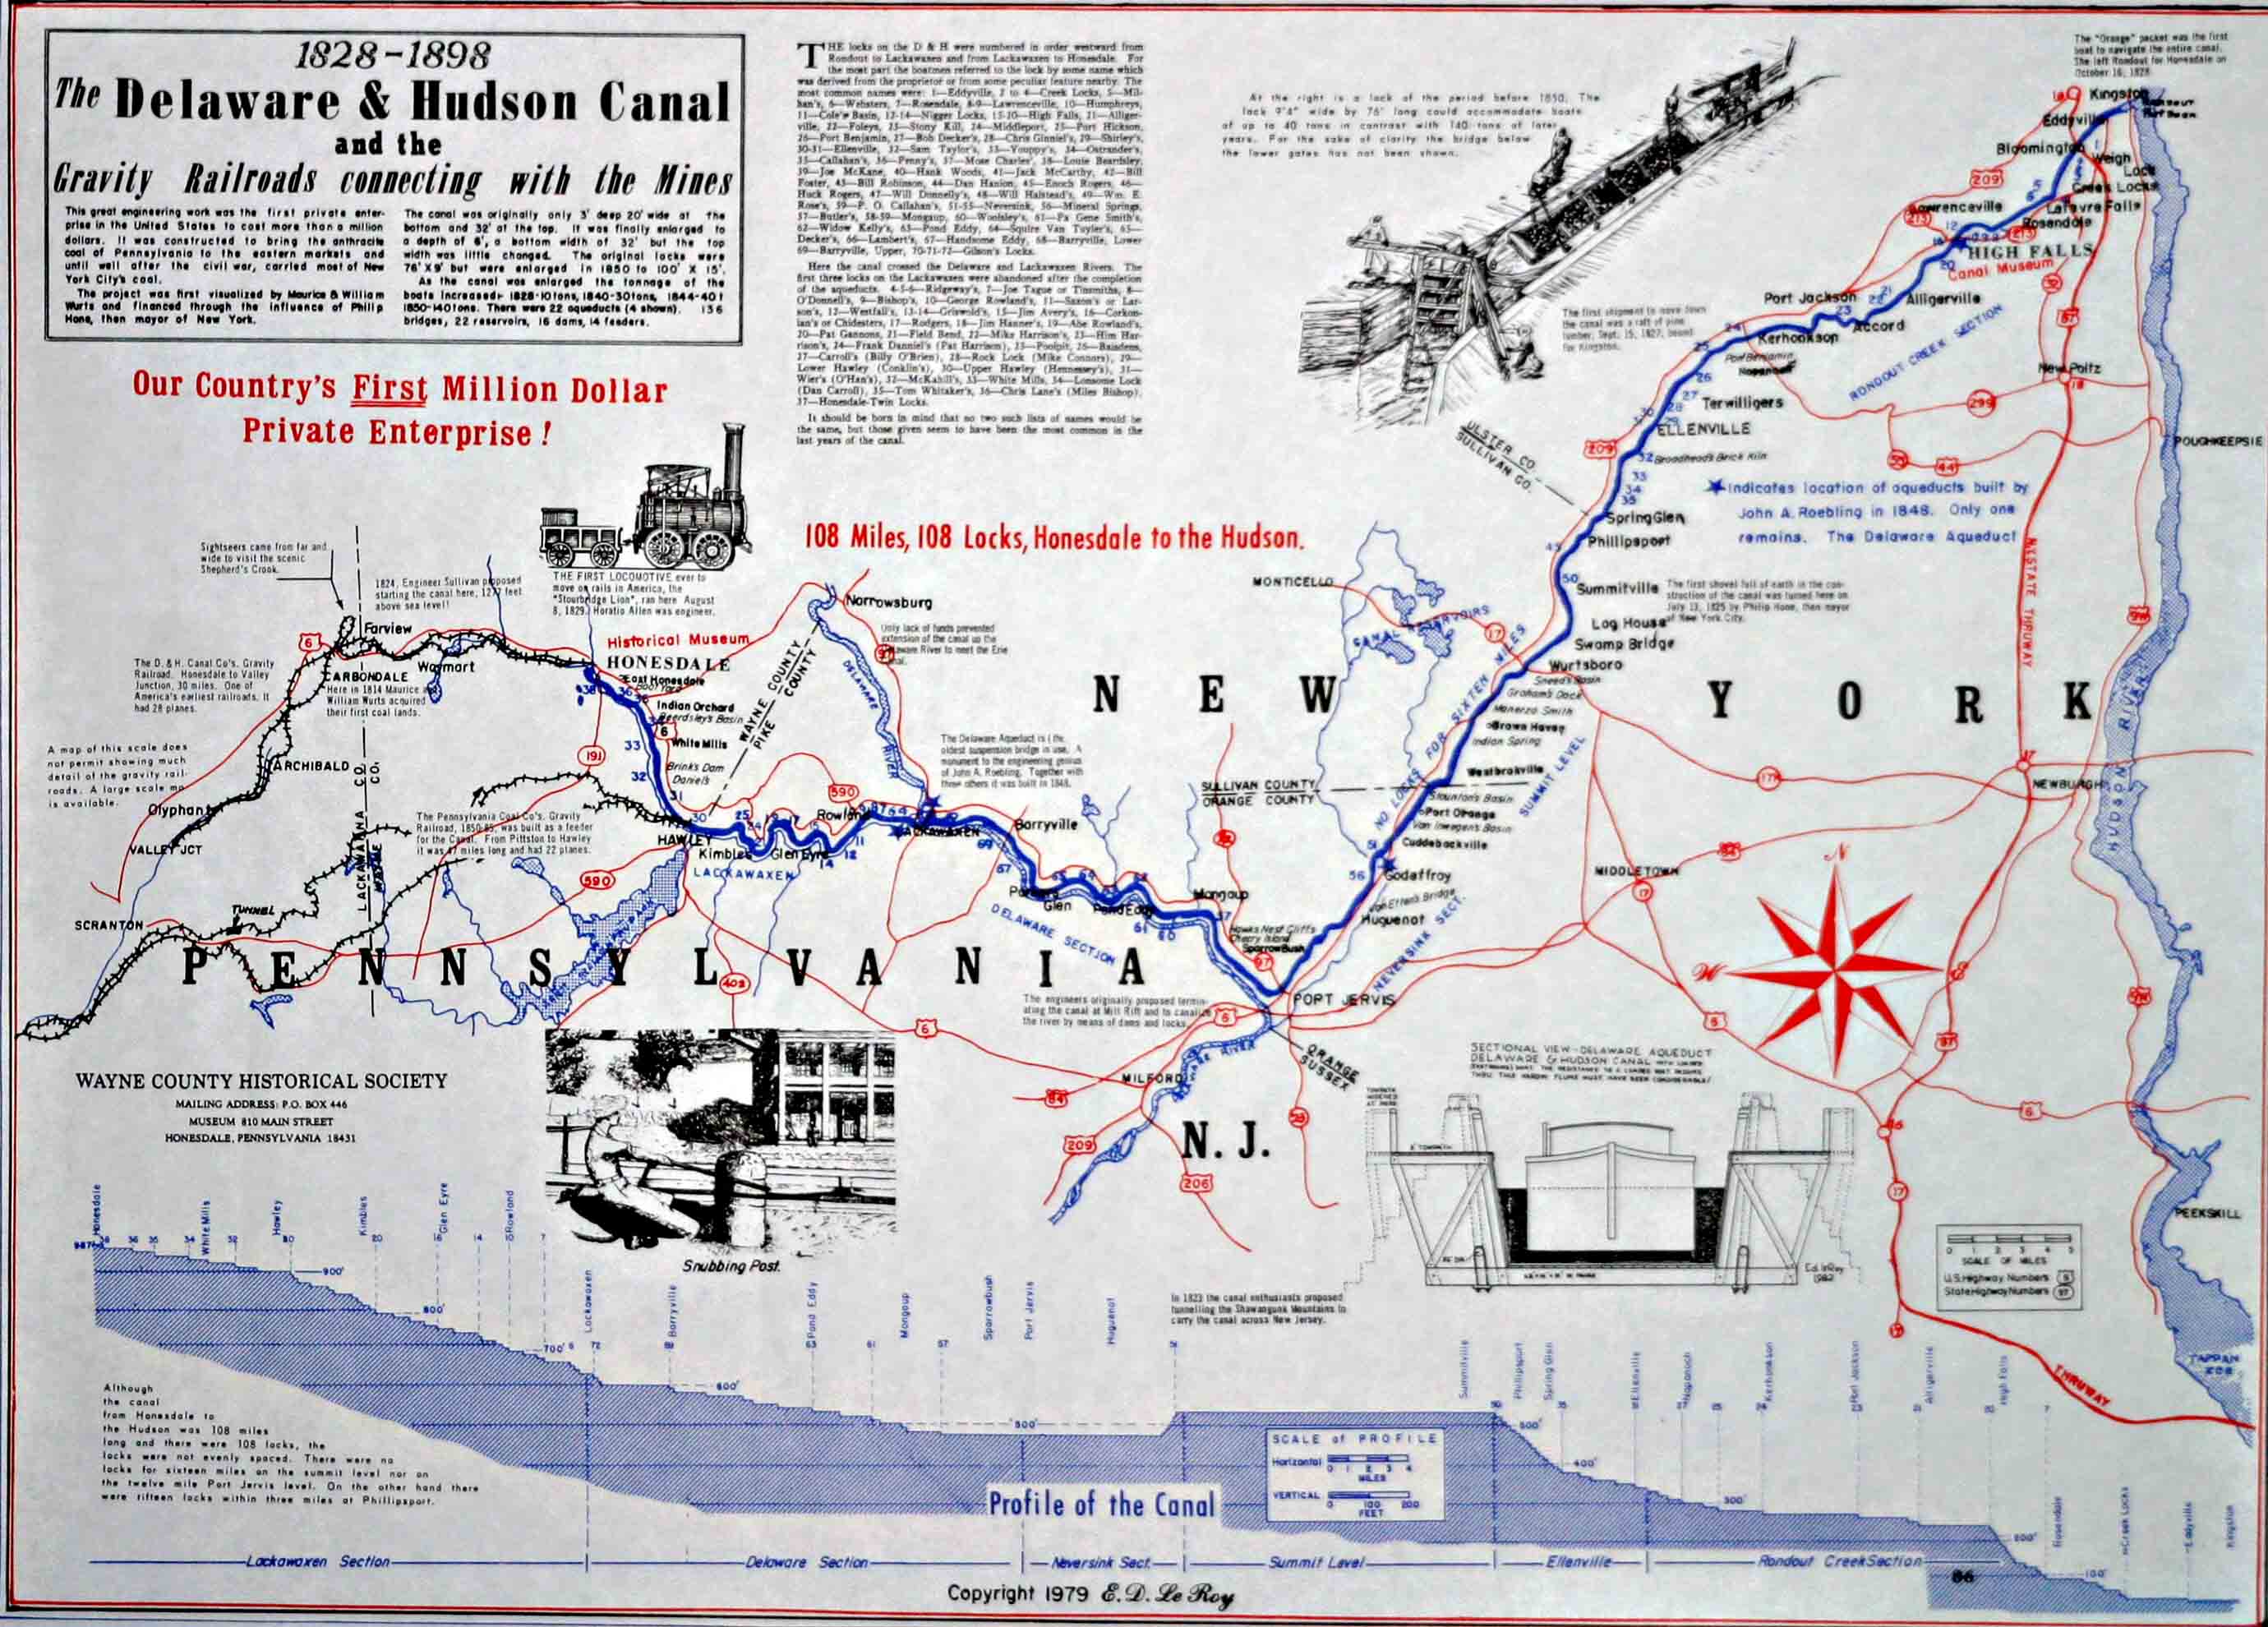
Coal was an important component for commerce and heating. With access to the large Anthracite coal deposits in Northeastern, PA, New York City gained an advantage over competing port cities like Boston and Philadelphia. It was the energy infrastructure of the railroad and canal transportation network that enabled New York to access coal. Essentially, coal provided the fuel for the Industrial Revolution and New York City’s ability to access coal to meet the needs of its growing population and commerce was critical to the city’s success. Honesdale, PA was named in honor of then mayor of New York. Wayne County Historical Society

To understand the economics of coal let’s start with a measurement of energy. One ton of coal is equal to 16.2-to-26 million BTUs (British thermal units) of energy. A BTU is the amount of heat necessary to raise one pound of water by one degree Fahrenheit.

What is the economical value of a BTU? A common metric we should understand, particularly when we pay our utility bills is the kilowatt-hour – the amount of electricity consumed per hour. The KWH can be used to compare the efficiency and cost of wood, coal, oil, and gas. Also we can equate KWH to horsepower and have a common measure between energy usage and costs for our home and car.

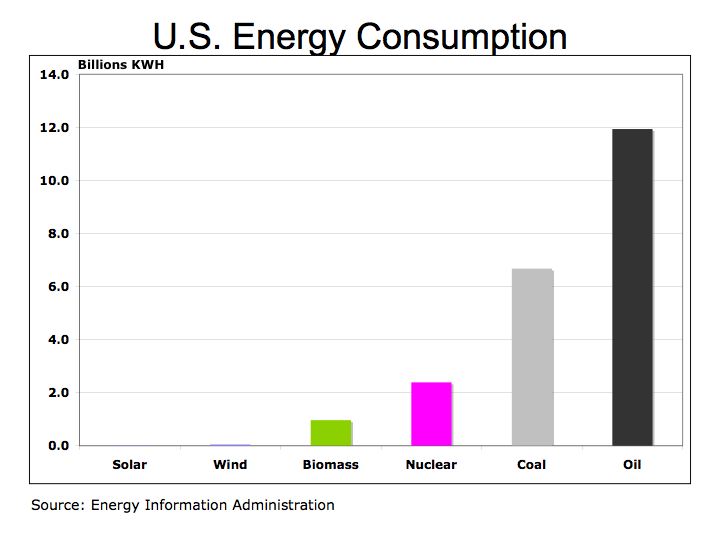
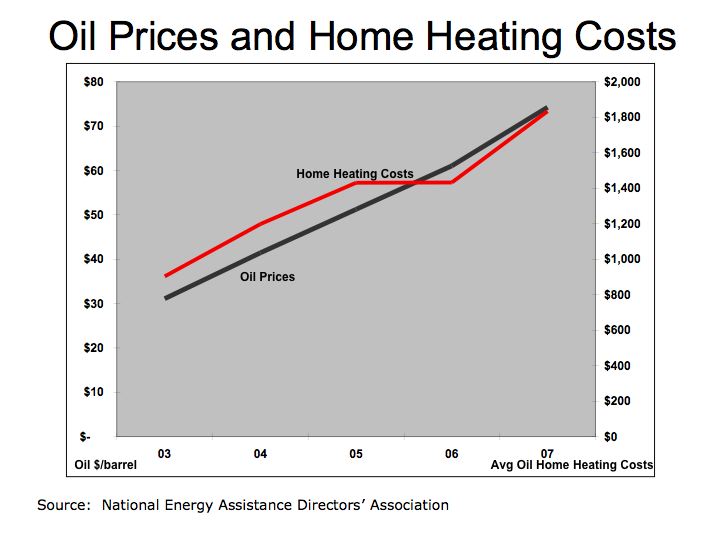
Let’s convert fuel energy into a common equivalent. One-kilowatt hour (KWH) equals 3,413 BTUs. One ton of coal produces, on the average, 21.1 million BTUs, which equals 6,182 KWH of electric at a cost of about $36 per short ton (2,000 pounds). That means coal cost less than$0.01 per KWH. To put that into perspective, a barrel of oil at $77/barrel produces 1,700 KWH of electric equating to 60% higher efficiency pound for pound than coal. However, on a cost per KWH basis, oil cost about $0.05 per KWH. Coal’s lower cost per KWH is why it is still used today to generate electric.

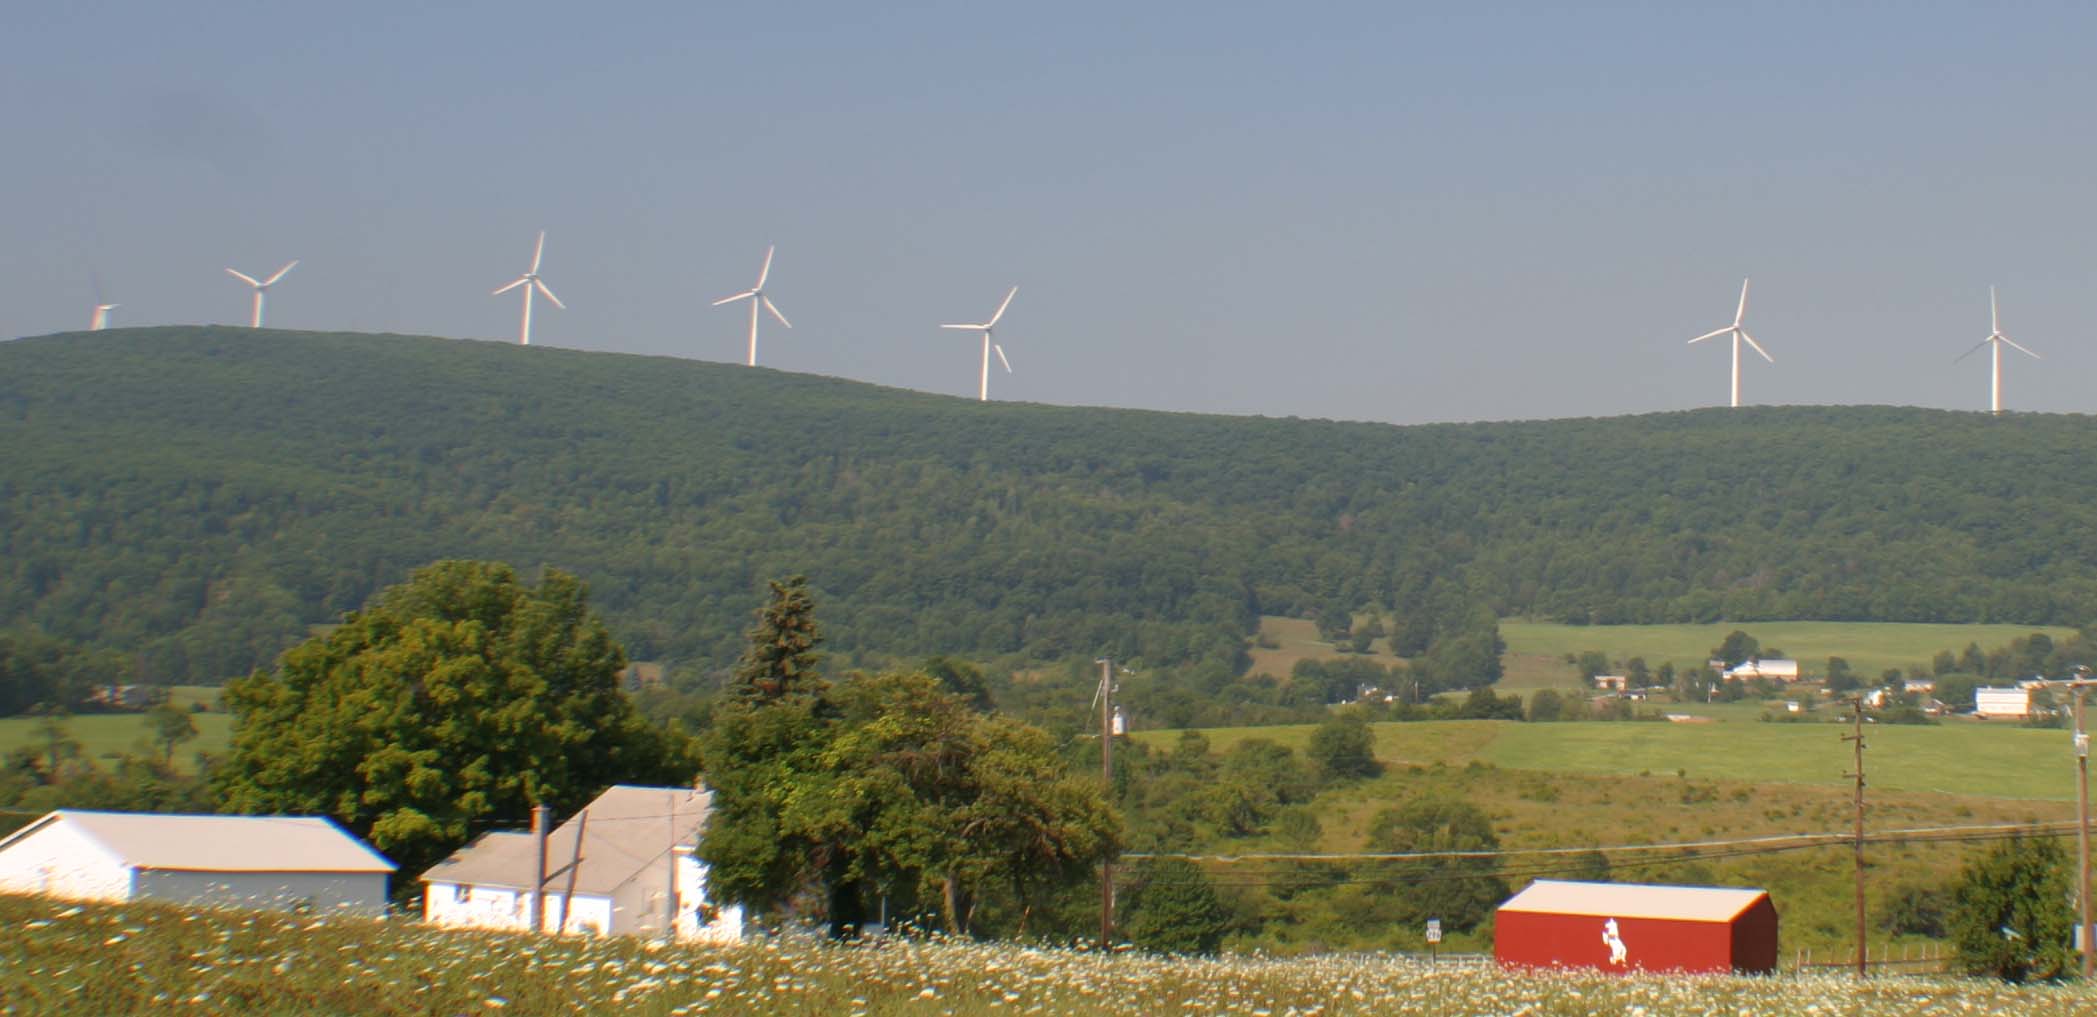
Today, the Moosic Mountains who’s 1,940 foot pass became a formidable engineering challenge for transporting coal from Carbondale to Honesdale is adorned with wind mills from Florida Power & Light providing 64.5 megawatts of electric, enough to power 22,000 homes. Florida Power & Light
(FPL) is the largest generator of wind energy in the U.S. The irony is the mountain range with the largest deposits of Anthracite coal in the world and first used to provide electric to New York City, is now hosting windmills to generate electricity for homes and businesses.

Figure 2 Wind Energy
Waymart Wind Energy Center

FPL is one of the growing list of utilities that are adopting alternative energy including wind energy programs in 15 states and offering rebates up to $20,000 for solar photovoltaic residential systems and up to $100,000 for commercial systems. The windmills atop Moosic Mountains produce electric replacing 3,800 tons of coal a year. A ton of coal produces 746 kg (1,644 lb.) carbon, so the windmills save our atmosphere from about 3,131 tons of CO2. The incremental increase in CO2 emissions should be added to the cost of coal because it has significantly higher carbon byproduct per KWH than oil or gas. Carbon content of fossil fuels

The coalmines are closed today along with the railroads and canals. Changes in the economic value of coal impacted numerous towns and villages across the region. Anthracite coal production in Pennsylvania reached its peak in 1917 when more than 100 million tons of coal was mined with the anthracite industry employment reaching its peak in 1914 with about 181,000 workers. Anthracite Coal

The value of coal diminished as demand shifted towards coke for iron and steel and oil became an energy substitute. The Carbondale region with its vast Anthracite coal deposits suffered as a result of falling demand for Anthracite coal. According the World Coal Institute, Anthracite coal has high carbon and energy content, but Bituminous coal accounts for majority of the world coal consumption because it is more abundant while coke is used in the iron and steel industry. World Coal Institute

The Northeastern, PA region experienced an economic shock as Anthracite coal lost its appeal. Demand shifted towards oil at the high end for transportation and the more abundant Bituminous coal at the low end. Anthracite represents only 8% of coal production today with Bituminous accounting for 76% and Lignite 16%. Those communities in Northeastern, PA that were more tightly linked to coal mining fell deeper into financial turmoil as the demand for Anthracite coal declined.

The Bottom Line: the economics of energy determines its use – coal still accounts for approximately half of our electric generation because it has a lower cost than other fuels. However, there are two factors to consider 1) the cost of carbon is not calculated into the full price of coal or other hydrocarbon fuels and 2) the cost of conventional fuel is calculated on a marginal basis while alternative fuel costs are calculated on a fixed cost basis. Meaning the cost of roads, trucks, and mining equipment is not factored into the price of each piece of coal, only the marginal cost of producing each ton of coal. For solar and wind energy systems, the cost to construct the system is factored into the total cost while the marginal cost of producing electric is virtually free. We need a framework to better measure the economics of alternative energy.

Despite the carbon issues surrounding coal, (coal has higher carbon-to-hydrogen ratio in comparison to oil or gas) coal is more abundant and therefore is cheaper than oil. Utilities could migrate to natural gas to reduce carbon emissions, but with a cost of $0.03 per KWH, there is no economic incentive. Alternative energies such as wind and solar could provide a longer economic benefit to users, our environment, and the economy.

Our next step is to develop a framework to measure the fixed and marginal costs of alternative energy.