Category Oil Independence
Economics of Oil
Advances in technology such as seismic imaging with Dawson Geophysical and horizontal drilling with Schlumberger have dramatically changed the economics of oil and gas extraction. The change in oil economics is so profound that the cost structure of hydrocarbon fuels will reverberate through the global energy market and impact pricing of renewables energies and investment decisions. So profound are these changes that the US has surpassed Saudi Arabia and emerged as the world’s largest oil producer.
With the price of oil falling as a result of large production gains in US oil production. The price of oil is may fall below $40 per barrel according to an article in Barron’s The Case for $35 a barrel Oil suggesting further oil price declines are possible.
Perspective on Global Oil Consumption – Possible Plateau for Oil Consumption?
Global oil demand grew 0.6% in 2012 and over the last ten years oil consumption grew at a compounded annual growth rate (CAGR) of 1.3%. With near term oil demand at a lower level then the trend for the past ten years suggests the pace in oil consumption is slowing.
According to the Energy Information Administration (EIA), EIA the trend in oil consumption is pointing towards slower if not anemic growth. In the two largest areas, the US and Europe, demand is for oil is declining. While the increasing demand for oil in China and India is significant, the rate of growth is slower.
Figure 1 Global Oil Demand 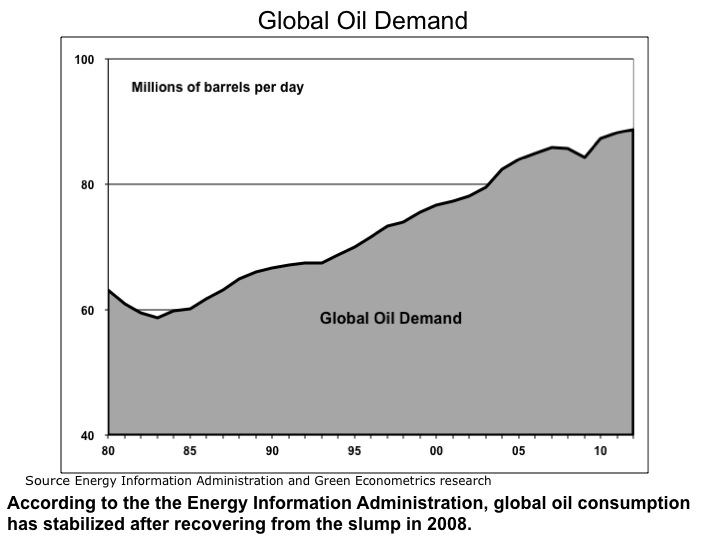
In the US, oil demand declined 2.1% in 2012 and over the last ten years oil consumption is down 0.6%. The oil consumption trend in the US suggests the decline maybe more structural, particularly as vehicle fuel efficiency is improving and high oil prices may change consumer-driving habits.
Figure 2 Oil Consumption – Major Countries 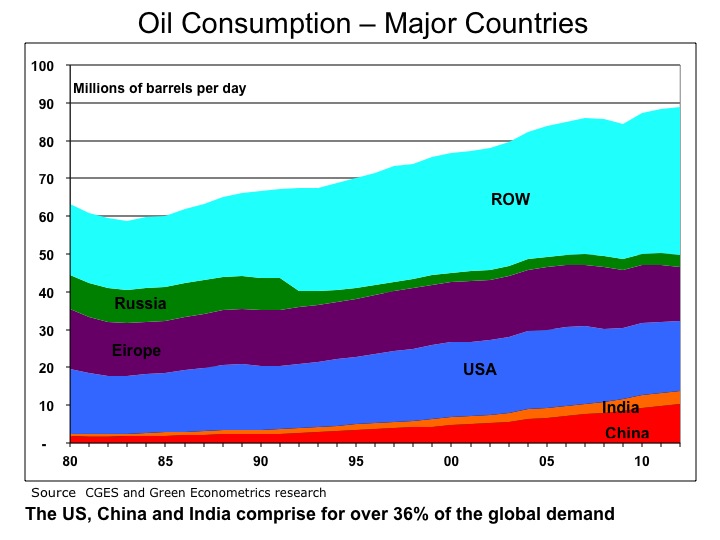
While the economic weakness in Europe and moderating growth in China, it is not surprising to see weakness in global oil demand. The trend is lower oil consumption might just be the result of short term economic weakness.
Europe and the US account for over 37% of the global demand for oil and that demand has declined over the last ten years. While the US was down 0.6%, demand for oil in Europe was down 1.1% in the last ten years.
Figure 3 Oil Consumption Perspective 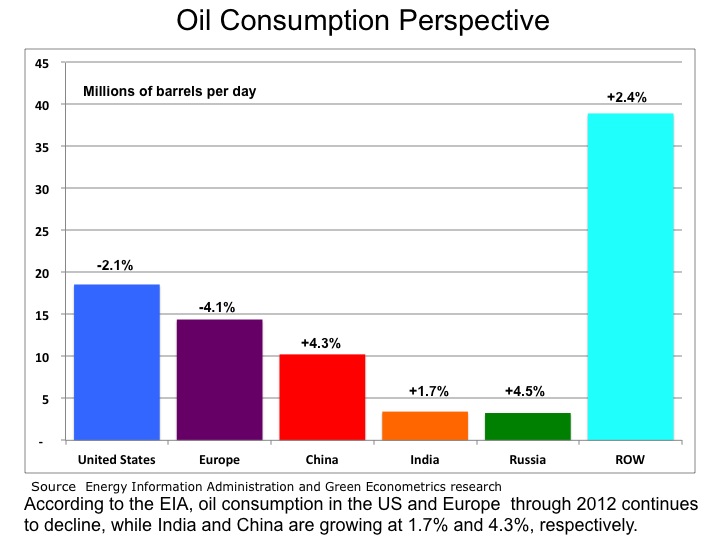
There is still strong demand for oil in China and India, but the rate of growth has slowed. China and India represent 15% of the global demand for oil. China and India have one-year oil demand growth rates below their respective ten-year rates.
Figure 4 Oil Consumption Trends 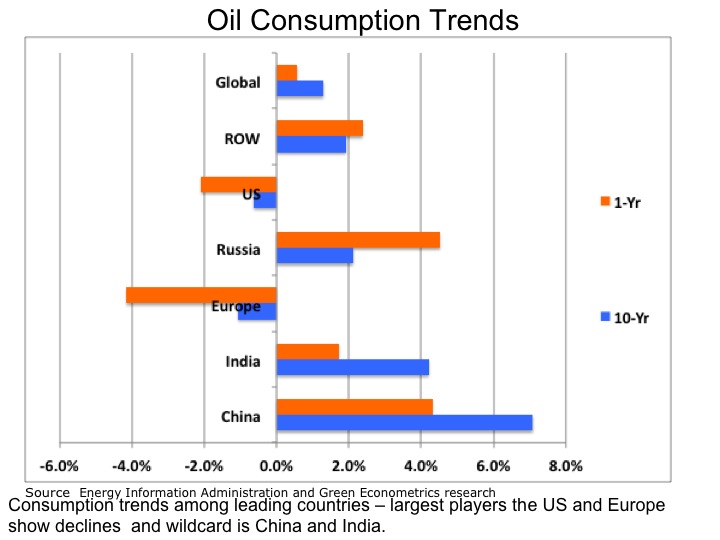
The bottom line is that is demand for oil has slowed and it maybe at a point where oil prices may soon reflect slowing demand.
Update on Oil Consumption
The latest data on oil consumption suggest the dip in consumption that appeared in 2008 after the global financial crisis quickly reversed. The contraction in oil has now turned to expansion with consumption up 4% y/y globally.
According to the latest reported information from the Energy Information Administration (EIA), EIA oil consumption is up 4% for 2010 from 2009. The data oil consumption data suggests the global economy has recovered from the financial crisis and is translated into higher oil demand.
Figure 1 Global Oil Demand 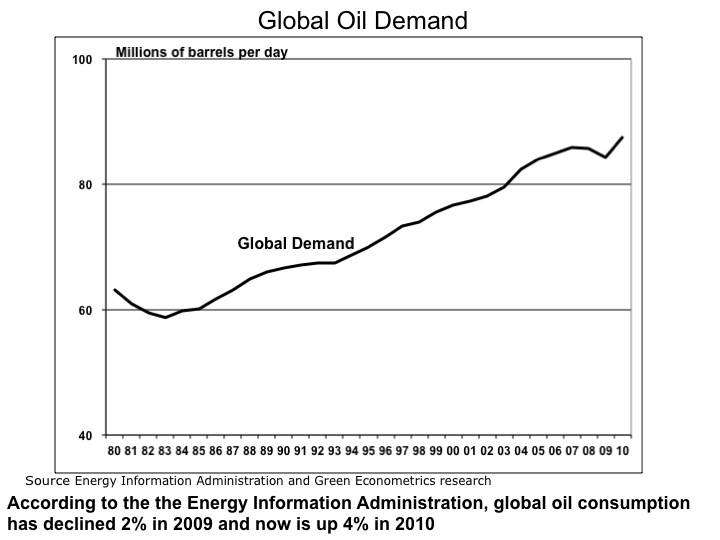
WE have seen economic contraction result into declines in oil demand before. Oil demand dropped in the 1979 to 1983 period with of a 10% decline per year. On a global basis, oil demand declined approximately 2% in 2009 from 2008, but is not up nearly 4% in 2010
In the US, oil demand dropped 5.7% in 2008 and 3.7% in 2009 with demand in 2010 increasing 3.8%. The oil consumption trend in the US suggests the decline in oil demand was cyclical as apposed to any structural changes in US consumer demand.
Figure 2 US China & India Oil Consumption 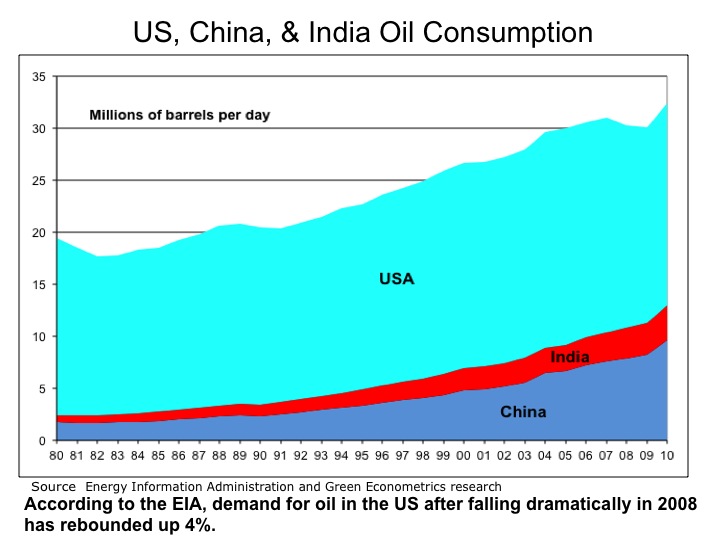
The real story is the growing demand for oil from China and India. According to data from The Centre for Global Energy Studies (CGES) , the demand for oil from China is up 100% from in the last ten years. China’s oil consumption rate has grown from 4.8 million barrels per day (MBPD) to 9.6 MBPD amounting to half of the total US consumption. In 2010 the growth in oil demand in China is up 17%.
The demand for oil in India is also increasing. Oil consumption in India is up 58% in the last ten years and up 8% in 2010.
Figure 3 China and India Oil Demand 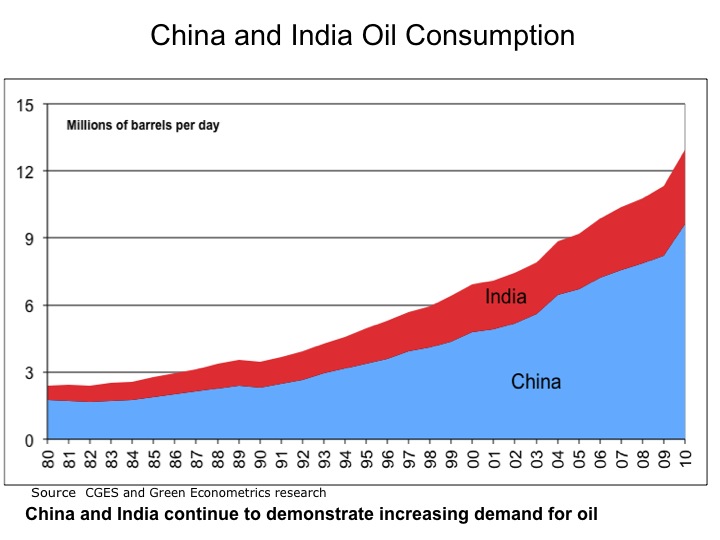
The bottom line is that is demand for oil continues to increase and we expect further increase in oil prices.
Infrastructure Investment: Electric Vehicles and Smart Grid
After several months in Silicon Valley three factors resonate clearly in the process of innovation: access to data, applied analytics, and time to insight. Innovative ideas and technology can just as easily be spawned in New Jersey or Milan as in Silicon Valley. Our focus is why investment into infrastructure that facilitates access to energy or commerce, is the critical factor in game changing events.
Investment onto infrastructure to support access to energy enabled New York City to gain prominence over Philadelphia and Boston as the largest economic center in the US. Access to energy can be traced back to 1829 when the first American steam locomotive in Honesdale, PA initiating the American Railroad to transport Anthracite coal mined in nearby Carbondale to a canal network ultimately linking to the Hudson River and New York City. See post Coal: Fueling the American Industrial Revolution to Today’s Electric
As a corollary, in demonstrating the importance of investing into infrastructure to support economic growth, this is the tale of two Southern cities. In the 1950’s, Memphis, TN and Atlanta, GA were roughly the same size. While Memphis enjoyed economic growth from its port on the Mississippi River, Atlanta was land locked. Atlanta strategically invested by focusing on the future of jet aircraft building the infrastructure for the largest airport in the US in 1961. Within 10 years Atlanta had double the population and economic growth of Memphis. Today Atlanta has an economy five times that of Memphis because of innovative thinking and investment into infrastructure of the future.
Figure 1 Infrastructure: Tale of Two Cities 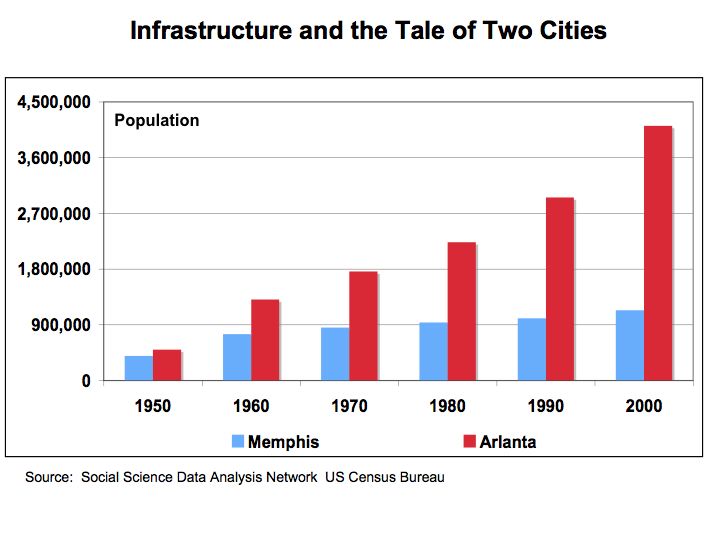
Source: Social Science Data Analysis Network
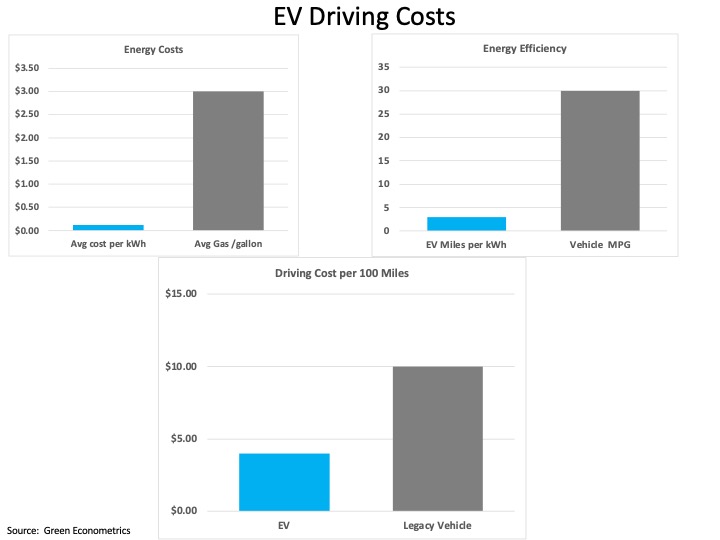
Electric vehicles (EV) and energy storage are perhaps the most important energy strategy second to renewable energy such as solar photovoltaic. The reason EV is so important to a national energy strategy is the fact that oil used for transportation accounts for more than twice the energy required to supply the entire electric needs of the US market. See the Green Econometrics post Energy Perspective The issue is formulating an effective energy strategy that embraces renewable energy and smart grid technologies.
Figure 2 US Electric Vehicles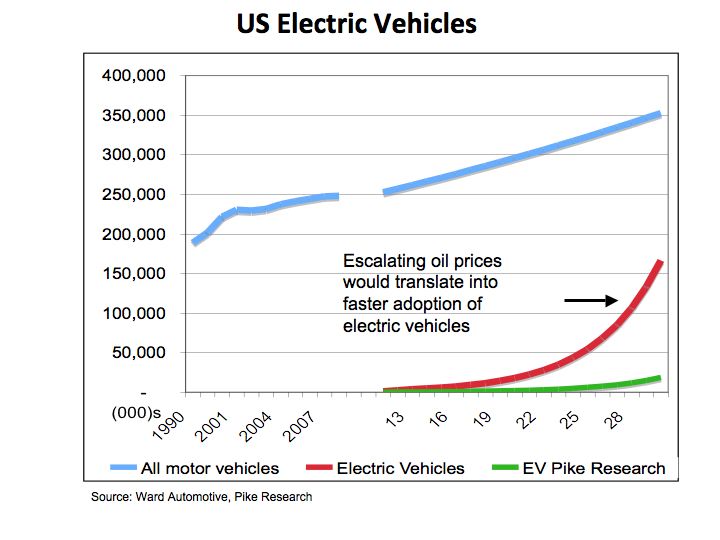
Source: Ward Automotive, Pike Research, Green Econometrics
Just how critical is infrastructure to supporting electric vehicles?
According to information from Tesla Motors’ registration filings with the SEC in June 2010, the charge time on the Tesla Roadster using a 240 volt, 40 amp outlet to full capacity takes approximately 7 hours. Assuming most drivers are in their vehicles for work five days a week and one day on the weekend, the electric energy consumption to charge the electric vehicle amounts to approximately 67 KWH a day and for a six-day per week charging, 20,966 KWH per EV per year.
According to the DOE Energy Information Administration, the average residential home consumes about 11,000 KWH a year. So the electric vehicle is roughly double is energy use of a typical home. Given capacity constraints in electric generation, tripling the electric energy use per house would more exacerbate our already tenuous energy situation,
Figure 3 Smart Grid is Critical for US Electric Vehicles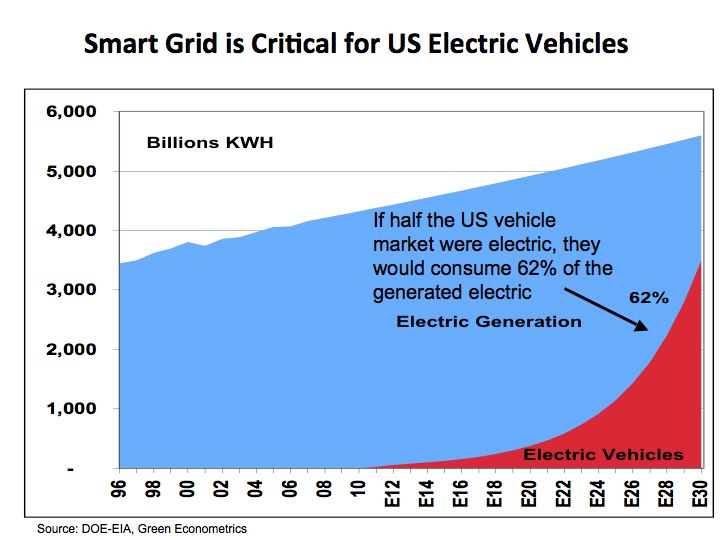
Source: EIA, Green Econometrics
To sustain economic growth and avoid dependence on foreign oil, electric vehicles provide a migration path towards energy independence. To support the adoption of electric vehicles, a tremendous investment in our electric infrastructure is required. A dramatic supply shock to oil could raise substantially the retail price of gas and thereby drive consumer towards EVs at an accelerated rate. If half the vehicles on the road were electric, our electric generating capacity would need to increase dramatically and outfitted with smart grid technologies to stabilize transmission.
The bottom line is vision and innovation require investment into infrastructure and in particular renewable energy generation like solar and wind and the grid to support intelligent transmission and distribution.
2010 Update on Oil Consumption and CO2 Levels?
The worst global economic recession in since the Great Depression seems to be abating. Given the severity of the financial crisis, it might serve to review what impact the recession has had on oil consumption. In addition, what impact did the decline in oil consumption have on atmospheric CO2 concentration levels?
Since 2006, global oil consumption declined by 1.1 million barrels per day (BPD) from 85.2 in 2006 to 84.0 in 2009. Oil consumption in the US declined 9% to 18.8 million from 20.7 million BPD in 2006. Europe experienced a decline of 7% over this same period with a drop of 16.5 million to 15.2 million BPD. However, over this same period, oil consumption in China and India increased 16% and 13%, respectively. This data was complied from the US Department of Energy Information Administration (EIA) and is displayed in the following charts.
To measure how significant the impact has been, the following charts provide some insights in evaluating how deteriorating world economies may have impacted oil consumption and secondly, whether reduced oil consumption has mitigated heightened CO2 levels.
Figure 1 Global Oil Consumption 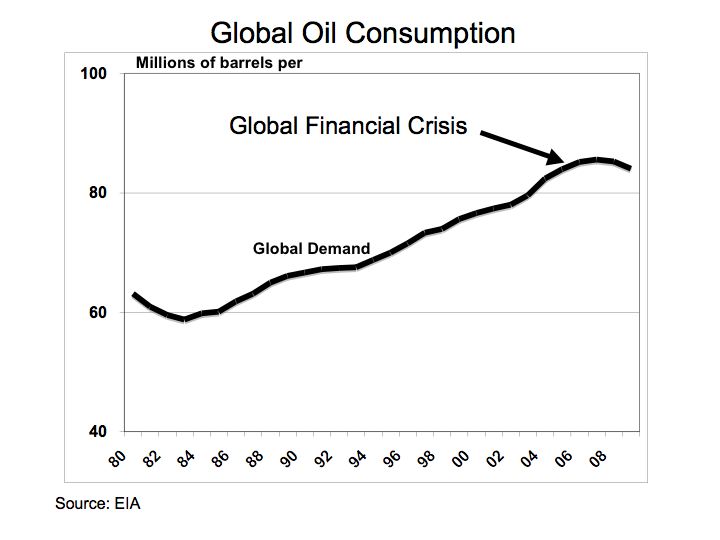
Source: EIA
From Figure 1, the impact of the global financial crisis is depicted with the decline in global oil consumption. When a comparison is applied to oil consumption between the US China, and India, the relative drop in oil consumption is less discernable.
Figure 2 US, China, and India 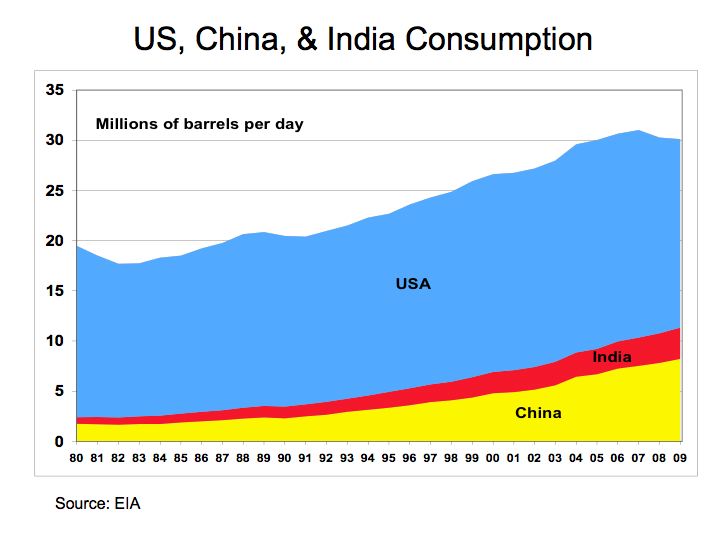
Source: EIA
Figure 2 provides a summary of oil consumption of the US, China, and India. A measurable decline in oil consumption can be seen, but only in the US market.
Figure 3 China and India 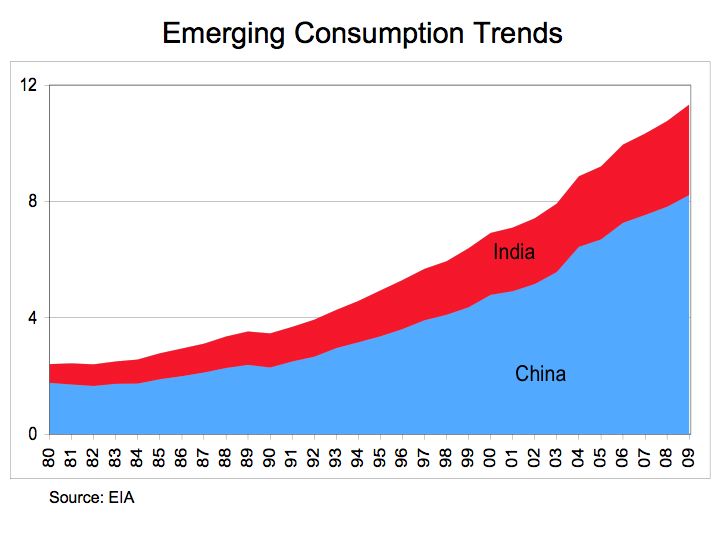
Source: EIA
Figure 3 demonstrates the steady and pronounced growth in oil consumption for China and India. Despite the global financial crisis, oil consumption significantly expands in China and India due to secular growth from rapid industrialization in both countries. When measured with respect to the European market, China and India have grown from 15% of the oil consumption rate of Europe in 1980 to over 74% of the consumption level in 2010.
Figure 4 CO2 Levels 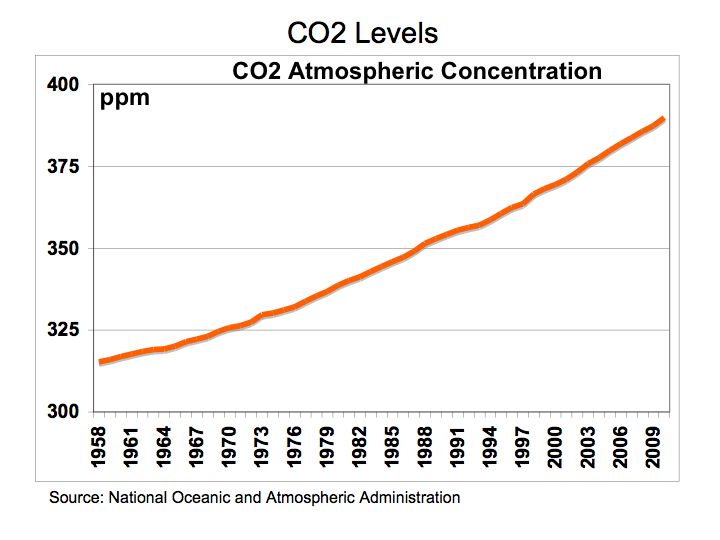
Source: NOAA
With the decline in global oil consumption, perhaps a positive benefit would be a fall in CO2 levels. The atmospheric CO2 readings in part per million (PPM) where taken from the National Oceanic and Atmospheric Administration (NOAA) from the Mauna Loa CO2 Levels monthly measurements. Figure 4 illustrates the average annual atmospheric CO2 concentration readings in Mauna Loa, Hawaii from 1980 through 2010.
The bottom line is even while global oil consumption declined during the recession, growth in China and India remained unabated and subsequently, CO2 concentrations in the atmosphere continue at elevated levels.
In memory of Jamie Kotula – loved by family, friends, teammates, and school.
Should we be Concerned over Elevated CO2 levels?
With the oppressive heat and appalling humidity along the Eastern Seaboard, one considers the possibility of climate change and the impact of that greenhouse gases may have on our environment. Without developing statistical regression models to gleam any semblance of understating of carbon dioxide’s impact on climate change, let’s just look at some charts that illustrate the changes of CO2 levels though history.
While industry experts and scientist debate whether elevated CO2 levels have an impact on climate change, the scientific data taken from ice core samples strongly suggests CO2 levels have remained in a range of 180-to-299 parts per million (PPM) for the last four-hounded thousand years. Scientists have developed models to suggest that rising CO2 levels contributes to global warning which are subsequently followed by dramatic climate changes that lead to periods of rapid cooling – the ice ages.
Scientific theories suggest that rising global temperatures melts the Polar ice which allows substantial amounts of fresh water to enter the oceans. The fresh water disrupts the ocean currents that are responsible for establishing a nation’s climate. As oceans warm near the equator, the warmer water travels towards each of the Polar areas. The cooler water near the Polar areas sinks and travels towards the equator. These ocean currents allows for stable climates. The issue is that fresh water is less dense because it is not salty like seawater. Therefore, the fresh water does not sink like the cold salinated seawater thereby disrupting the normal flow of the ocean currents.
Figure 1 CO2 Ice Core Data – illustrates the level of CO2 over the last four-hounded thousand years. The Vostok Ice Core CO2 data was compiled by Laboratoire de Glaciologie et de Geophysique de l’Environnement.
Ice Core Data
Figure 1 CO2 Levels – Vostok Ice Core CO2 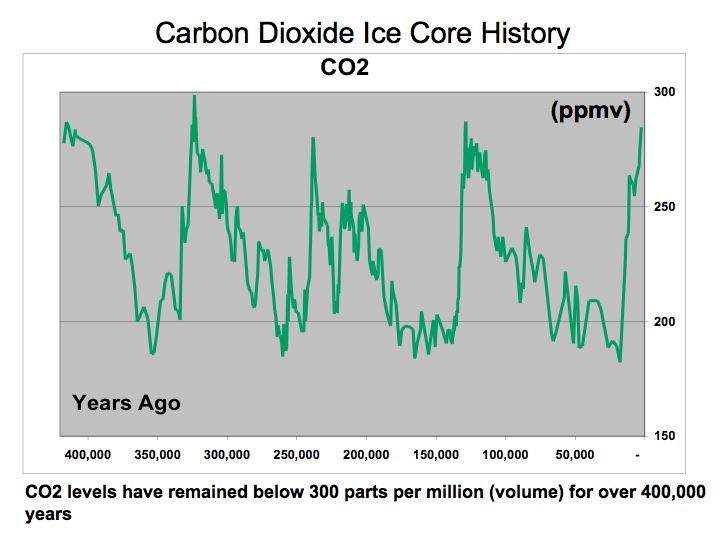
Source: Laboratoire de Glaciologie et de Geophysique de l’Environnement
If this Ice Core CO2 data is correct, then the current data on atmospheric CO2 levels is quite profound. CO2 data is complied by the National Oceanic and Atmospheric Administration NOAA at the Mauna Loa Observatory in Hawaii. The latest trend indicates CO2 levels for June 2010 are at a mean of 392 ppm versus 339 in June 1980 and 317 in 1960. Clearly these CO2 levels are elevated. The question is what is the impact on our environment.
Aside from the catastrophe in the Gulf of Mexico and the dire need to find an alternative to our dependence on oil, should we not accelerate our efforts to find an alternative energy solution and as a way to mitigate the impact of CO2 on our environment? Maybe investment into alternative energy could help solve multiple problems.
Figure 2 Mauna Loa CO2 Readings 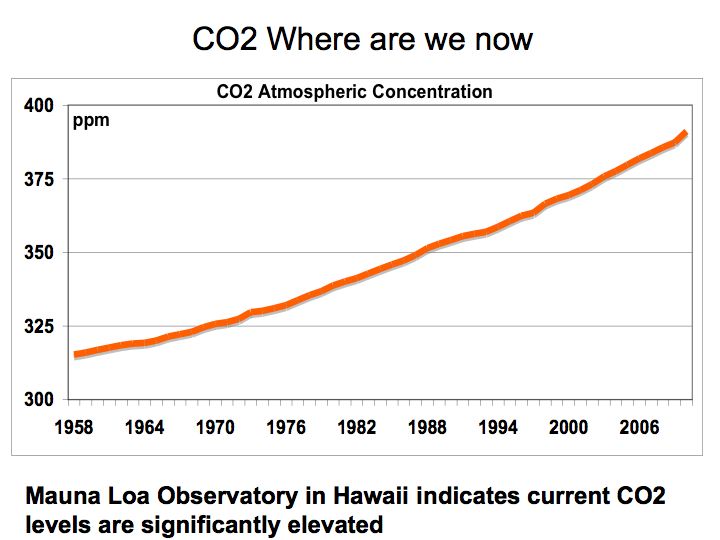
Source: Source data published by the National Oceanic and Atmospheric Administration (NOAA)
The bottom line is that we need to consider the possibility that elevated CO2 levels in our atmosphere could potentially have a detrimental impact on our climate. In any event, limiting our dependence on fossil fuels, the main contributor to CO2, should be paramount. Let us not forget oil is supply-constrained – there are no readily available substitutes aside from electric vehicles, and without a strategy to embrace renewable energy, supply disruptions will have a painful impact on our economy, national security, and environment.
Energy Perspective
After reviewing oil data from the Energy Information Administration (EIA), Global Petroleum Consumption , it may be helpful to put energy consumption into perspective. Most of us are quite familiar with alternative energy such as solar and wind, but the reality is, even if solar and wind could supply all of electric energy needs, the majority of our energy needs is still predicated on access to oil.
While industry experts and scientist debate whether more drilling will ameliorate the energy challenge we face, let’s look at a couple of data points. Figure 1 US Oil Field Oil Production and Drilling Rigs – illustrates that higher drilling activity as measured by Baker Hughes Rig Count data does not necessarily correlate to more oil production as measured by US Oil Field Production by the EIA. Higher drilling activity does not produce more oil.
Figure 1 US Oil Field Production and Drilling Rigs 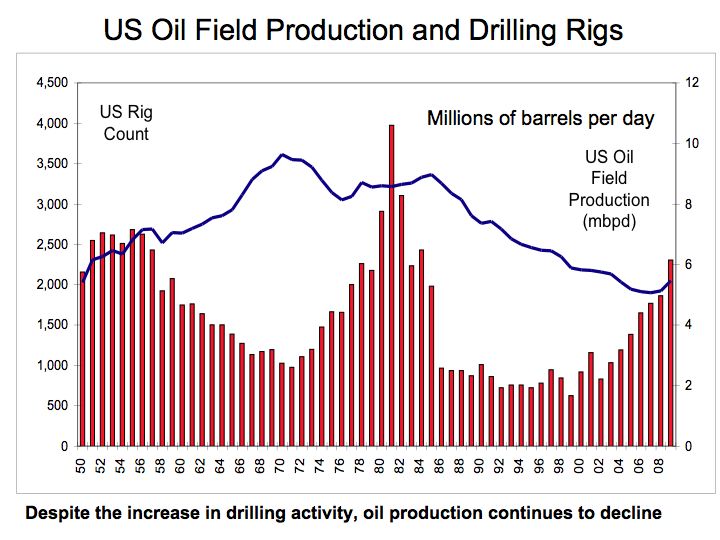
Source: Energy Information Administration and Baker Hughes research
Despite the large investment in drilling rigs that more than doubled from 1,475 in 1974 to over 3,100 in 1982, US oil production remained relatively flat. Moreover, even the most recent drilling expansion activity that again more than doubled from 1,032 rigs in 2003 to over 2,300 rigs in 2009, resulted in relatively flat oil production, suggesting that on the margin unit oil production per drilling rig was declining. Perhaps even more disturbing is that the most recent drilling activity in the US was accomplished through extensive use of technology. Seismic imaging technology is being used to better locate oil deposits and horizontal drilling technologies are employed to more efficiently extract the oil, yet oil production still lags historic levels. While on the margin, newly announced offshore drilling could add to domestic oil production, extraction costs of oil will continue to rise adding to further oil price increases.
However, what is most profound is our dependence on oil for most of our energy needs similar to how wood was used for fuel construction material during the 1300’s and 1600’s. If we translate energy consumption into equivalent measuring units such as kilowatt-hours, we can compare and rank energy consumption. Although electricity is captured through consumption of several fuels most notably coal, a comparison of energy usage between oil and electric provides an interesting perspective.
Figure 2 Energy Perspective – provides a simple comparison of the consumption of oil and electricity measured in gigawatt-hours (one million kilowatt hours). A barrel of oil is equivalent to approximately 5.79 million BTUs or 1,699 KWH and the US consumed approximately 19.5 million barrels per day equating to 12 million gigawatt-hours a year. The US uses 4 million gigawatt-hours of electric energy annually. The critical point is that even if solar and wind supplied all of our electric energy needs, it would still only comprise 30% of our total energy needs. Therefore, without an energy strategy that facilitates migration towards a substitute for oil, particularly for transportation, we are missing the boat.
Figure 2 Energy Perspective 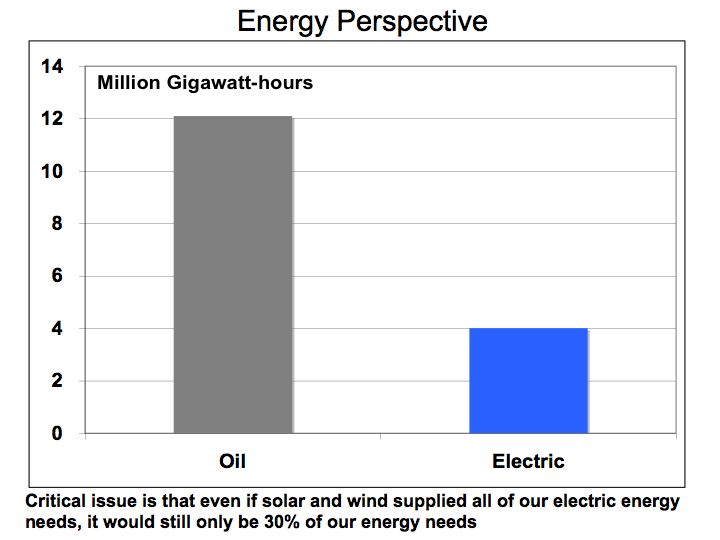
Source: Energy Information Administration and Green Econometrics research
It’s not all doom and gloom. Technologies are advancing, economies of scale are driving costs lower, and the economics for new approaches to transportation are improving. From hybrids and electric vehicles benefiting from advances lithium-ion batteries to hydrogen fuel cell vehicles getting 600 miles on a tank of fuel. These advanced technologies could mitigate our addiction to oil, however, without formulating an energy strategy directing investments towards optimizing the economics, energy efficiency, environment, and technology, we may miss the opportunity.
The bottom line is that oil is supply-constrained as there are no readily available substitutes, and therefore, without a means to rapidly expand production; supply disruptions could have a pernicious and painful impact on our economy, national security, and welfare.
Oil Consumption Impacted More by Price than Deteriorating Economic Conditions
The fall in oil consumption was most dramatic following the escalating price of crude oil to $145.16 per barrel on July 14, 2008 then at any other point over the last several years. Price elasticity, a key concept in Economics 101, which measures the impact of price change to changes in unit volume sold, is helpful in determining which products have readily available substitutes or which, like oil are inelastic with no real substitutes.
As illustrated by Benjamin Graham and David Dodd in their book Security Analysis, 1940 edition, during the 1930’s the economy had a dramatic impact on spending and consumption particularly on discretionary items such as travel. In one illustration, the change in demand was most pronounced in railroad revenues where tickets purchased for railroad travel, declined 51% from 1929 to 1993 as measured by gross receipts for the railroad industry. Over this same period, spending on the consumer staples (inelastic demand), such as electricity encountered a decline of only 9%.
While almost everyone would agree that the current economic climate is one of the most challenging since the 1930’s, a quick review of oil consumption over the last several years illustrates that demand has not significantly contracted, suggesting driving habits only changed when prices escalated to over $100 per barrel. Oil consumption dropped only 4.9% from January 2008 through January 2009.
Figure 1 Oil Consumption 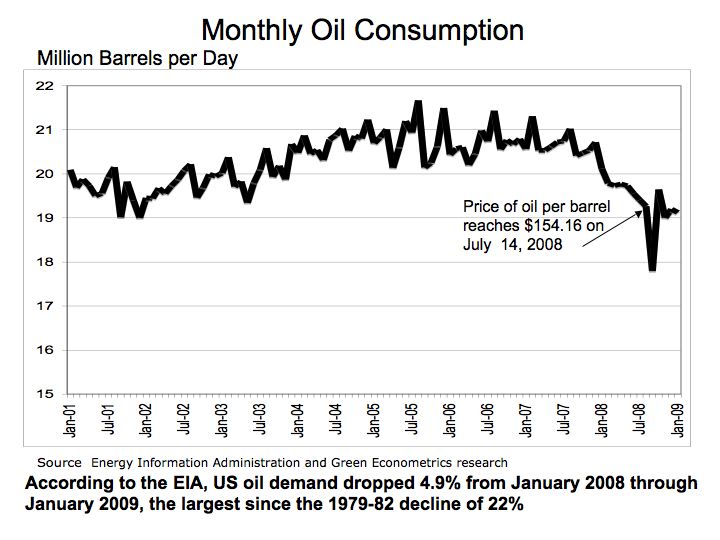
As seen from Figure 1, the sharp drop in oil consumption in September 2008 of 8.3% appears as an aberration when measured over the whole year. The fact there are no real substitutes for oil in the transportation industry illustrates two important points: 1) structural changes to driving patterns are required to see appreciable changes to oil consumption and 2) how vulnerable we are as a nation with no readily available substitutes for oil in the transportation systems.
Figure 2 Oil Demand in China and India 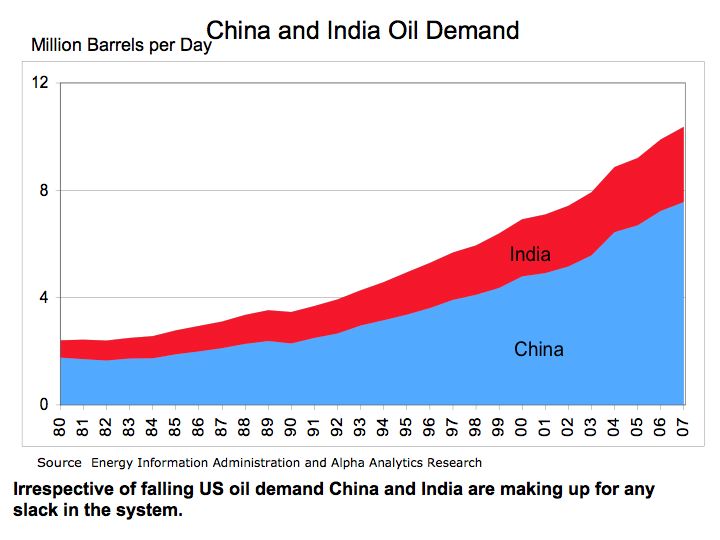
With China and India undergoing significant structural changes as they rapidly migrate towards motor vehicles for transportation suggests the demand for oil should continue to grow relatively unabated. Until the price of oil climbs back over $100 per barrel, we will not see the structural changes necessary to develop alternatives to oil in the transportation market.
The bottom line: energy and in particular, oil has not experienced a dramatic drop in demand during 2008 suggesting driving patterns were influenced more by the price of oil then the struggling economy. We must begin to shift emphasis to alternative energies such as solar as well as hybrids and electric vehicles.
Dramatic Drop in Oil Consumption – What’s the Implication?
America’s appetite for oil declined sharply as the economy weakened over 2008. According to the latest reported information from the Energy Information Administration (EIA), Monthly Oil Consumption oil consumption declined 13% y/y from September 2007 through September 2008.
Historically, the US has seen this type of demand erosion before. From 1979 to 1983, oil demand in the US declined 28% with annualized rate of a 10% decline per year. Over this same period, oil prices actual rose despite the fall in demand. Oil prices by barrel (42 US gallons) rose from $3.60 in 1972 to $25.10 in 1979. In 1983, oil prices increased to $29.08 a barrel, representing an increase of nearly 16% from 1979.
Economics would normally dictate that as demand declines so should prices. However, the geopolitical events and oil supply disruption maintained higher oil prices despite the subsequent decline in oil demand. It was not until structural changes in energy conservation and driving patterns were felt before leading to a fall in oil prices during the 1980’s.
Figure 1 Monthly Oil Consumption 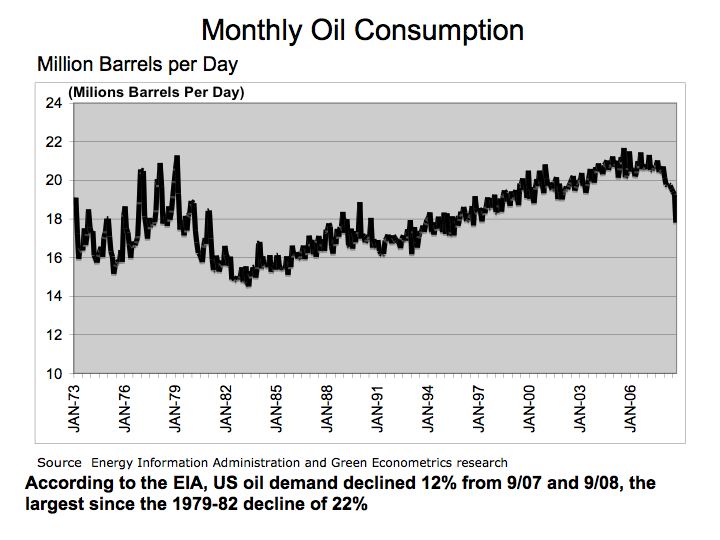
As illustrated in Figure 1, the precipitous fall in oil demand over the last half of 2008 is quite dramatic in comparison to historical price data. The large fluctuations in monthly oil consumption during the 70’s and 80’s, were primarily due to supply disruptions. The higher oil prices resulting from supply disruptions over this period led to structural changes in the energy market that later resulted in falling oil prices.
Figure 2 Oil Prices 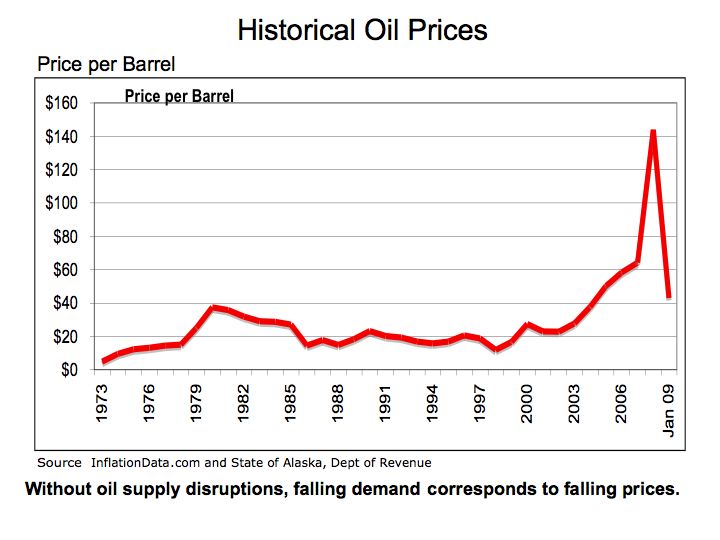
While falling demand and rising oil prices during the 70’s and 80’s is an anomaly, we see from Figure 2, that currently there is significant correlation between falling oil demand and a subsequent decline in the price of oil. Excluding the peak oil price in July 2008, oil declined 33% from the average price per barrel of $64 in 2007.
Perhaps the precipitous fall in oil prices can explain why demand for oil on a global basis has not declined as dramatically as in the US. As we can see from Figure 3, the drop in US oil consumption is matched with a slight increase in demand in Europe and only a moderate decline in Japan.
Figure 3 Global Oil Demand 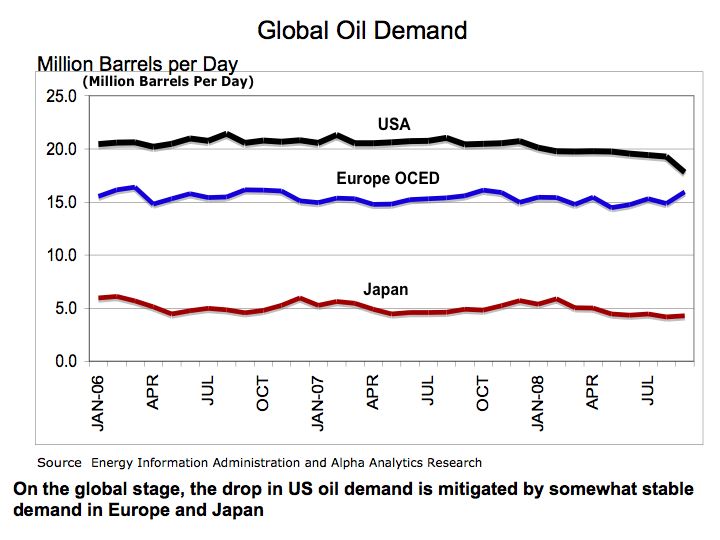
The bottom line is the financial shock that hit global markets is dramatically impacting consumption. As a recovery inevitably ensues, demand for oil will increase and so will oil prices. Let’s not be complacent with hydrocarbon fuels. Falling energy prices act as a disincentive for investment into alternative energies.
A Historical Perspective on Energy Prices and Economic Challenges
To understand current energy prices it may serve us to examine historical energy prices. Our theme is energy economics and specifically that energy prices follow the laws of supply and demand to set pricing.
There are some interesting perspectives on historical energy prices from several books including Security Analysis, 1940 edition by Benjamin Graham and David Dodd, The Great Wave, by David Hackett Fischer; and The Industrial Revolution in World History, by Peter Stearns. These books provide extensive data on pricing, industry revenues, and the framework that energy and technology serve in the economics of the industrial world.
Figure 1 Historical Energy Prices 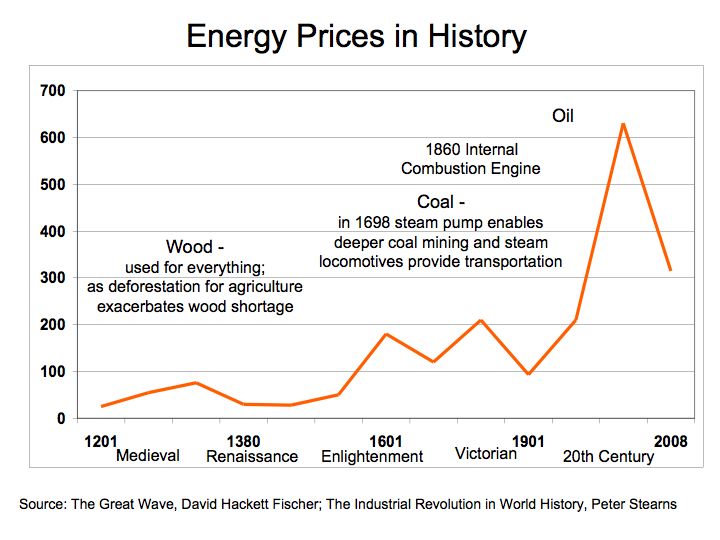
With the risk of oversimplification, our first figure shows there have been four distinct energy prices waves that have rippled through history. The scarcity of wood that was used for building homes, heating, and tools became increasing scarce as deforestation spread through Europe in the 1300s and followed again in the 1600’s. Coal prices rose rapidly with the War of 1812 and the Napoleonic Wars. Oil prices peaked in 1982 and to an all time high of $145.16 on July 14, 2008.
Figure 2 Medieval Wood Prices 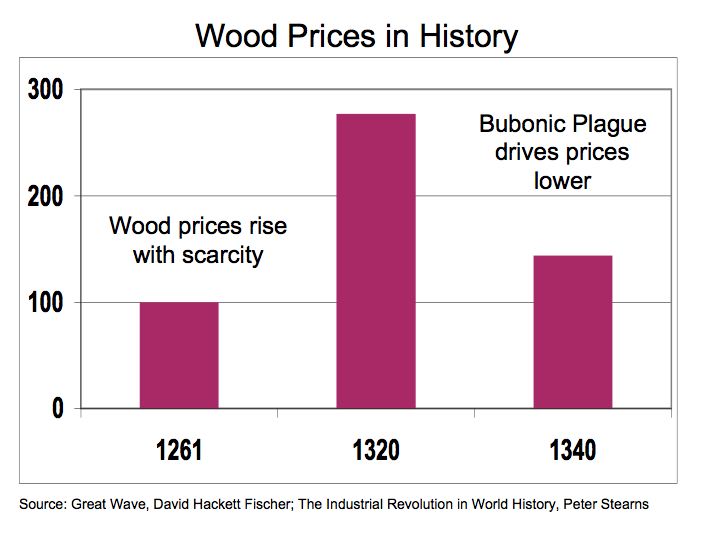
During the Medieval period in world history wood prices increased nearly threefold according to David Fischer in the The Great Wave. Wood prices rose with scarcity and peaked in 1320 as impact of the Bubonic Plague began to kill a quarter of Europe’s’ population. Twenty years from its peak in 1320, wood prices declined by 48% as the Bubonic Plague reduces the population and in turn, lowering the demand for wood.
Figure 3 Wood Prices 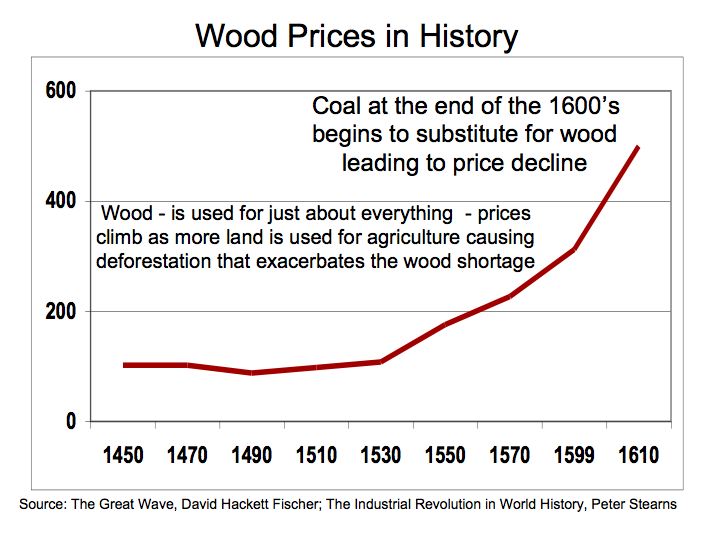
Figure 3. Illustrates the rapid rise in the demand for wood as the growing world populations benefited advances in science and agriculture from the Renaissance period. Wood is used for just about everything and prices climb as more land is used for agriculture leading to deforestation exacerbating the wood shortage. As demand for wood increases, prices subsequently follow. By the end of the 1600’s, coal begins to substitute for wood as an energy alternative.
With advances in technology came improvements in coal mining and transportation that allowed coal to substitute for wood as an energy source. With the invention such as Thomas Newcomen’s steam, powered pump in 1712 that facilitated coal mining and James Watt’s steam engine in 1765 that lead to advances in transportation including railroads and machinery, coal grew in importance as an energy source. These advances in technology enabled greater supplies of coal to enter the market which lead to declines in energy prices.
Figure 4 Coal Prices 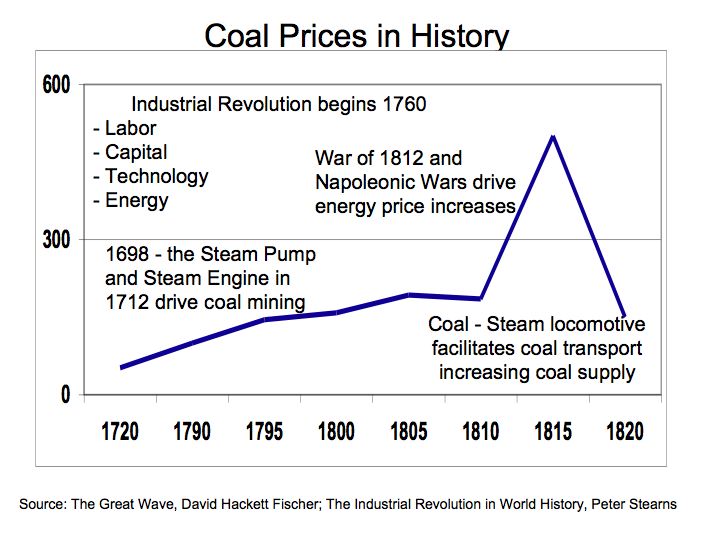
We can gleam from Figure 4 that coal prices peaked in 1810-to-1815 coinciding with the War of 1812 and the Napoleonic Wars. The technological advances in mining and transportations fostered the development of an infrastructure to support the coal industry. The price of coal rose as wars ragging in Europe and the US, increased the demand for materials and supplies such as coal. However, as the wars came to an end, the abundant supplies of coal allowed prices to fall keeping energy prices low.
Oil entered the picture with the drilling of the first oil well in northwestern Pennsylvania in 1859 and the Internal Combustion Engine in 1860 that facilitated the development of the oil industry.
As oil emerged to become the dominant fuel of the 20th Century, it’s only recently that we face supply shortages. To better understand the dynamics of energy pricing in the face of changing demand, a review of spending on railroads and electricity may serve as a surrogate for discretionary and consumer stable spending patterns.
Figure 5 Industry Segment Revenues 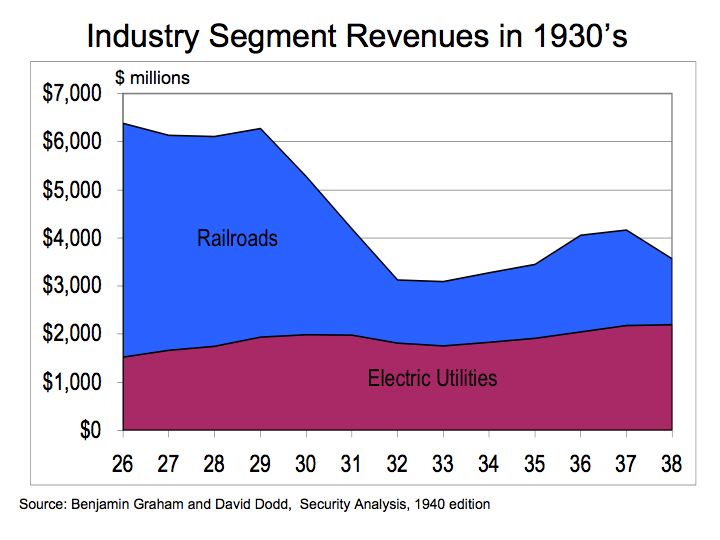
Figure 5 illustrates changes in the aggregate revenues of railroads in comparison to electric utilizes during the Great Depression. Copious notes taken by Graham and Dodd for their book Security Analysis help to demonstrate the economic laws of supply and demand.
The change in demand was most pronounced in railroad revenues. Expenditures on railroads, the more discretionary of the two industries, declined 51% from 1929 to 1993 as measured by gross receipts for the railroad industry. Over this same period, spending on the consumer stable, electricity only encountered a decline of 9%. In economic terms, railroads demonstrate greater demand elasticity meaning there is greater change in demand at prices change or this period, disposable income. While there is some discretionary portion of our spending associated with oil, a large portion of spending on oil is out of necessity. Therefore, even during times of great economic distress, the propensity for energy consumption is not eradicated entirely.
The bottom line: Energy pricing will continue to be dictated by supply and demand. Hydrocarbon fuels such as oil are finite in nature and therefore, without definitive strategies to cultivate alternative energy resources we will remain hostage to the vagaries in energy prices..
Vote the Economy by Voting for Energy
Access to energy was instrumental fueling the Industrial Revolution. Over the last 200 years, industrial nations have migrated from wood to coal and now to oil as a source of energy. During the 1700’s, wood was used for just about everything from fuel to constructing houses and building wagons and even tools. As demand for wood increased, the cost of wood rose as deforestation led to the scarcity. The scarcity of wood resulted in deteriorating economics.
It was the availability and access to coal that enabled the growth of Industrial Revolution by providing accessible energy. The Industrial Revolution was predicated upon the availability of Labor, Technology, Capital, and Energy. Scarcity of any of these inputs could undermine economic growth, as was the case with capital during the Great Depression of the 1930’s and the Energy Shock of the 1970’s.
Oil, driven by rapid growth in automobile usage in the U.S, has replaced coal as the main energy fuel. According to the Energy Information Administration (EIA), the 70% of oil consumption in the U.S. is for transportation .
Figure 1 US Oil Imports 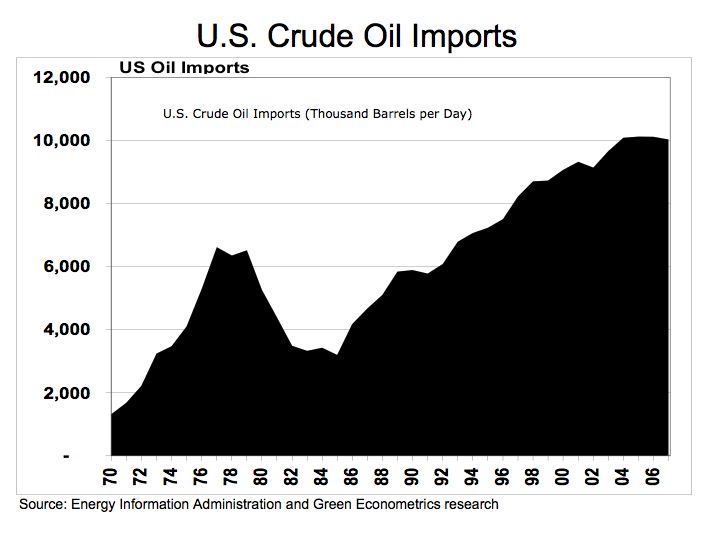
Figure 1 illustrates US historical oil imports, as measured by the Energy Information Administration in U.S. Crude Oil Field Production (Thousand Barrels per Day) that dates back to 1970. The EIA provides oil import data dating back to 1910. To estimate the amount of money the US spends on oil imports every year, we can use the data from the State of Alaska Department of Revenue, which provides historical data on the price of oil an derive an average yearly figure.
Figure 2 US Oil Import Spending 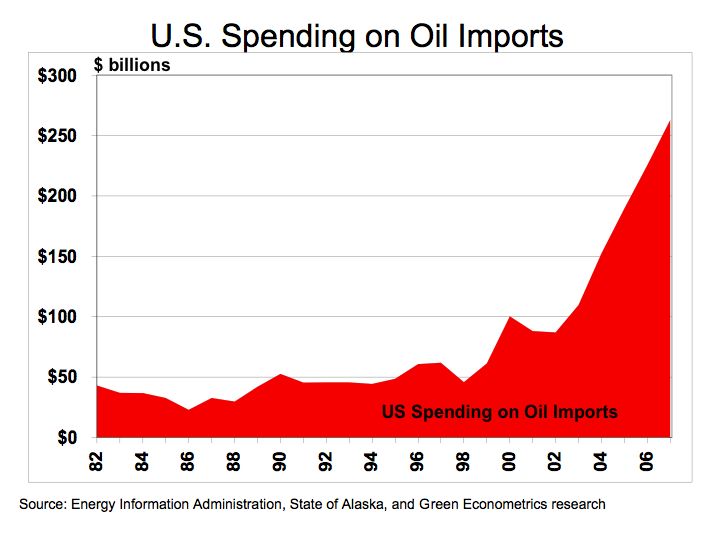
Figure 2. appears quite staggering given the amount of money we send to oil producing countries. The US is spending hundreds of billions to import oil. According to the EIA, the US imported an average of 10,031,000 barrels per day equating to $263 billion in imported oil during 2007 when the State of Alaska measured the yearly average spot price for a barrel of oil at $72.
According to Solarbuzz, Germany leads the world in solar photovoltaic (PV) installations with 47% of the market while China increased its market share of PV production from 20% to 35%. The US accounts for 8% of the world solar PV installations. Solarbuzz indicates the global solar PV industry was $17 billion in 2007 and the average cost of solar electricity is $0.2141 per KWH. If a portion of our $260 billion sent to oil producing countries were to be invested into solar energy, perhaps the US would not lag the world in alternative energy.
The bottom line is that the money spent on importing oil has a deleterious impact on our economy and continues our dependence on hydrocarbon fuels producing carbon and other harmful byproducts that negatively impact our climate and health of our children. The longer we are dependent on oil, the longer our economy and environment suffer. Use your vote for alternative energy and not drill baby drill.
Energy Storage – the Key to Alternative Energies
Energy storage enables the electric generated though solar photovoltaic devices or wind turbines to be used when it’s dark, cloudy, or calm. As Nathan Lewis, Professor of Chemistry, Division of Chemistry and Chemical Engineering Lewis Group at California Institute of Technology, framed it, energy storage is integral in facilitating the development of alternative energy programs.
While hydrogen fuel cells offer future promise to our energy storage needs, battery technologies could provide some immediate results. As with all technologies there are tradeoffs.
There are several competing approaches to battery development. Among these approaches include the lead acid, nickel metal hydride, and lithium-ion cells.
Lead acid: batteries are the oldest approach and are typically found under the hood of your car or truck. Nickel metal hydride batteries have been around for more than 25 years and are used in hybrid electric vehicles such as the Toyota Prius. Lithium-ion cells have been on the market since 1991 and are used extensively in cellular phones, laptop computers, and digital cameras.
There are several issues in dealing with batteries such as environmental, economic, power, safety, and useful life. Lithium-ion cells possess many advantages, but incidences such as laptop computers erupting into flames, leaves many concerns for applicability in motor vehicles. Despite the setbacks, lithium-ion technology could provide solutions to the electric vehicle.
Why is this battery technology important? Solving the energy needs of the motor vehicle has profound implications in solving our energy needs. Nearly 70% of our oil consumption is direct towards transportation essentially motor vehicles. Without a dedicated strategy to address the transportation market and specifically the automobile, our progress towards energy independence is an illusion.
There are several issues with the nickel metal hydride batteries currently used in hybrid electric vehicles. Nickel metal hydride batteries are heavy, bulky, require large storage space in the vehicle, and don’t offer great acceleration. Lithium-ion offer power, size, and weight advantages over nickel metal hydride batteries, and numerous companies are working to improve performance and ameliorate the negative connotations associated with flaming laptops.
One of the basic concepts in dealing with batteries is the measure of battery energy versus battery power. The amount of battery energy refers to endurance, how long will the battery last and is often measured in ampere-hours or watt-hours per kilogram of battery weight. The amount of power refers to the energy draw and is akin to delivering acceleration in an electric vehicle.
The following figure illustrates the measurement of battery power and energy. Lithium-ion batteries are differentiated in their ability to bridge the power and energy tradeoff.
Figure 1 Battery Power vs Energy
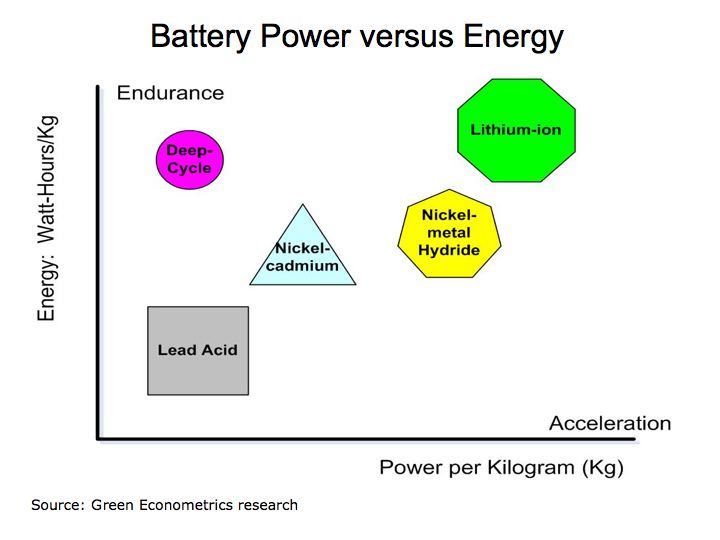
For home renewable energy projects such as solar or wind energy deployment, it is often recommended that a deep-cycle battery be used. Deep cycle batteries are able to draw down 70%-80% of their full power, offering longer energy life than a typical lead acid battery. In addition, newer materials such as Gel batteries and absorbed glass mat (AGM) that are sealed, maintenance free, and can’t spill, and therefore, are less hazardous. For a tutorial on home use batteries visit
BatteryStuff.com
An interesting perspective on battery design is presented Energy vs. Power by Jim McDowall. For a primer on how batteries work visit presented Battery Power The premise is that there are tradeoffs between designing a battery for high power versus high energy.
Research conducted at Stanford University suggest the battery life of lithium-ion batteries could be extended through the use of Nano-technology. The bottom line: energy storage is paramount to sustaining the development of alternative energies and battery technologies play a critical role in energy storage and further expanding the role of alternative energies.