Infrastructure Investment: Electric Vehicles and Smart Grid

After several months in Silicon Valley three factors resonate clearly in the process of innovation: access to data, applied analytics, and time to insight. Innovative ideas and technology can just as easily be spawned in New Jersey or Milan as in Silicon Valley. Our focus is why investment into infrastructure that facilitates access to energy or commerce, is the critical factor in game changing events.

Investment onto infrastructure to support access to energy enabled New York City to gain prominence over Philadelphia and Boston as the largest economic center in the US. Access to energy can be traced back to 1829 when the first American steam locomotive in Honesdale, PA initiating the American Railroad to transport Anthracite coal mined in nearby Carbondale to a canal network ultimately linking to the Hudson River and New York City. See post Coal: Fueling the American Industrial Revolution to Today’s Electric

As a corollary, in demonstrating the importance of investing into infrastructure to support economic growth, this is the tale of two Southern cities. In the 1950’s, Memphis, TN and Atlanta, GA were roughly the same size. While Memphis enjoyed economic growth from its port on the Mississippi River, Atlanta was land locked. Atlanta strategically invested by focusing on the future of jet aircraft building the infrastructure for the largest airport in the US in 1961. Within 10 years Atlanta had double the population and economic growth of Memphis. Today Atlanta has an economy five times that of Memphis because of innovative thinking and investment into infrastructure of the future.

Figure 1 Infrastructure: Tale of Two Cities Infrastructure
Source: Social Science Data Analysis Network

Electric vehicles (EV) and energy storage are perhaps the most important energy strategy second to renewable energy such as solar photovoltaic. The reason EV is so important to a national energy strategy is the fact that oil used for transportation accounts for more than twice the energy required to supply the entire electric needs of the US market. See the Green Econometrics post Energy Perspective The issue is formulating an effective energy strategy that embraces renewable energy and smart grid technologies.

Figure 2 US Electric VehiclesElectric Vehicles
Source: Ward Automotive, Pike Research, Green Econometrics

Just how critical is infrastructure to supporting electric vehicles?

According to information from Tesla Motors’ registration filings with the SEC in June 2010, the charge time on the Tesla Roadster using a 240 volt, 40 amp outlet to full capacity takes approximately 7 hours. Assuming most drivers are in their vehicles for work five days a week and one day on the weekend, the electric energy consumption to charge the electric vehicle amounts to approximately 67 KWH a day and for a six-day per week charging, 20,966 KWH per EV per year.

According to the DOE Energy Information Administration, the average residential home consumes about 11,000 KWH a year. So the electric vehicle is roughly double is energy use of a typical home. Given capacity constraints in electric generation, tripling the electric energy use per house would more exacerbate our already tenuous energy situation,

Figure 3 Smart Grid is Critical for US Electric VehiclesSmart grid
Source: EIA, Green Econometrics

To sustain economic growth and avoid dependence on foreign oil, electric vehicles provide a migration path towards energy independence. To support the adoption of electric vehicles, a tremendous investment in our electric infrastructure is required. A dramatic supply shock to oil could raise substantially the retail price of gas and thereby drive consumer towards EVs at an accelerated rate. If half the vehicles on the road were electric, our electric generating capacity would need to increase dramatically and outfitted with smart grid technologies to stabilize transmission.

The bottom line is vision and innovation require investment into infrastructure and in particular renewable energy generation like solar and wind and the grid to support intelligent transmission and distribution.

2010 Update on Oil Consumption and CO2 Levels?

The worst global economic recession in since the Great Depression seems to be abating. Given the severity of the financial crisis, it might serve to review what impact the recession has had on oil consumption. In addition, what impact did the decline in oil consumption have on atmospheric CO2 concentration levels?

Since 2006, global oil consumption declined by 1.1 million barrels per day (BPD) from 85.2 in 2006 to 84.0 in 2009. Oil consumption in the US declined 9% to 18.8 million from 20.7 million BPD in 2006. Europe experienced a decline of 7% over this same period with a drop of 16.5 million to 15.2 million BPD. However, over this same period, oil consumption in China and India increased 16% and 13%, respectively. This data was complied from the US Department of Energy Information Administration (EIA) and is displayed in the following charts.

To measure how significant the impact has been, the following charts provide some insights in evaluating how deteriorating world economies may have impacted oil consumption and secondly, whether reduced oil consumption has mitigated heightened CO2 levels.

Figure 1 Global Oil Consumption Global Oil
Source: EIA

From Figure 1, the impact of the global financial crisis is depicted with the decline in global oil consumption. When a comparison is applied to oil consumption between the US China, and India, the relative drop in oil consumption is less discernable.

Figure 2 US, China, and India US China & India
Source: EIA

Figure 2 provides a summary of oil consumption of the US, China, and India. A measurable decline in oil consumption can be seen, but only in the US market.

Figure 3 China and India China and India
Source: EIA

Figure 3 demonstrates the steady and pronounced growth in oil consumption for China and India. Despite the global financial crisis, oil consumption significantly expands in China and India due to secular growth from rapid industrialization in both countries. When measured with respect to the European market, China and India have grown from 15% of the oil consumption rate of Europe in 1980 to over 74% of the consumption level in 2010.

Figure 4 CO2 Levels CO2
Source: NOAA

With the decline in global oil consumption, perhaps a positive benefit would be a fall in CO2 levels. The atmospheric CO2 readings in part per million (PPM) where taken from the National Oceanic and Atmospheric Administration (NOAA) from the Mauna Loa CO2 Levels monthly measurements. Figure 4 illustrates the average annual atmospheric CO2 concentration readings in Mauna Loa, Hawaii from 1980 through 2010.

The bottom line is even while global oil consumption declined during the recession, growth in China and India remained unabated and subsequently, CO2 concentrations in the atmosphere continue at elevated levels.

In memory of Jamie Kotula – loved by family, friends, teammates, and school.

Heating and Cooling – Does Insulation Pay?

Insulation is one of the most important factors in improving building energy efficiency. Heating, ventilation and cooling (HVAC) often accounts for more than half the energy expense of a building. Insulation helps to improve the energy efficiency of heating and cooling. Depending on the selected insulating material, the economic impact on heating costs can be quite dramatic.

To understand how insulation helps improve building heating and cooling, it’s helpful to review the dynamics of building heat loss as it applies to building materials and outside actual air temperatures.

To calculate the heating requirements for a building, the overall heat loss from a building can be derived as a function of the combined heat loss of transmission through the roof, walls, windows, doors, and floors, as well as heat loss caused by ventilation and air infiltration. In general, without getting too scientific, the heat loss from transmission through roof, walls, doors, and windows represents the largest impact and is primarily a function of the temperature difference between the inside and outside air and thermal conductance of he building material. For a more detailed review of building heat loss see Heat Loss.

The difference between inside and outside temperature plays a critical role in building heat loss. The first step is to understand heating and cooling requirements from weather data. Heating degree day (HDD) are a measure of energy demand required to heat a building. HDD is derived from the difference between the daily outside temperature observations and the ideal indoor air temperature, say 65 degrees Fahrenheit (18.30 Celsius). The heating requirements for a building in a specific location can be derived from the HDD data in conjunction with building factors such as insulation, windows, solar heat gain, and use. Air conditioning also has a similar metric and is defined as cooling degree day (CDD) and measures the amount of energy used to cool a building.

From the historical data on outside air temperature, an average heating and cooling degree day can be assigned to a specific region. To calculate degree days for both heating and cooling Daily Temperatures can be assessed by zip code to capture historical data on specific climate zones.

When it comes to selecting building materials and insulation, material suppliers often supply two measures – the R-value and C-value. A material’s R-value (thermal resistance) is the measure of its resistance to heat flow. The C-value (thermal conductance) is the reciprocal of thermal resistance and measures the ability of a piece of material to transfer heat per unit time or more specifically, specifies the rate of energy loss through a piece of material.

The US Department of Energy (DOE) has provided revised R-value recommendations based on climate zones. To understand the energy impact of selecting the right R-value insulation material for your building, an on-line heating calculator will help illustrate the heating requirements and associated energy costs for different insulating materials. Building heating requirements are often expressed in BTU (British Thermal Units) per cubic foot.

The Heater Shop BTU Calculator Heating Calculator provides some useful insight into managing energy expenses. The calculations were based on an average of 25 HDD for New York City.

Figure 1 illustrates the heating requirements as measured by BTU per square foot of building space for corresponding insulating materials across ceiling heights from 10 to 40 feet to capture cubic feet. As seen from Figure 1, the heating requirements show significant variance depending on insulation assumptions.

Figure 1 BTUs per Square Foot BTU
Source: Heater Shop BTU Calculator

Taking the building heating requirements one-step further, different insulating assumptions (no insulation, average, and good) translate into wide dispersion in operating costs. The on-line heating calculator was used to estimate the building heating requirements based on the following assumptions: 10,000 square foot facility with ceiling height of 10 feet for 25 HDD for no-insulation average insulation, and good insulation. To derive fuel costs, the BTU per square foot for each insulation category was applied to a heating system operating for five heating months with approximately 1,400 hour of operations to coincide with a gas furnace at 90% efficiency and 20-minute on-cycle and 30-minute off-cycle. Gas pricing for heating are based on $17.00 per million BTU.

Figure 2 Heating Energy Cost  Heating
Source: Green Econometrics research

Figure 2 demonstrates that heating cost per square foot for good insulation saves approximately $2.90 per square foot in comparison to no-insulation at all. If we compare the heating costs savings to the cost of insulation, the payback period for insulation can be achieved in a year under most circumstances.

Figure 3 Insulation Cost  insulation
Source: Green Econometrics research

To assess the C-value and R-Value of various building materials, there are some useful charts available on the web. Insulation and Building Materials R-Values

The bottom line is that insulation is one of the most important building components materials to improve energy efficiency and lower utility costs.

Should we be Concerned over Elevated CO2 levels?

With the oppressive heat and appalling humidity along the Eastern Seaboard, one considers the possibility of climate change and the impact of that greenhouse gases may have on our environment. Without developing statistical regression models to gleam any semblance of understating of carbon dioxide’s impact on climate change, let’s just look at some charts that illustrate the changes of CO2 levels though history.

While industry experts and scientist debate whether elevated CO2 levels have an impact on climate change, the scientific data taken from ice core samples strongly suggests CO2 levels have remained in a range of 180-to-299 parts per million (PPM) for the last four-hounded thousand years. Scientists have developed models to suggest that rising CO2 levels contributes to global warning which are subsequently followed by dramatic climate changes that lead to periods of rapid cooling – the ice ages.

Scientific theories suggest that rising global temperatures melts the Polar ice which allows substantial amounts of fresh water to enter the oceans. The fresh water disrupts the ocean currents that are responsible for establishing a nation’s climate. As oceans warm near the equator, the warmer water travels towards each of the Polar areas. The cooler water near the Polar areas sinks and travels towards the equator. These ocean currents allows for stable climates. The issue is that fresh water is less dense because it is not salty like seawater. Therefore, the fresh water does not sink like the cold salinated seawater thereby disrupting the normal flow of the ocean currents.

Figure 1 CO2 Ice Core Data – illustrates the level of CO2 over the last four-hounded thousand years. The Vostok Ice Core CO2 data was compiled by Laboratoire de Glaciologie et de Geophysique de l’Environnement.
Ice Core Data

Figure 1 CO2 Levels – Vostok Ice Core CO2 Ice Core
Source: Laboratoire de Glaciologie et de Geophysique de l’Environnement

If this Ice Core CO2 data is correct, then the current data on atmospheric CO2 levels is quite profound. CO2 data is complied by the National Oceanic and Atmospheric Administration NOAA at the Mauna Loa Observatory in Hawaii. The latest trend indicates CO2 levels for June 2010 are at a mean of 392 ppm versus 339 in June 1980 and 317 in 1960. Clearly these CO2 levels are elevated. The question is what is the impact on our environment.

Aside from the catastrophe in the Gulf of Mexico and the dire need to find an alternative to our dependence on oil, should we not accelerate our efforts to find an alternative energy solution and as a way to mitigate the impact of CO2 on our environment? Maybe investment into alternative energy could help solve multiple problems.

Figure 2 Mauna Loa CO2 Readings  Mauna Loa
Source: Source data published by the National Oceanic and Atmospheric Administration (NOAA)

The bottom line is that we need to consider the possibility that elevated CO2 levels in our atmosphere could potentially have a detrimental impact on our climate. In any event, limiting our dependence on fossil fuels, the main contributor to CO2, should be paramount. Let us not forget oil is supply-constrained – there are no readily available substitutes aside from electric vehicles, and without a strategy to embrace renewable energy, supply disruptions will have a painful impact on our economy, national security, and environment.

Global Oil: Economic Recovery should Drive Demand and Price

Despite the global economic recession, preliminary data suggest oil demand remains rather resilient. According to the latest reported information from the Energy Information Administration (EIA), Global Petroleum Consumption is down one percent y/y in 2008 while China and India show increases of 4% and 5%, respectively. However, current data through September 2009, show oil demand fell quite precipitously in the US. Through September 2009, oil consumption is down over two million barrels per day form the 2007 annual average (an 11% decline). Most of the change in oil consumption is cyclical and with an economic recovery expected, oil demand should rebound and perhaps drive prices higher.

Figure 1 US Average Annual Oil Consumption US Oil Demand

Historically, the US has seen this type of demand erosion before. From 1979 to 1983, oil demand in the US declined 28% with annualized rate of a 10% decline per year. Over this same period, oil prices actual rose despite the fall in demand. Oil prices by barrel (42 US gallons) rose from $3.60 in 1972 to $25.10 in 1979. Oil prices are up significantly in 2009. In January 2009, oil was traded at $33.07 a barrel and in January 2010, oil is trading at 2010 Oil prices $78.00 per barrel.

On a global basis, oil demand has only contracted by one percent in 2008, the latest data from the IEA. Despite the fall out in US oil demand, global markets driven from demand from China and India, has kept the global demand for oil relatively stable.

Figure 2 Global Oil Demand Oil

The growing demand for oil from China and India increased their respective share of the global oil markets from 3% and 1%, respectively in 1980 to over 9% and 3% in 2008. At the same time, the US share of global oil consumption has declined from 27% in 1980 to under 23% in 2008. See Figure 3 China and India Oil Demand.

Figure 3 China and India Oil Demand Global Oil Demand

The bottom line is that as financial growth emerges across the globe, oil demand should increase commensurately and with oil process already at elevated levels, further prices increases are expected. – demand for oil will increase and so will oil prices.

Formulating an Effective Energy Efficiency Strategy with Measurement and Verification Copyright © 2009 Green Econometrics, LLC

The development of an energy efficiency strategy incorporates analysis of energy expenditures and energy consumption. The energy strategy must incorporate dynamics between costs, budgets and the consumption of energy including the monitoring of kilowatt-hours (KWH) of electricity and liquid hydrocarbon fuels consumed. By analyzing both the financial and the energy consumption components we are better positioned to frame the scope of the energy efficiency projects.

We start with a comprehensive energy audit analyzing energy consumption and expenditures. After determining which activities offer the fastest, cheapest, and greatest economic impact we are then able to define the scope of energy efficiency projects. The next step in the energy strategy process is to assess, rank and specify energy saving opportunities. At this phase, we have a broad understanding of the scope of energy efficiency projects within the appropriate budgetary considerations.

Conduct Energy Audit and Analyze Energy Spending

Upon analysis of the energy expenditures and the appropriate budgetary considerations, we commence with an energy audit to examine the dimensions of energy consumption. The energy audit establishes an energy efficiency baseline for buildings and vehicles. In the energy audit, energy consumption is measured by source and activity using monitors attached to branch circuits, gas pipes, and fuel lines. In this manner, energy consumption is evaluated from a financial and physical perspective and baseline usage patterns are established for electricity and other fuels.

During the energy audit, an analysis of energy intensity is measured. For buildings, energy consumption is measured in kilowatt-hours per square-foot to identify which activities consume the most energy. The energy intensity measurements are then ranked by consumption activity and compared to actual energy expenditures.

The purpose of the energy audit is to establish a baseline of energy consumption and the energy intensity associated with each building, department, vehicles, and/or activity usage category. By constructing an effective energy efficiency strategy that identifies and measures energy demand by activity, a better understanding of economic- and financial-impact is established. The critical component to the energy audit is measurement and verification were wireless Internet-based energy monitoring provide data before and after energy efficiency projects commence. The energy audit and energy monitoring systems together with financial analysis of energy consumption serve as the framework to rank and assess energy efficiency projects.

Heuristically, energy consumption in buildings is tied to lighting; and heating, cooling, and ventilation systems see Energy Intensity . The following chart, Figure 1 serves to illustrate which activities contribute most to energy consumption in buildings.

Figure 1 Kilowatt-hours (KWH) per Square Foot KWH sq ft

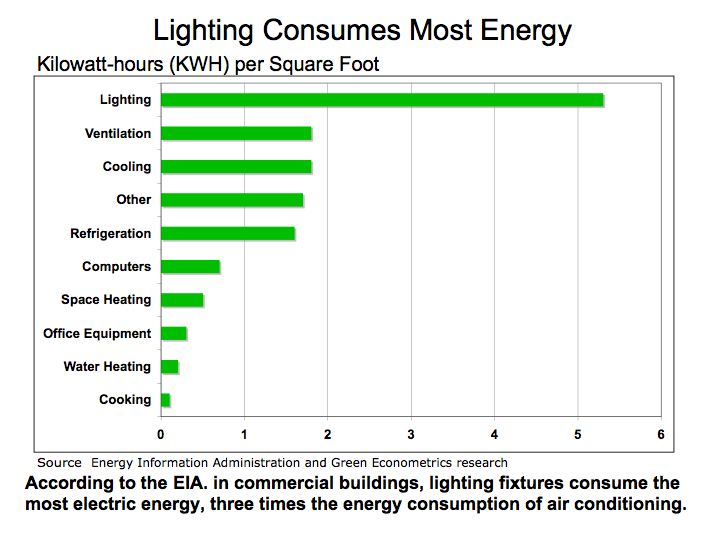
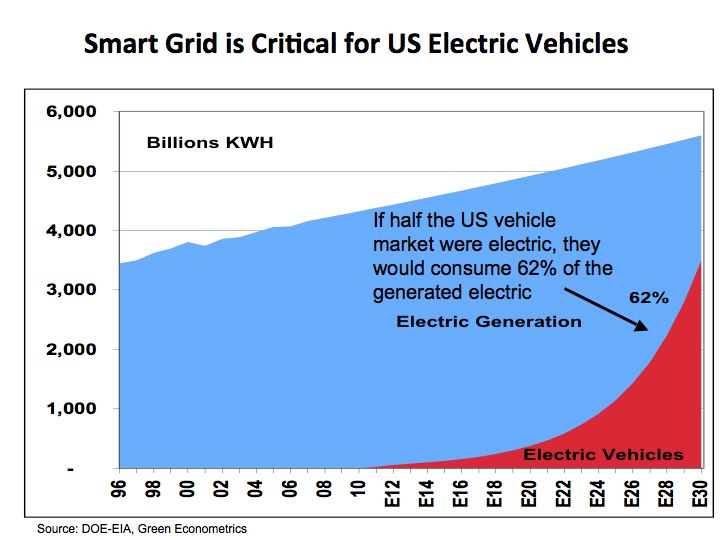
According to information provided by the DOE, lighting, cooling and ventilation alone account for nearly two-thirds of all energy consumption in a building. For perspective, electric energy demand is increasing at an annualized rate of 1.6%. According to the Energy Information Administration (EIA), demand for electricity grew 21% between 1995 and 2006.

The energy consumption audit provides a means to assess which activities should be further analyzed for energy efficiency projects. The baseline energy usage measured in KWH per square foot serves as the framework to evaluate that locations and activities could benefit from lighting retrofits, equipment upgrades, structural improvements, and energy monitoring systems.

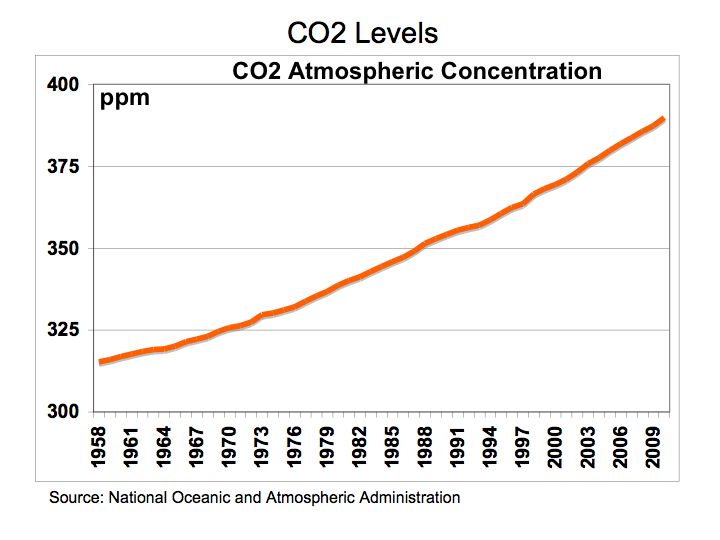
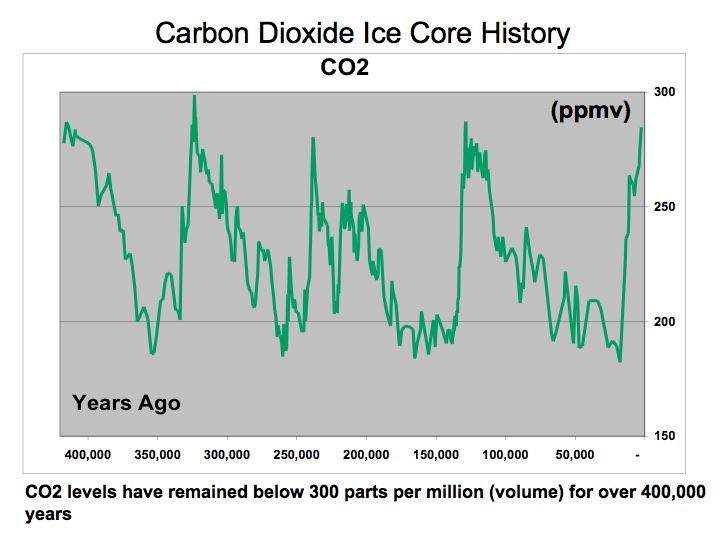
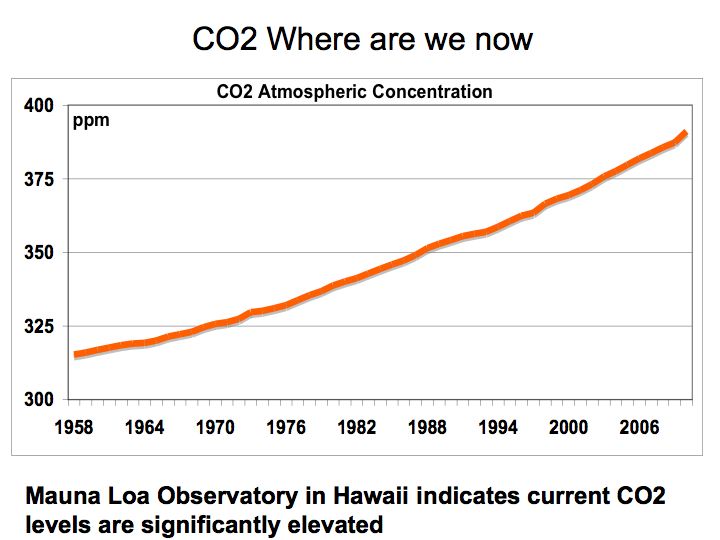
As a consequence of increasing energy consumption in buildings, electric generation relies extensively on hydrocarbon fuels that carry adverse environmental effects. Figure 2 illustrates the proportion of coal and other hydrocarbon fuels that are used to generate electricity in comparison to renewable energy sources. Coal still accounts for nearly half of all electric generation while contributing the most in terms of harmful emissions such as carbon dioxide, nitrous oxide, and sulfur dioxide.

FIGURE 2: Electric Generation Method Electric

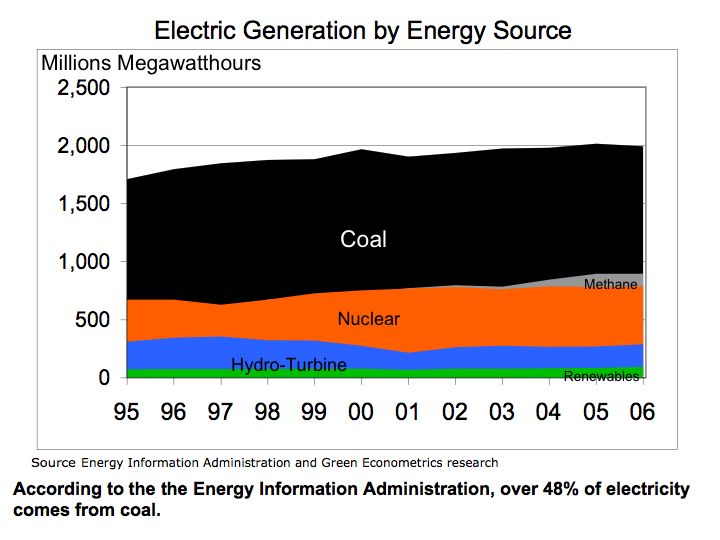
As part of the energy audit process for buildings, an energy consumption analysis of lighting and HVAC systems is evaluated along with the building’s insulation R-Value (resistance to heat flow where the higher the R-value, the greater the insulating effectiveness). In addition to lighting and HVAC systems, specialized equipment may also account for large energy demand. During our energy audit, we plan to identify and measure energy usage of special equipment in order to construct energy efficiency initiatives with clearly defined and measurable energy reduction targets.

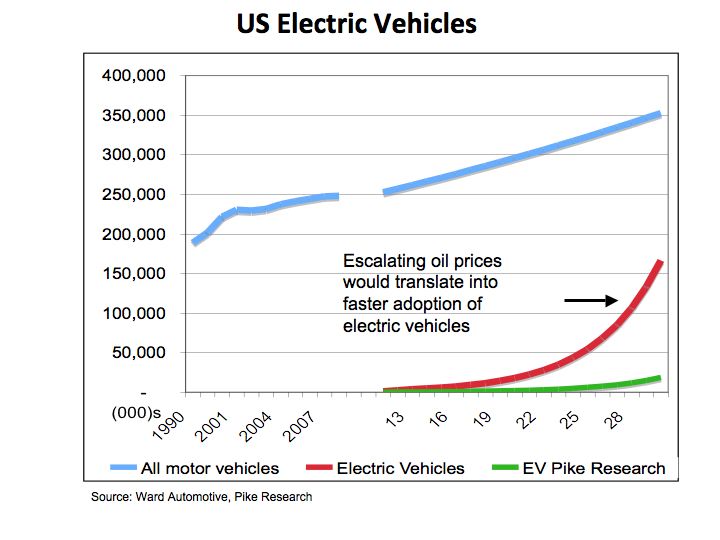
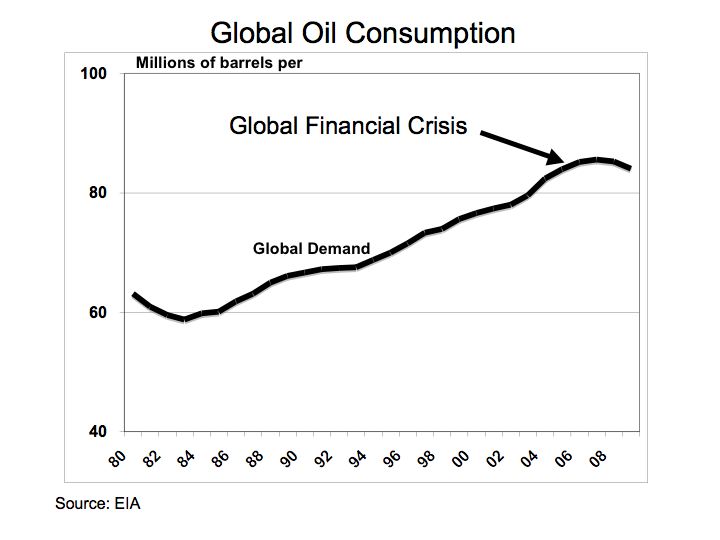
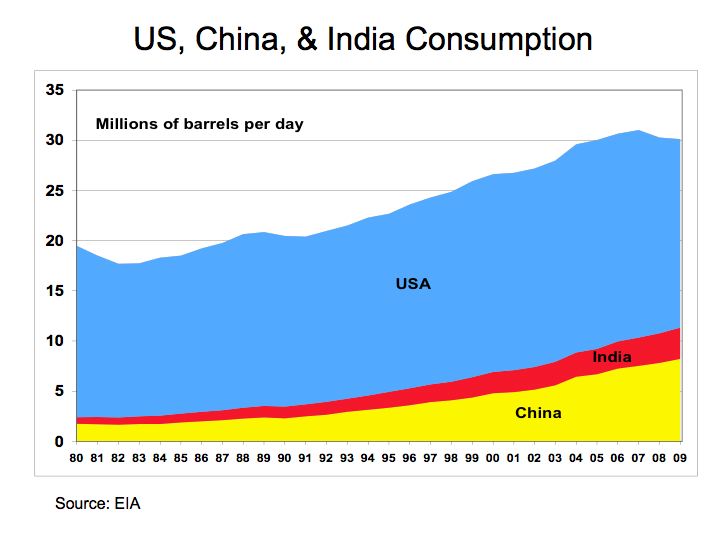
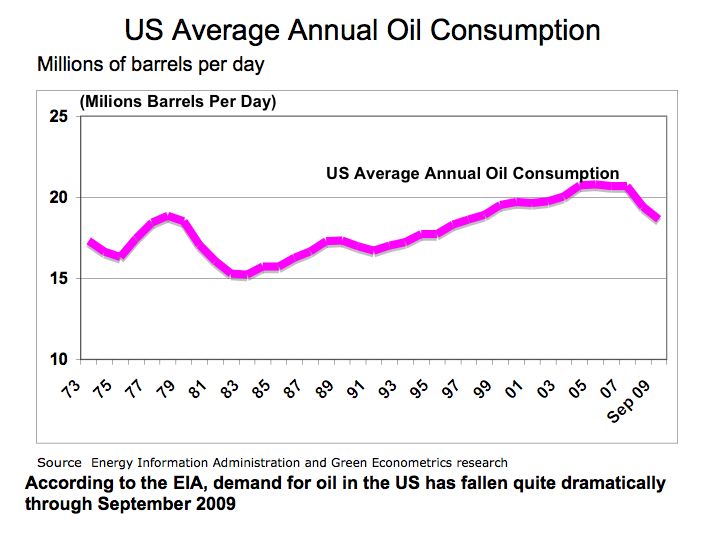
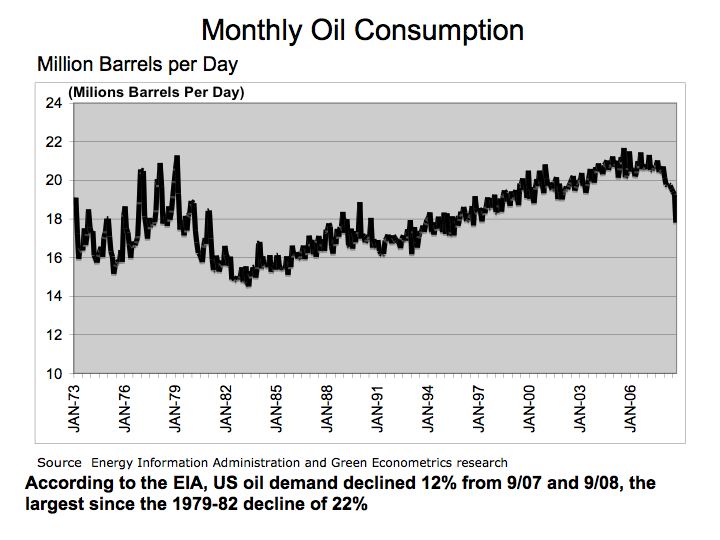
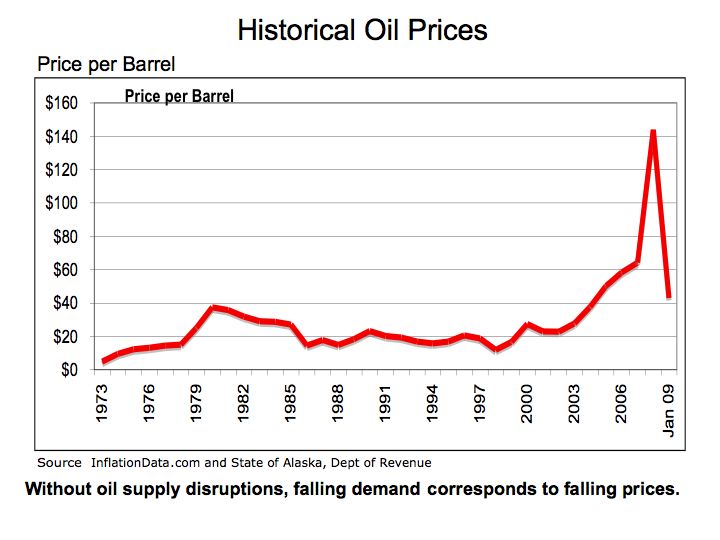
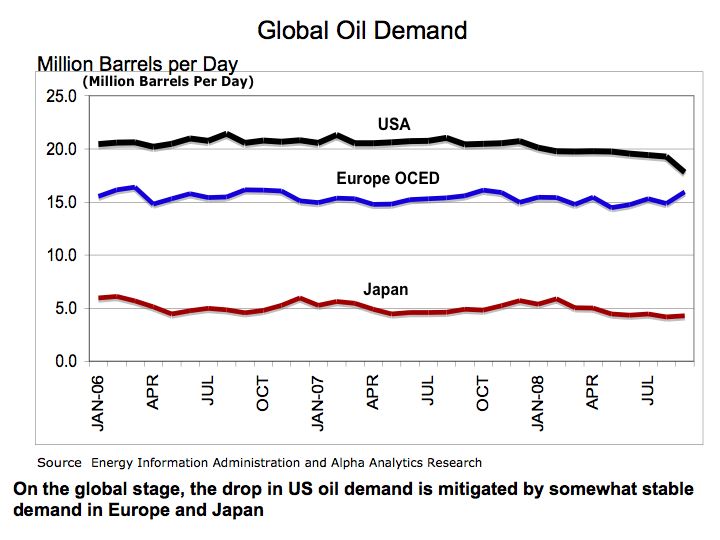
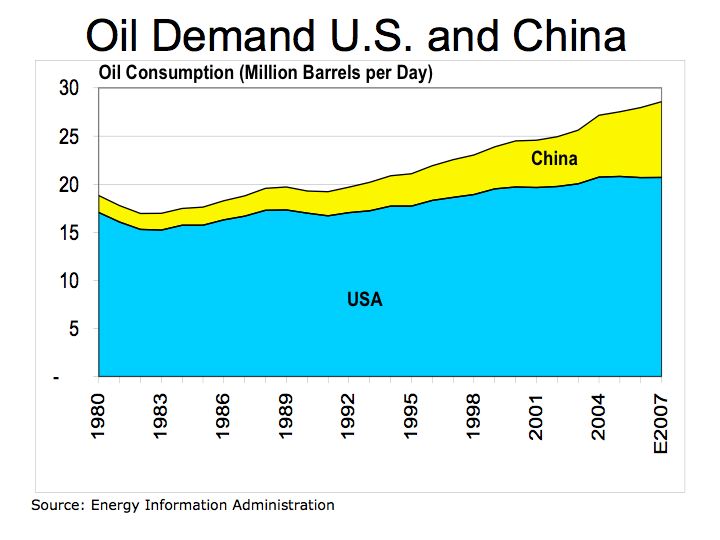
Energy efficiency for transportation vehicles is one of the most significant factors to manage. The fact that there are no real substitutes for oil in the transportation industry illustrates two important points: 1) structural changes to driving patterns are required to see appreciable changes to oil consumption and 2) government authorities are vulnerable, with no readily available substitutes for oil, supply disruption could negatively impact transportation systems. Therefore, we emphasize fuel management systems for fleets and vehicles that monitor fuel consumption and efficiencies. DOE studies have indicated that changing driving habits could improve fuel efficiency by up to 30%.

Vehicle mounted devices that integrated fuel consumption feedback as the vehicle is driven promotes higher fuel efficiency. These off the shelf products are cost-effective, offering payback in months that dramatically improves fuel efficiencies. Aside from routine tune-ups, limiting weight, and checking tire pressure, augmenting driving patterns through gauges that provide feedback on fuel efficiency make the difference in saving energy.

In most situations, fuel management systems can be installed without significant mechanical aptitude. The ScanGaugeII from Linear-Logic is useable on most vehicles manufactured after 1996 including Gas, Diesel, Propane and Hybrid Vehicles and are designed to be installed by the consumer with plug-and-play instructions.

Identify and Measure Energy Demand by Activity

From the Energy Audit, the energy intensity of targeted buildings and fuel efficiencies of official vehicles are established. In buildings, it’s the lighting and heating, ventilation, and cooling that comprise the bulk of energy consumption.

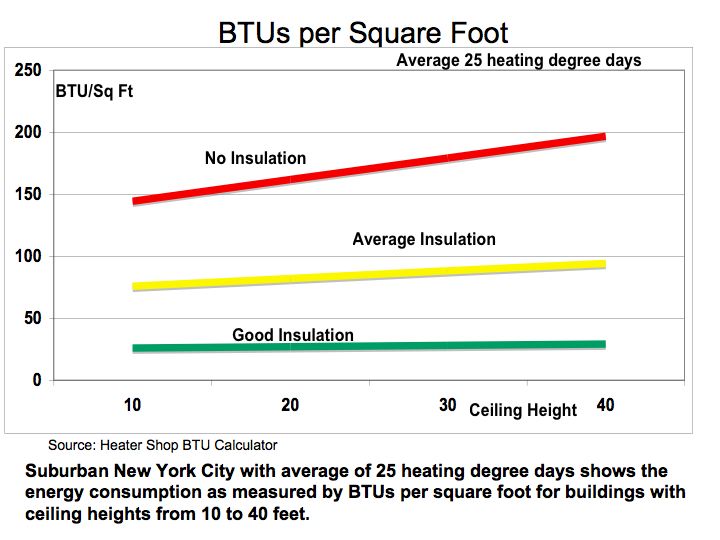
Heating, ventilation, and cooling represent a significant portion of energy consumption in buildings and are a priority target for energy analysis. The Seasonal Energy Efficiency Ratio (SEER) is employed as an assessment of the equipment and analyzed in conjunction with building insulation. The efficiency of air conditioners is often rated in SEER ratio, which is defined by the Air Conditioning, Heating, and Refrigeration Institute and provides a standard unit measure of performance. The higher the SEER rating of a cooling system the more energy efficient the system is. The SEER rating is the amount of BTU (British Thermal Units) of cooling output divided by the total electric energy input in watt-hours.

For heating systems in a building, Annual Fuel Utilization Efficiency (AFUE) is used to measure and compare the performance of different systems. DOE studies have indicated that even with known AFUE efficiency ratings, heat losses defined as idle losses contribute to degradation in heating system efficiency,

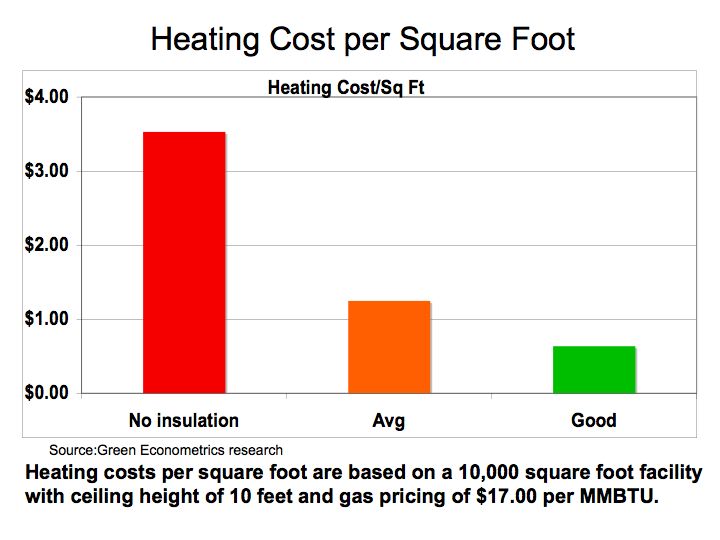
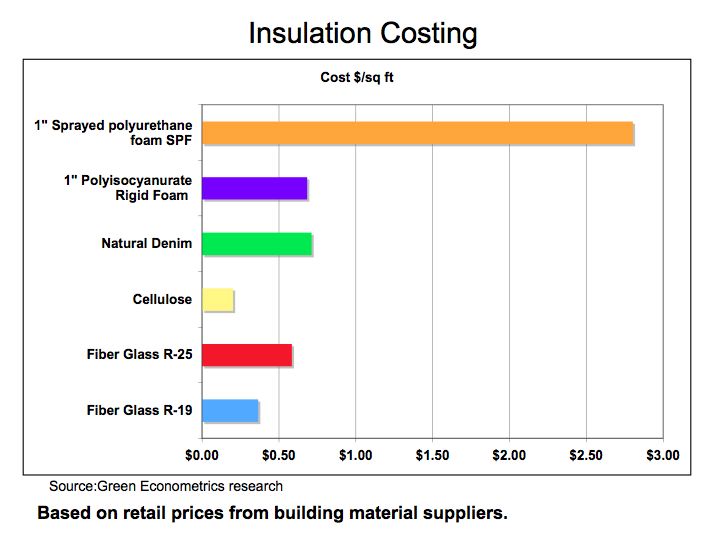
To analyze energy consumption of heating and air conditioning systems (HVAC), we evaluate the building’s R-Value in comparison to the energy efficiency of the current heating and air conditioning systems. The energy demand evaluation includes a cost-benefit analysis comparing options in either HVAC system upgrade and/or improvements to the building’s insulation R-Value. By comparing the buildings R-Value in conjunction with HVAC efficiency performance, projects offering the greatest cost effectiveness are identified. The building’s R-Values can be measured using FLIR Systems infrared camera and software system. In this manner, the replacement cost of an HVAC system and costs to improve the building’s R-Value are analyzed to measure economic benefits. This information will allow the building owner to make an informed decision on whether any energy efficiency investment into HVAC upgrade or improvement to R-Value demonstrate economic benefit, i.e. positive financial return.

Consideration for heating and cooling systems upgrades are assessed by equipment SEER and AFUE ratings, installation costs, and efficiency payback. After equipment assessment is complete, proposals will be provided along with estimates for upgrade costs and payback analysis.

Benchmark and Analyze Energy Intensity

After conducting the energy audit, and compiling data on energy usage by activity category, we benchmark and analyze energy projects offering the greatest opportunities. As illustrated in Figure 3, energy efficiency for lighting systems can be substantially improved by retrofitting legacy light fixtures with higher efficiency fixtures and bulbs.

The energy audit and analysis provide the framework to evaluate energy efficiency projects. By analyzing energy consumption and the economic benefits associated with the energy savings projects, the most efficient and economically beneficial initiatives are identified and ranked.

FIGURE 3: Energy Savings in KWH per Square Foot Figure 1 Kilowatt-hours (KWH) per Square Foot KWH sq ft

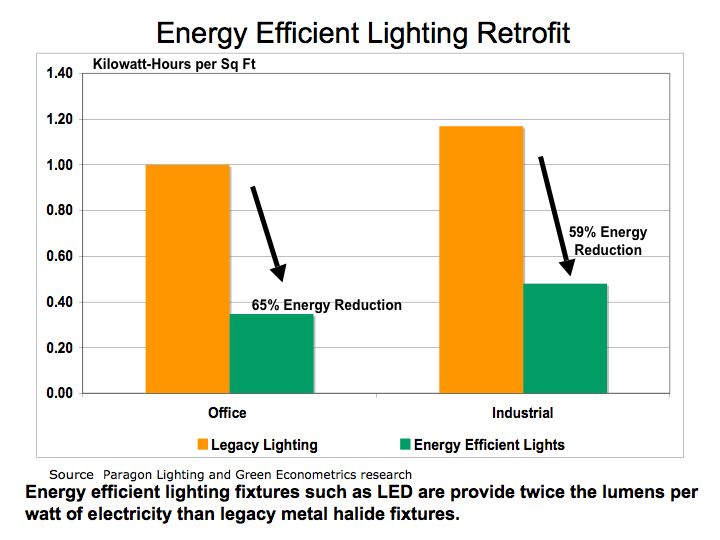
Establish Measurable Goals and Objectives

To establish relevant goals and objectives we are evaluating projects that are adhering to the SMART goal approach: specific, measurable, attainable, realistic and timely. Energy efficiency gains are most pronounced with lighting retrofits and energy monitoring in buildings in buildings and energy monitoring in vehicles.

After conducting an energy audit, analyzing energy consumption activities and the economics of energy efficiency projects, realistic and achievable energy savings goals are defined. Key performance metrics for energy savings are defined for buildings and vehicles. Key performance indicators are established for each project. For example, KWHs saved are defined for lighting retrofit projects, efficiency improvements for HVAC system upgrades, R-Value improvements for building insulation, and MPG gains for vehicles.

For each energy savings project, timelines are established with clearly defined milestones. Energy projects are presented with costs; expected energy savings measured in energy and dollar units, cost benefit analysis, and timelines.

Architect the Deployment of Energy Monitoring Systems

One of the first energy initiatives to consider in any energy savings project is the installation of an energy monitoring system for vehicles and buildings. Energy monitoring systems demonstrate the fastest and most economical pathways to achieving energy savings.

Energy monitoring systems for motor vehicles also demonstrate positive economic returns and real energy savings. The $180 energy-monitoring device with 10% fuel efficiency gain achieves breakeven at 14,500 miles with gasoline costing $2.50 a gallon.

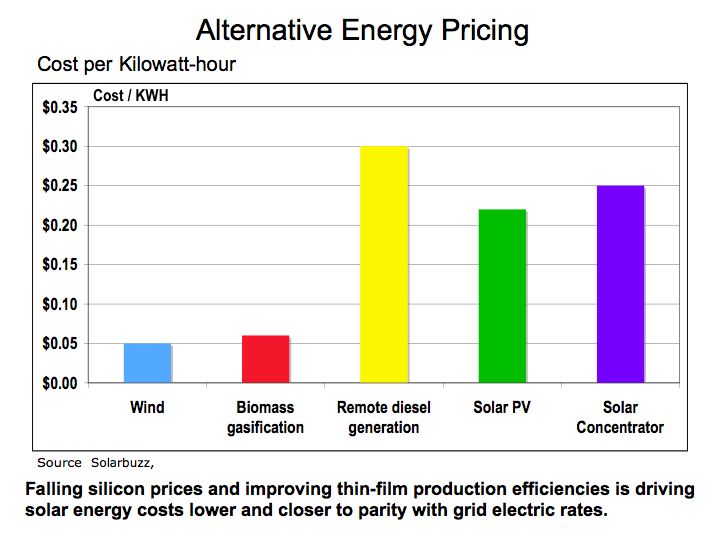
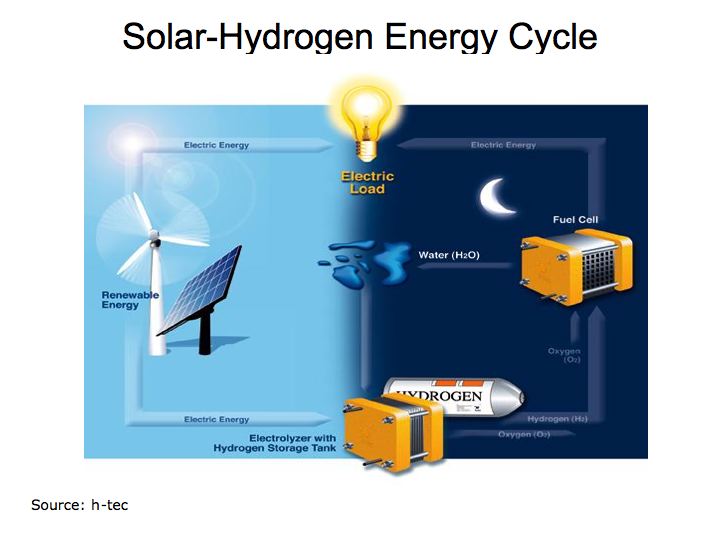
Evaluate Feasibility of Renewable Energy Projects

Renewable energy projects such as solar and wind energy systems are often costly with long payback periods. Without tax incentives and grants, renewable energy projects are unable to demonstrate positive financial returns. However, utility rates for electric are expected to increase, improving the case for renewable energy projects. To improve the viability of alternative energy projects, energy efficiency projects such as lighting retrofit serve to lower energy consumption and therefore enhance the feasibility of solar and wind energy projects.

Oil Consumption Impacted More by Price than Deteriorating Economic Conditions

The fall in oil consumption was most dramatic following the escalating price of crude oil to $145.16 per barrel on July 14, 2008 then at any other point over the last several years. Price elasticity, a key concept in Economics 101, which measures the impact of price change to changes in unit volume sold, is helpful in determining which products have readily available substitutes or which, like oil are inelastic with no real substitutes.

As illustrated by Benjamin Graham and David Dodd in their book Security Analysis, 1940 edition, during the 1930’s the economy had a dramatic impact on spending and consumption particularly on discretionary items such as travel. In one illustration, the change in demand was most pronounced in railroad revenues where tickets purchased for railroad travel, declined 51% from 1929 to 1993 as measured by gross receipts for the railroad industry. Over this same period, spending on the consumer staples (inelastic demand), such as electricity encountered a decline of only 9%.

While almost everyone would agree that the current economic climate is one of the most challenging since the 1930’s, a quick review of oil consumption over the last several years illustrates that demand has not significantly contracted, suggesting driving habits only changed when prices escalated to over $100 per barrel. Oil consumption dropped only 4.9% from January 2008 through January 2009.

Figure 1 Oil Consumption Oil

As seen from Figure 1, the sharp drop in oil consumption in September 2008 of 8.3% appears as an aberration when measured over the whole year. The fact there are no real substitutes for oil in the transportation industry illustrates two important points: 1) structural changes to driving patterns are required to see appreciable changes to oil consumption and 2) how vulnerable we are as a nation with no readily available substitutes for oil in the transportation systems.

Figure 2 Oil Demand in China and India Wood Prices

With China and India undergoing significant structural changes as they rapidly migrate towards motor vehicles for transportation suggests the demand for oil should continue to grow relatively unabated. Until the price of oil climbs back over $100 per barrel, we will not see the structural changes necessary to develop alternatives to oil in the transportation market.

The bottom line: energy and in particular, oil has not experienced a dramatic drop in demand during 2008 suggesting driving patterns were influenced more by the price of oil then the struggling economy. We must begin to shift emphasis to alternative energies such as solar as well as hybrids and electric vehicles.

Solar Energy – Closer to Grid Parity?

Last month First Solar (FSLR) achieved a milestone in the solar industry with its announcement of $1 per Watt reducing its production cost for solar modules to 98 cents per watt, thereby braking the $1 per watt price barrier.. While the achievement is great news for the solar industry some studies suggest more work is needed. An article in Popular Mechanics $1 per Watt talks of university studies questioning the scalability of solar given the immense global needs for energy. Last year our post included an article Solar Energy Limits – Possible Constraints in Tellurium Production? discussing possible limits on tellurium production on thin film solar photovoltaic (PV) suppliers.

In addition, Barron’s published an article (March 30, 2009)_ Nightfall Comes to Solar Land providing unique insight into the economics of solar PV suppliers. High oil prices and soaring stock prices on solar PV companies fueled silicon suppliers to ramp production capacity that has now transitioned, according to the Barron’s article, into an over supply of polysilicon used in the production of PV panels and subsequently, eroding the cost advantage established by thin film PV companies such as First Solar and Energy Conversion Devices (ENER) over polysilicon PV firms such as SunPower (SPWRA).

However, the PV panels typically represent approximately half the cost of a solar energy system. The following figure, Solar Installation Costs compares the total cost of installing a solar energy system which includes labor and supporting matertials.

Figure 1 Solar Installation Costs install

As illustrated in Figure 1, the panels represent a significant cost of installation, but the labor and support brackets for the PV panels are significant as well. While thin film PV enjoys significantly lower panel costs and is easier to install, the supporting brackets are sometimes more expensive. As prices for silicon fall, the cost disparity between thin film and silicon PV will narrow.

Figure 2 Solar Energy Economics econ

In Figure 2 Green Econometrics is comparing PV efficiency as measured by watts per square meter versus cost per watt. The selected companies represent a small portion of the global PV suppliers, but do illustrate the position of the leading US suppliers. The ideal model is to lower cost per watt while improving PV efficiency. But be cognizant that PV module cost per watt may not be indicative of the total system costs.

A comparison of wind and solar energy costs is demonstrated by Detronics and offers a useful framework to compare wind and solar costs by kilowatt-hour (KWH). As a caveat, wind and solar resources will vary dramatically by location. In the Detronics example, the costs per KWH represent the production over one year and both wind and solar have 20-year life spans. Over twenty years the 1,000-watt wind systems cost per KWH of $7.35 would average approximately $0.36 per KWH and the 750-watt solar systems cost of $10.68 would amount about $0.53 per KWH over the investment period.

Figure 3 Alternative Energy PricingEnergy Pricing

The Alternative Energy Pricing chart was base on research from Solarbuzz which is one of the leading research firms in solar energy. The cost per KWH that Solarbuzz provides is a global average. Even with cost per watt falling below $1.00, the system costs after installation are closer to $5.00 according to Abound Solar (formerly known as AVA Solar) and is still higher than parity with grid with a cost of $0.21 per KWH.

The bottom line is that despite the lower PV panel costs; we are still not at parity with hydrocarbon fuels such as coal and oil. Carbon based taxing or alternative energy stimulus and more investment into alternative energy is required to improve the economics of solar and wind.

Dramatic Drop in Oil Consumption – What’s the Implication?

America’s appetite for oil declined sharply as the economy weakened over 2008. According to the latest reported information from the Energy Information Administration (EIA), Monthly Oil Consumption oil consumption declined 13% y/y from September 2007 through September 2008.

Historically, the US has seen this type of demand erosion before. From 1979 to 1983, oil demand in the US declined 28% with annualized rate of a 10% decline per year. Over this same period, oil prices actual rose despite the fall in demand. Oil prices by barrel (42 US gallons) rose from $3.60 in 1972 to $25.10 in 1979. In 1983, oil prices increased to $29.08 a barrel, representing an increase of nearly 16% from 1979.

Economics would normally dictate that as demand declines so should prices. However, the geopolitical events and oil supply disruption maintained higher oil prices despite the subsequent decline in oil demand. It was not until structural changes in energy conservation and driving patterns were felt before leading to a fall in oil prices during the 1980’s.

Figure 1 Monthly Oil Consumption Oil Demand

As illustrated in Figure 1, the precipitous fall in oil demand over the last half of 2008 is quite dramatic in comparison to historical price data. The large fluctuations in monthly oil consumption during the 70’s and 80’s, were primarily due to supply disruptions. The higher oil prices resulting from supply disruptions over this period led to structural changes in the energy market that later resulted in falling oil prices.

Figure 2 Oil Prices Oil Prices

While falling demand and rising oil prices during the 70’s and 80’s is an anomaly, we see from Figure 2, that currently there is significant correlation between falling oil demand and a subsequent decline in the price of oil. Excluding the peak oil price in July 2008, oil declined 33% from the average price per barrel of $64 in 2007.

Perhaps the precipitous fall in oil prices can explain why demand for oil on a global basis has not declined as dramatically as in the US. As we can see from Figure 3, the drop in US oil consumption is matched with a slight increase in demand in Europe and only a moderate decline in Japan.

Figure 3 Global Oil Demand Global Oil Demand

The bottom line is the financial shock that hit global markets is dramatically impacting consumption. As a recovery inevitably ensues, demand for oil will increase and so will oil prices. Let’s not be complacent with hydrocarbon fuels. Falling energy prices act as a disincentive for investment into alternative energies.

A Historical Perspective on Energy Prices and Economic Challenges

To understand current energy prices it may serve us to examine historical energy prices. Our theme is energy economics and specifically that energy prices follow the laws of supply and demand to set pricing.

There are some interesting perspectives on historical energy prices from several books including Security Analysis, 1940 edition by Benjamin Graham and David Dodd, The Great Wave, by David Hackett Fischer; and The Industrial Revolution in World History, by Peter Stearns. These books provide extensive data on pricing, industry revenues, and the framework that energy and technology serve in the economics of the industrial world.

Figure 1 Historical Energy Prices Energy Prices

With the risk of oversimplification, our first figure shows there have been four distinct energy prices waves that have rippled through history. The scarcity of wood that was used for building homes, heating, and tools became increasing scarce as deforestation spread through Europe in the 1300s and followed again in the 1600’s. Coal prices rose rapidly with the War of 1812 and the Napoleonic Wars. Oil prices peaked in 1982 and to an all time high of $145.16 on July 14, 2008.

Figure 2 Medieval Wood Prices Wood Prices

During the Medieval period in world history wood prices increased nearly threefold according to David Fischer in the The Great Wave. Wood prices rose with scarcity and peaked in 1320 as impact of the Bubonic Plague began to kill a quarter of Europe’s’ population. Twenty years from its peak in 1320, wood prices declined by 48% as the Bubonic Plague reduces the population and in turn, lowering the demand for wood.

Figure 3 Wood Prices Wood Prices

Figure 3. Illustrates the rapid rise in the demand for wood as the growing world populations benefited advances in science and agriculture from the Renaissance period. Wood is used for just about everything and prices climb as more land is used for agriculture leading to deforestation exacerbating the wood shortage. As demand for wood increases, prices subsequently follow. By the end of the 1600’s, coal begins to substitute for wood as an energy alternative.

With advances in technology came improvements in coal mining and transportation that allowed coal to substitute for wood as an energy source. With the invention such as Thomas Newcomen’s steam, powered pump in 1712 that facilitated coal mining and James Watt’s steam engine in 1765 that lead to advances in transportation including railroads and machinery, coal grew in importance as an energy source. These advances in technology enabled greater supplies of coal to enter the market which lead to declines in energy prices.

Figure 4 Coal Prices Coal Prices

We can gleam from Figure 4 that coal prices peaked in 1810-to-1815 coinciding with the War of 1812 and the Napoleonic Wars. The technological advances in mining and transportations fostered the development of an infrastructure to support the coal industry. The price of coal rose as wars ragging in Europe and the US, increased the demand for materials and supplies such as coal. However, as the wars came to an end, the abundant supplies of coal allowed prices to fall keeping energy prices low.

Oil entered the picture with the drilling of the first oil well in northwestern Pennsylvania in 1859 and the Internal Combustion Engine in 1860 that facilitated the development of the oil industry.

As oil emerged to become the dominant fuel of the 20th Century, it’s only recently that we face supply shortages. To better understand the dynamics of energy pricing in the face of changing demand, a review of spending on railroads and electricity may serve as a surrogate for discretionary and consumer stable spending patterns.

Figure 5 Industry Segment Revenues Industry Revenues

Figure 5 illustrates changes in the aggregate revenues of railroads in comparison to electric utilizes during the Great Depression. Copious notes taken by Graham and Dodd for their book Security Analysis help to demonstrate the economic laws of supply and demand.

The change in demand was most pronounced in railroad revenues. Expenditures on railroads, the more discretionary of the two industries, declined 51% from 1929 to 1993 as measured by gross receipts for the railroad industry. Over this same period, spending on the consumer stable, electricity only encountered a decline of 9%. In economic terms, railroads demonstrate greater demand elasticity meaning there is greater change in demand at prices change or this period, disposable income. While there is some discretionary portion of our spending associated with oil, a large portion of spending on oil is out of necessity. Therefore, even during times of great economic distress, the propensity for energy consumption is not eradicated entirely.

The bottom line: Energy pricing will continue to be dictated by supply and demand. Hydrocarbon fuels such as oil are finite in nature and therefore, without definitive strategies to cultivate alternative energy resources we will remain hostage to the vagaries in energy prices..

Don’t let the fall in Oil Prices Lead to Energy Complacency

The precipitous drop in oil prices may not hold for long. Speculators and fears of oil flow disruptions drove oil prices to an all time high of $145.16 on July 14, 2008 and is now down to $49.50 in November 20, 2008. Now the fear has shifted to the economy where deteriorating fundamentals suggest demand for oil will abate, at least in the near term. However, if history is any guide, demand for oil should be influenced by both structural changes such as consumers driving more fuel-efficient motor vehicles and cyclical factors such as the state of the economy.

Figure 1 US Historic Oil Imports Oil Imports

To get an understanding of the impact that both structural and economic factors had in reducing the demand for oil is to look at oil import from 1978 to 1988. Figure 1 illustrates the US demand for oil during the last major economic recession. The Oil Shock of the 1970’s severely impacted the US economy and the term stagflation captured our attention while interest rates reached exorbitant levels. From 1979 to 1982, US oil imports decline by 46% as the oil embargo of 1973 led to structural changes in oil consumption. US oil imports, as measured by the Energy Information Administration in U.S. Crude Oil Field Production (Thousand Barrels per Day) demonstrated a significant decline as a result of changing driving habits as fuel efficient import vehicles encroached on the domestic auto makers. The US consumers opted for foreign vehicles demonstrating higher fuel efficiencies and MPG entered our lexicon. These economic and structural changes dramatically reduced the demand for oil and subsequently, oil prices fell. It was not until 1985 before oil imports began to increase.

What’s missing from this analysis is the fact that during this period the US accounted for 27% of total world oil demand. . According to the Energy Information Administration (EIA), in 1980, China and India accounted for 2.8% and 1.0%, respectively, of the global demand for oil. In 1986, China and India increased their oil demand to account for 3.2% and 1.5% of the world market, respectively, an increase in oil demand of 57% for China and 44% for India.

In 2005, China and India account for 8.0% and 2.9% of global oil demand while US dropped to 24.9% of global oil demand. While even China and India are not immune to the current blissful economic environment, when the global economy does improve, their demand for oil will more than negate any structural changes the US consumers make in their driving habits. The demand for oil should continue to grow as an economic recovery ensues thereby leading to an increase in oil prices.

Figure 2 China and India Oil Consumption CHINA AND INDIA

Figure 2. illustrates the rapid rise in the demand of oil from China and India. From 1980 to 2005, demand for oil increased 280% in China and 125% in India. Despite the improving fuel consumption in the US, the global oil market is more apt to be impacting from the growth in developing countries than conservation in the US.

The bottom line: don’t remain complacent, strive for energy efficiency and invest into alternative energies.

For further reading on oil prices please refer to
oil price analysis .

Vote the Economy by Voting for Energy

Access to energy was instrumental fueling the Industrial Revolution. Over the last 200 years, industrial nations have migrated from wood to coal and now to oil as a source of energy. During the 1700’s, wood was used for just about everything from fuel to constructing houses and building wagons and even tools. As demand for wood increased, the cost of wood rose as deforestation led to the scarcity. The scarcity of wood resulted in deteriorating economics.

It was the availability and access to coal that enabled the growth of Industrial Revolution by providing accessible energy. The Industrial Revolution was predicated upon the availability of Labor, Technology, Capital, and Energy. Scarcity of any of these inputs could undermine economic growth, as was the case with capital during the Great Depression of the 1930’s and the Energy Shock of the 1970’s.

Oil, driven by rapid growth in automobile usage in the U.S, has replaced coal as the main energy fuel. According to the Energy Information Administration (EIA), the 70% of oil consumption in the U.S. is for transportation .

Figure 1 US Oil Imports Oil Imports

Figure 1 illustrates US historical oil imports, as measured by the Energy Information Administration in U.S. Crude Oil Field Production (Thousand Barrels per Day) that dates back to 1970. The EIA provides oil import data dating back to 1910. To estimate the amount of money the US spends on oil imports every year, we can use the data from the State of Alaska Department of Revenue, which provides historical data on the price of oil an derive an average yearly figure.

Figure 2 US Oil Import Spending Oil Spending

Figure 2. appears quite staggering given the amount of money we send to oil producing countries. The US is spending hundreds of billions to import oil. According to the EIA, the US imported an average of 10,031,000 barrels per day equating to $263 billion in imported oil during 2007 when the State of Alaska measured the yearly average spot price for a barrel of oil at $72.

According to Solarbuzz, Germany leads the world in solar photovoltaic (PV) installations with 47% of the market while China increased its market share of PV production from 20% to 35%. The US accounts for 8% of the world solar PV installations. Solarbuzz indicates the global solar PV industry was $17 billion in 2007 and the average cost of solar electricity is $0.2141 per KWH. If a portion of our $260 billion sent to oil producing countries were to be invested into solar energy, perhaps the US would not lag the world in alternative energy.

The bottom line is that the money spent on importing oil has a deleterious impact on our economy and continues our dependence on hydrocarbon fuels producing carbon and other harmful byproducts that negatively impact our climate and health of our children. The longer we are dependent on oil, the longer our economy and environment suffer. Use your vote for alternative energy and not drill baby drill.

”DRILL BABY DRILL” – NO INVEST INTO ENERGY TECHNOLOGY

Using the latest data from the Energy Information Administration (EIA) , oil production remains significantly below historical levels achieved in ‘70’s and ‘80’s. The peak production in 1970 has not been replicated despite significant expansion of drilling activity during the 1980’s.

Oil Drilling and Production

Figure 1 Oil Drilling and Production Oil Production

Figure 1 illustrates US historical oil production, as measured by the Energy Information Administration in U.S. Crude Oil Field Production (Thousand Barrels per Day) that dates back to 1920 juxtaposed against U.S. rig count, as measured by Bakers Hughes. The chart suggests that during the first energy shock to hit the US and the world, drilling activity expanded dramatically. By 1981, weekly North American oil rig count reached a high of 4,530 oil rigs in 1981.

U.S. Crude Oil Field Production reached a peak of 9.6 million barrels per day in 1970. In 1981, the height of US oil drilling, oil production was 8.57 million barrels per day. By 2002, U.S. Crude Oil Field Production was 5.74 million barrels per day. Over the last six years oil production declined 10.7% while over this same period, drilling activity as measured by Baker Hughes’ North American Rigs Running weekly rig count, increased 125%.

The decline in U.S. oil production is quite disturbing. During the last decade, a host of new technologies were introduced to help facilitate oil production. Companies such as Dawson Geophysical Co. (DWSN) that enhanced the market for energy exploration by providing seismic data acquisition services. Dawson Geophysical acquires and processes data using 2-D and 3-D seismic imaging technology to assess the potential of hydrocarbon sources below the earth’s surface.

Companies such as W-H Energy Services Inc. that was recently acquired by Smith International, Inc (SII) , offer an array of drilling services such as horizontal and directional drilling for onshore and offshore oil drilling, and 3-demensional rotary steering drilling systems. Smith Int’l is growing revenues at over 19% annually and Dawson’s revenues are growing 53%. With these oil drilling and energy exploration technologies growing at double rates, and drilling activity expanding at 14%, why is oil production falling?

With the rancor of “drill baby drill’ heard as call to solve the energy crisis, energy technologies such as solar and wind energy solutions deserve greater emphasis. Oil will eventually run out. There is a finite amount of oil in the ground. The Tar Sands will not solve the problem. According to Alberta Energy, sand oil production was 966,000 barrels per day (bbl/d) in 2005 and is expected to reach 3 million bbl/d by 2020. Tar sands would only contribute 3.5% towards our current oil consumption of 84.5 million barrels per day.

The bottom line is that our dependence on oil leaves our economy vulnerable. Energy is the catalyst that enables economic development. The longer we are dependent on importing oil from countries hostile to civilized existence, the more tenuous grows the environment. We need to conserve existing energy use and invest into energy technologies that foster the development of alternative energies, thereby, limiting our dependence on oil period.

Energy Crisis – What Can We Do

As energy and food prices set new world records, what can we do at home to avert the crisis? Food prices are rising because corn is diverted from food production to producing ethanol for use as fuel in motor vehicles and is exacerbated by the recent flooding in the Mid West. Oil prices continue to escalate as demand for oil in developing countries increases and supply constraints, rising production costs, and limited refining capacity constrain the supply of oil. These factors continue to weigh against homeowners that will face escalating fuel bills to heat or cool their homes. There are some viable alternative energy solutions including wind and solar as well as home insulation that should offset the rising cost of energy. As far as food for fuel, we need to break our dependence on hydrocarbons which continues to impact our climate and weather and transfer our wealth to oil producing nations

Corn Prices have increased 264% since 2005. The rising price of corn used for ethanol is causing farmers to plant more corn and less production of other grains such as wheat or soy. Lower supply of grains is driving up food prices. Rising food prices is most debilitating to the poor, especially those in developing countries.

Figure 1 Corn Prices
Corn

Growing demand for oil and questions over Peak Oil suggesting even with oil prices rising to such an elevated level, production is rather anemic. According to the Energy Information Administration (EIA) , while oil prices increased 344% since 2001, oil production from OPEC is up only 1.2% over this same period.

Figure 2 Oil Prices
Oil

According to the EIA The demand for oil in China is growing at an 8.1% CAGR over the last five years. With demand for oil growing significantly in developing countries and despite production developments in Saudi Arabia and the 5-to-8 billion deepwater Tupi oil discovery in over Brazil The Tupi announcement in January 2008 is the world’s biggest oil find since a 12-billion-barrel field discovered in 2000 in Kazakhstan according the International Herald Tribune. These new oil discoveries are often in inhospitable areas or deep ocean environments, which makes extraction costly and difficult.

Figure 3 Rig Count and OPEC Oil Production
OPEC

What can we do? . Forget drilling for more oil, electric vehicles and investment into alternative energy is the only way to avert this crisis. OPEC area drilling activity is up 48% since 1998 and yet, despite dramatically higher oil prices, up 5 fold since 1998, OPEC oil production increased only 11% over 1998.

Homeowners could begin to deploy energy saving and alternative energy systems. Wind and solar energy could help reduce some of the pain. As consumer embrace hybrids, electric, and fuel cell vehicles, wind and solar should begin to offer a stronger value proposition. Energy saving tips such as compact fluorescent bulbs, on-demand hot water heaters, and thicker home insulation products should help reduce heating and cooling costs.

According to the American Wind Energy Association AWEA a turbine owner should have at least a 10 mph average wind speed and be paying at least 10 cents per Kilowatt-hour (KWH) for electricity. There are electric utility and tax credits available in some areas. There are also questions regarding zoning restrictions, and whether to connect to batteries for energy storage, or directly to your electric utility. Consult the Wind Energy Resource Atlas of the United States Wind Resource Maps to get a better understanding of wind speeds in your area.

Cost wind systems will vary depending on model and installation costs will vary by your location. The Whisper 500 from Southwest Windpower offers electric production of 538 KWK/month at 12 mph (5.4 m/s). The system weighs 155 lb (70 kg) and has blade span of 15 feet (4.5 m) and must be mounted on a tower in cement. At 538 KWH per month, that is enough energy to cover the needs a modest house with conservative electric usage. Small wind systems can range from under $1,000 to over $20,000 with a payback period of approximately five years depending on wind resources and utility rates.

Solar photovoltaic (PV) panels cost an average of $4.80 per watt according to Solarbuzz which is about $0.24 per KWH over a 20 year life of the PV system. With an average output of approximately 10.6-watts/square foot (114 w/m^2), a five KW PV systems would cover 515 square feet (47.8 sq. meters) costing approximately $36,000 before credits and tax benefits and produce about 490 KWH per month. Of course installations costs are extra, but with PV production ramping and new PV suppliers entering the market we can expect costs to decline. Federal and local tax credits as well as selling unused electric to your local utility offers economic value on the margin.

The economic value is expected to increase as costs decline and electric rates increase and we can expect significantly higher utility rates in the near future. The economics of zero carbon emissions is not even measured as a benefit to the consumer. We are just beginning to see the cost impact of extreme weather and climate change.

Consumers should try to ameliorate the rising cost of energy by investing into solar and wind. There are several companies offering complete installation services. Among these include: Akeena Solar (AKNS) in California and The Solar Center in New Jersey.

The bottom line: energy and food prices are creating a crisis for consumers globally and there are several initiatives that could help minimize the pain. In addition, the erratic weather patterns around the world may be just a prelude to climate changes due to the impact of carbon dioxide on climate, which may cost us much more in the long run. Let’s stop the drain of wealth cause by oil and invest into clean and renewable energy solutions.

Peak Oil – Time for Investments into Alternative Energy

The question of Peak Oil, first proposed by Dr. M. King Hubbert can best be illustrated by analyzing the supply and demand for oil. With use of statistics complied by Energy Information Administration (EIA) , the tenuous position our energy needs becomes more apparent. Let’s examine the latest data from the EIA to provide a picture of the global demand and supply of oil.

Oil Demand

Figure 1 Oil Demand U.S. and China
Oil Demand

From Figure 1 we can see that while the demand for oil in the U.S. has grown at a rather moderate rate in comparison to China. The demand for oil in the U.S. declined at an average annual rate of 0.4% during the 1980’s. U.S. oil demand has averaged at a 1.5% compounded annual growth rate (CAGR) during the 1990’s and 1.0% in the last five years since 2001.

In China, demand for oil is grew at 2.7% CAGR during the 1980’s and increased to 7.6% in the 1990’s. Since 2001, the demand for oil in China is growing at an 8.1% CAGR over the last five years. The strong demand for oil from China is remains unabated and is driven by growing motor vehicle usage. In nine years, at its current growth rate, China’s oil consumption will exceed the level of oil consumption the U.S. had in 1991 and in twelve years exceed our current level.

Figure 2 Oil Demand in China
China Oil

Figure 2 illustrates that the demand for oil in China is quite substantial. With the rate of growth in oil consumption in China exceeding 8% it won’t take very long to exacerbate our tenuous current energy position. Perhaps a review of oil production will shed some light on the topic.

Oil Supply

The following graphs provide a review of oil supply from the Middle East, Saudi Arabia, OPEC, Russia and surrounding Eurasia countries including the former Soviet Union.

Figure 3 Oil Production Middle East and Saudi Arabia
Saudi OIL

While oil production contracted somewhat during the 1980’s, oil production in the Middle East and Saudi Arabia has grown since 1980, but recent oil production appears constrained. Oil production in the Middle East is up 3.1% on a CAGR during the 1990’s, and has remained at that level since 2001. Saudi oil production grew 3.0% during the 1990’s, but has dropped slightly to 2.1% since 2001.

Meanwhile, among the countries of the former Soviet Union, we see oil production gaining strength. In the countries comprising the former Soviet Union (Eurasia), oil production is up 6.7% on a CAGR since 2001.

Figure 4 Oil Production Eurasia, Middle East and Saudi Arabia
Oil ME

Currently OPEC accounts for approximately 37% and Saudi Arabia 11% of the world’s oil production. Saudi Arabia is recognized as having the largest oil reserves in the world and its Ghawar oil field is the single most productive oil field in the world, according to a recent article in the Wall Street Journal . “Saudis Face Hurdle in New Oil Drilling” The Saudis are developing new fields such its Khurais field, but are finding production efforts challenging as they employ deep horizontal drilling and water injection to achieve production. Given what we glean from the EIA production statistics, achieving moderate oil production growth maybe more of a challenge then we think.

Figure 5 Monthly Oil Production
Monthly Oil

The bottom line is that our dependence on oil leaves us vulnerable not only to supply disruptions but also in trying to protect supply in countries that gravitate towards violence and terrorism. If more global efforts were employed to develop alternative energies, we could limit our dependence on oil, improve global economics by offering affordable energy to the world, and save our environment and climate – a small step for our planet.

Oil Tax could Facilitate Alternative Energy Development

Oil continues to trade above $100 per barrel with the NYMEX CRUDE FUTURE closing at $101.84 on the last day of February 2008 and the US House of Representative passes legislation to raise $18 billion in new taxes for Big Oil to foster development of alternative energies. While President Bush plans to veto the legislation and Republicans claim the legislation unfairly impacts the oil industry, let’s look at the numbers. The legislation calls $18 billion tax over the next ten years so the impact amounts to $1.8 per year. The oil demand is approximately 20.6 million barrels per day according the to latest data from the Energy Information Administration. With oil at $100 per barrel the US will spend about $2 billion a day on oil and that equates to over $750 billion a year. In comparison to the total amount of oil we use, the tax is about 2/10th of one percent.

Figure 1 US Oil Supply and Demand
US OIL

Well maybe that’s not a fare comparison. The bill, H.R. 6, the CLEAN Energy Act. would roll back two tax breaks for the five largest U.S. oil companies and offer tax credits for energy efficient homes and gas-electric hybrid vehicles.
According to the CNN article, the money to be collected over the 10-year period would provide tax breaks for solar, wind and other alternative energies and for energy conservation. The legislation was approved 236-182, and is expected to cost the five largest oil companies an average of $1.8 billion a year over that period, according to an analysis by the House Ways and Means Committee. So in other words this bill just repeals tax breaks given to Big Oil to become more competitive in the global market.

Figure 2 Oil Prices and World Rig Count
OIL PRICES

So what is the $1.8 in tax impact on Big Oil? Let’s just look at the impact this would have if just Exxon Mobil Corp (XOM) had to endure the tax only. Exxon Mobil generated $404 billion revenues in 2007, which means if Exxon had to face this tax only, it would be less than ½ of 1% of revenues. Considering that some states impose a 6% sales tax on consumers, a tax impact of 0.2% on the largest oil companies seems rather innocuous.

If the world has to depend upon OPEC oil production, questions do arise over the expansion of oil production and OPEC’s willingness to supply oil despite oil over $100 per barrel. As figure 3 illustrates production among OPEC nations is faltering. Could this be a prelude to Peak Oil?

Figure 3 OPEC Oil Production
OPEC Oil

The bottom line is that without incentives and further research on alternative energies, the world continues to be held hostage to oil and hydrocarbon fuels which are directly linked to rising CO2 levels and climate change.

Hydrogen Fuel Cells – energy conversion and storage

World oil demand continues to rise despite efforts to limit demand. Renewable energies such as solar and wind have the potential to limit our dependence on hydrocarbon fuels, but one issue remains prominent – storing energy. While the sun provides radiation for solar and generates wind, when its cloudy or dark we are unable to produce solar energy. One must provide a means to store that energy for when it is needed. Fuel cells enable energy conversion and fill a reliable role in alternative energy strategies.

A chart compiled by Wasserstoff-Energie-Systeme GmbH (h-tec) provides an easy to understand depiction of how fuel cells integrate with solar and wind energy solutions. Fuel cells provide the enabling technology that allows hydrogen to serve as the storage and transport agent. The solar energy that is produced during the daylight hours is used in an electrolyzer to produce hydrogen that in turn, is then used to operate the fuel cell producing electricity at night when it is needed. This process is called the solar-hydrogen energy cycle. Figure 1 illustrates the importance of energy storage in adopting alternative energies.

Figure 1 Solar-Hydrogen Energy Cycle
Energy Cycle

Demand for oil and hydrocarbon fuels continues to grow despite effort to conserve. Total Petroleum Consumption shows increasing oil demand from China and India while demand in the U.S. grows at a slower pace. With improving efficiencies and lower production costs, fuel cells could provide a solution to our appetite for oil in motor vehicles. Figure 2 describes how fuel cells and electrolyzers (fuels running in reverse) work.

Figure 2 Fuel Cells
Fuel Cells

Fuel cells are devices that convert chemical to electrical energy – in essence; it’s an electrochemical energy conversion device. In the chemical process of a fuel cell, hydrogen and oxygen are combined into water, and in the process, the chemical conversion produces electricity. In the electrolyzer, an electrical current is passed through water (electrolysis) and is the reverse of the electricity-generating process occurring in a fuel cell.

Hydrogen fuel cells offer tremendous opportunity for storing and transporting energy enabling broad applications for home, business, motor vehicle and large-scale energy projects. The follow provides a review of current technologies applicable to hydrogen fuel cells. Factors to consider in using hydrogen fuel cells include operating efficiency, operating temperature range, and material used for the electrolyte (the catalyst that separates hydrogen) and fuel oxidant (that transfers the oxygen atoms).

Figure 3 Hydrogen Fuel Cell Technologies
FC Technologies

One of the most practical fuel cell technologies for motor vehicle use include Proton Exchange Membrane (PEM) because it operates at normal ambient temperatures and offers high electrical efficiency. There are several useful web sites that illustrate the benefits of hydrogen fuel cells. h-tec and the National Renewable Energy Laboratory provide some very useful information on hydrogen fuel cells.

We are also seeing progress on fuel cell vehicles that could ultimately ameliorate are demand for oil, if not eliminate it entirely, all with no carbon dioxide or other harmful emissions. We see most major automakers developing hydrogen powered fuel cell vehicles. GM is making progress introducing several models using GM’s Fuel Cell Technology.
Honda’s experimental hydrogen refueling station in Torrance, CA uses solar to produce hydrogen for their hydrogen fuel cell vehicle Honda’s FCX .

The bottom line is that the availability of cheap oil is on the decline and without further research on alternative energies we may find the global economy in a very tenuous position. Further research into solar and hydrogen fuel cells could significantly reduce our dependence on oil.