Energy Crisis – What Can We Do

As energy and food prices set new world records, what can we do at home to avert the crisis? Food prices are rising because corn is diverted from food production to producing ethanol for use as fuel in motor vehicles and is exacerbated by the recent flooding in the Mid West. Oil prices continue to escalate as demand for oil in developing countries increases and supply constraints, rising production costs, and limited refining capacity constrain the supply of oil. These factors continue to weigh against homeowners that will face escalating fuel bills to heat or cool their homes. There are some viable alternative energy solutions including wind and solar as well as home insulation that should offset the rising cost of energy. As far as food for fuel, we need to break our dependence on hydrocarbons which continues to impact our climate and weather and transfer our wealth to oil producing nations

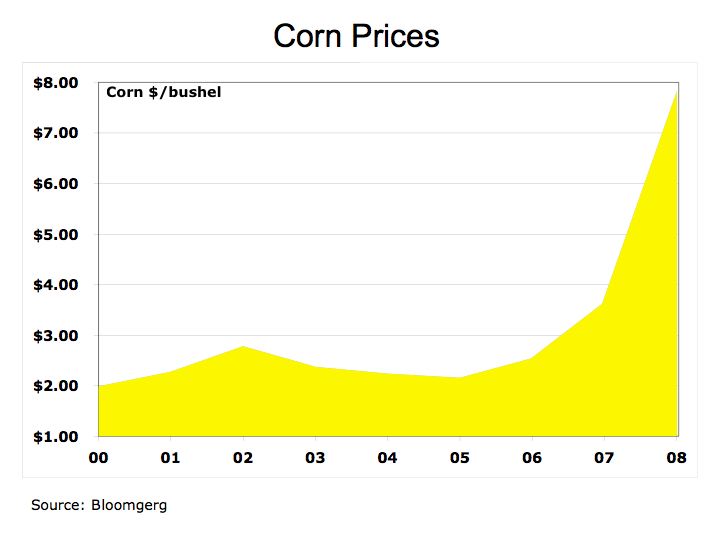
Corn Prices have increased 264% since 2005. The rising price of corn used for ethanol is causing farmers to plant more corn and less production of other grains such as wheat or soy. Lower supply of grains is driving up food prices. Rising food prices is most debilitating to the poor, especially those in developing countries.

Figure 1 Corn Prices
Corn

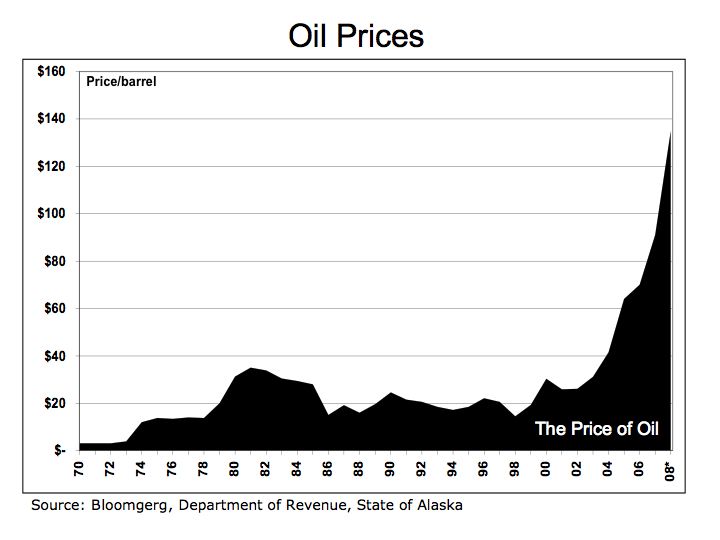
Growing demand for oil and questions over Peak Oil suggesting even with oil prices rising to such an elevated level, production is rather anemic. According to the Energy Information Administration (EIA) , while oil prices increased 344% since 2001, oil production from OPEC is up only 1.2% over this same period.

Figure 2 Oil Prices
Oil

According to the EIA The demand for oil in China is growing at an 8.1% CAGR over the last five years. With demand for oil growing significantly in developing countries and despite production developments in Saudi Arabia and the 5-to-8 billion deepwater Tupi oil discovery in over Brazil The Tupi announcement in January 2008 is the world’s biggest oil find since a 12-billion-barrel field discovered in 2000 in Kazakhstan according the International Herald Tribune. These new oil discoveries are often in inhospitable areas or deep ocean environments, which makes extraction costly and difficult.

Figure 3 Rig Count and OPEC Oil Production
OPEC

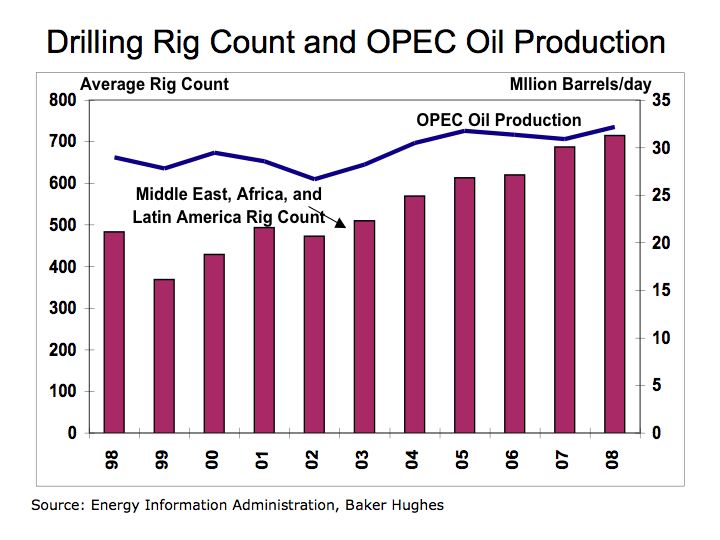
What can we do? . Forget drilling for more oil, electric vehicles and investment into alternative energy is the only way to avert this crisis. OPEC area drilling activity is up 48% since 1998 and yet, despite dramatically higher oil prices, up 5 fold since 1998, OPEC oil production increased only 11% over 1998.

Homeowners could begin to deploy energy saving and alternative energy systems. Wind and solar energy could help reduce some of the pain. As consumer embrace hybrids, electric, and fuel cell vehicles, wind and solar should begin to offer a stronger value proposition. Energy saving tips such as compact fluorescent bulbs, on-demand hot water heaters, and thicker home insulation products should help reduce heating and cooling costs.

According to the American Wind Energy Association AWEA a turbine owner should have at least a 10 mph average wind speed and be paying at least 10 cents per Kilowatt-hour (KWH) for electricity. There are electric utility and tax credits available in some areas. There are also questions regarding zoning restrictions, and whether to connect to batteries for energy storage, or directly to your electric utility. Consult the Wind Energy Resource Atlas of the United States Wind Resource Maps to get a better understanding of wind speeds in your area.

Cost wind systems will vary depending on model and installation costs will vary by your location. The Whisper 500 from Southwest Windpower offers electric production of 538 KWK/month at 12 mph (5.4 m/s). The system weighs 155 lb (70 kg) and has blade span of 15 feet (4.5 m) and must be mounted on a tower in cement. At 538 KWH per month, that is enough energy to cover the needs a modest house with conservative electric usage. Small wind systems can range from under $1,000 to over $20,000 with a payback period of approximately five years depending on wind resources and utility rates.

Solar photovoltaic (PV) panels cost an average of $4.80 per watt according to Solarbuzz which is about $0.24 per KWH over a 20 year life of the PV system. With an average output of approximately 10.6-watts/square foot (114 w/m^2), a five KW PV systems would cover 515 square feet (47.8 sq. meters) costing approximately $36,000 before credits and tax benefits and produce about 490 KWH per month. Of course installations costs are extra, but with PV production ramping and new PV suppliers entering the market we can expect costs to decline. Federal and local tax credits as well as selling unused electric to your local utility offers economic value on the margin.

The economic value is expected to increase as costs decline and electric rates increase and we can expect significantly higher utility rates in the near future. The economics of zero carbon emissions is not even measured as a benefit to the consumer. We are just beginning to see the cost impact of extreme weather and climate change.

Consumers should try to ameliorate the rising cost of energy by investing into solar and wind. There are several companies offering complete installation services. Among these include: Akeena Solar (AKNS) in California and The Solar Center in New Jersey.

The bottom line: energy and food prices are creating a crisis for consumers globally and there are several initiatives that could help minimize the pain. In addition, the erratic weather patterns around the world may be just a prelude to climate changes due to the impact of carbon dioxide on climate, which may cost us much more in the long run. Let’s stop the drain of wealth cause by oil and invest into clean and renewable energy solutions.

Blame high food and energy prices on the White House

With the infinite wisdom of the White House and U.S. Congress, food prices are now directly tied to the price oil. The price of corn-based ethanol is now determined by the price of gasoline that it substitutes in motor vehicles and that price is established by supply and demand for oil. The price of gasoline at your local gas station or convenience store is based on the price of oil. And now that the price of corn is rising because it is tied directly to oil, the price of other grains and subsequently, prices along the entire food chain are rising.

Corn Prices have increased 166% since 2005. The rising price of corn that is used to produce corn ethanol is causing farmers to direct their limited resources to grow more corn, which means other grains such as wheat or soy become scarce and their prices rise. The growing scarcity of grains for food products is raising price across the food chain. Developing a renewable energy solutions based on diverting food as a substitute for expensive gasoline forces food supplies to become scare and expensive.

It is the supply and demand for gasoline and diesel fuels that establishes the price at the pump. When corn ethanol is substituted for gasoline, prices tend to gravitate towards a mean price that continues to rise to keep pace with the escalating price of crude oil now over $110 per barrel. Corn prices are inextricably linked to oil prices and in turn; corn prices impact other grain prices that means it cost more to feed your family or to feed livestock and forces those prices higher.

The rise in corn prices is illustrated in Figure 1.

Figure 1 Corn Prices
Corn Prices

Irrespective of the timing of Peak Oil, a long-term energy strategy is required. The days of cheap oil are over. Remember how oil production in Alaska helped ease the U.S demand for foreign oil a couple of decades ago. Oil production in Alaska declined by nearly 75 percent from its peak in 1987 according a Washington Post article back in 2005. In November 2007, the Petroleum News indicated production in Alaska is expected to decline further in the future. The U.S. depends on oil production in the Gulf of Mexico for about 25% of our supply, according to the Department of Energy which is why the impact from Hurricane Katrina was so devastating.

Diminishing supply and rising demand suggests oil prices should continue to remain elevated. The rising motor vehicle usage in China (China Motor Vehicle Registration)
and India continues to influence the demand for oil.

Figure 2 Vehicle Registrations in China
China Vehicles

Figure 2 and Figure 3 illustrate the rising use of motor vehicles in developing countries. This trends should continue and in turn, increase the demand for oil.

Figure 3 Automobile Sales in India
Cars India

Maybe we should look to some leading countries in the development of alternative energy strategies. Perhaps we can learn from Norway’s HyNor Project. Solar photovoltaic projects being lead by Germany
and Spain.

So the next time you fill your tank or when you’re at your local food store and find that your wages don’t quite cover your food bill, ask your local Congressional representative for better planning on alternative energy strategies and solutions. Investment and research into solar, wind, electric vehicles, and hydrogen energy could provide real solutions by addressing energy needs, climate concerns, the environment, and food prices.

Ethanol offers short-term solutions, but corn-based ethanol is not the answer

Ethanol may emit less CO2 and help reduce the demand for foreign oil in the short term, but ethanol and in particular, corn-based ethanol raises food prices, is less efficient than gasoline, diesel, and biodiesel, and is not a substitute for oil.

According to research compiled by National Geographic Magazine , the energy balance of corn ethanol, (the amount hydrocarbon fuel required to produce a unit of ethanol) is 1-to-1.3 whereas for sugar cane ethanol the ratio is 1-to-8. This suggests corn-based ethanol requires significantly more energy to produce than sugar cane ethanol. Corn ethanol is only marginally positive.

A major issue with corn ethanol is its impact on corn prices and subsequently, food prices in general. It is the price of oil that is impacting the price of corn because nearly all ethanol produced in the U.S. is derived from corn. Therefore, corn prices are inextricably linked to oil prices as well as to the supply and demand of corn as food and feedstock. Corn Prices while volatile and impacted from weather and other variables appear to follow the rising price of oil as illustrated in Figure 1. In turn, corn prices are also influencing other commodity prices where corn is used for feed for livestock.

The rising motor vehicle usage in China and India is escalating the already tenuous situation in the oil markets. With ethanol tied to oil prices we are beginning to see corn prices exacerbate the inflationary pressures at the retail level. Over the last year consumers are paying more for food with large increases in the prices of eggs, cereal poultry, pork, and beef which are tied to corn.

Figure 1 Corn Prices
Corn Prices

Senate legislation for Renewable Fuels Standard calls for ethanol production to increase to 36 billion gallons by 2022 with 21 billion derived from as cellulosic material such as plant fiber and switchgrass . Corn is expected to comprise 42% of the ethanol production in 2002 from virtually all today. The fact is that ethanol production at its current level of 6 billion gallons equates to only 4% of our gasoline usage and is already impacting food prices. Gasoline consumption in 2005 amounted to 3.3 billion barrels or 140 billion gallons. Current estimates put gasoline consumption at 144 billion gallons a year in 2007. Even if vehicles could run entirely on ethanol, there is not enough corn harvest to substitute our demand for oil. We need a cohesive and coordinated effort using multiple technologies to develop alternative energies to reduce our dependence on foreign oil.

Performance

According to Renewable Fuels Association ETHANOL FACTS:
ENGINE PERFORMANCE,
ethanol offers higher engine performance with octane rating of 113 in comparison to 87 for gasoline and has a long history in the racing circuit. In 2007, the Indy Racing League, sponsors of the Indianapolis 500 started using ethanol in racecars. However, the higher engine performance may come at a cost of lower fuel efficiency.

Table 1 Specific Energy, Energy Density & CO2
Specific Energy

Efficiency

Gasoline offers 56% higher energy efficiency (specific energy) over ethanol as measured by kilo-joules per gram (kj/g). (As a reference: 1 kilowatt-hour = 3,600 kilojoules = 3,412 British Thermal Units) Biodiesel with 35 kj/g is 33% more energy efficient than ethanol at 24.7 kj/g.

In terms of energy density, ethanol would require larger storage capacity to meet the same energy output of gasoline diesel, and biodiesel. Ethanol requires a storage tank 48% larger than gasoline and 41% larger than diesel for the same energy output.
Please see Hydrogen Properties and Energy Units

For a quick review of Specific Energy and Energy Density – (Molecular Weight Calculator) the specific energy of a fuel relates the inherent energy of the fuel relative to its weight and is measured in kilo-joules per gram.

CO2 Emission

The molecular weight of CO2 is approximately 44 with two oxygen molecules with an approximately weight of 32 and one carbon atom with a weight of 12. During the combustion process, oxygen is taken from the atmosphere producing more CO2 then the actual weight of the fuel. In the combustion process a gallon of gasoline weighing a little over six pounds produces 22 pounds of CO2.

CO2 emission is a function of the carbon concentration in the fuel and the combustion process. During combustion ethanol produces approximately 13 pounds of CO2 per gallon. Gasoline and diesel produce approximately 22 and 20 pounds per gallon, respectively. CO2 emissions per gallon appear quite favorable for ethanol. However, the results are less dramatic when CO2 emissions are compared per unit of energy produced.

Figure 2 CO2 per KWH
CO2 / KWH

When measured in pounds of CO2 per kilowatt-hours (KWH) of energy, the results show ethanol producing 6% less CO2 than diesel or biodiesel and 5% less than gasoline. In the case of ethanol, the lower specific energy of the fuel negates the benefit of its lower CO2 emissions. Meaning more ethanol is consumed to travel the same distance as gasoline or diesel thereby limiting the benefit of its lower CO2 emissions.

The bottom line is ethanol does not ameliorate our dependence on foreign oil and while it demonstrates higher performance for racecars, it is still less efficient than gasoline diesel, and biodiesel, and diverts food production away from providing for people and livestock. The reality is there are special interest groups that obfuscate the facts about ethanol for their own benefit. The real solution to our imminent energy crisis is alternative energies including cellulosic ethanol, solar, hydrogen fuel cells, and wind.

With choices like Biodiesel and Ethanol, what’s the best fuel for your vehicle?

With the rapid growth in vehicle use around the world, it would be nice to know what are the most efficiency, economic, and least carbon emitting fuels. The number of motor vehicles on the road is increasing rapidly. The number of cars and trucks in China is up over 3,600 percent in the last thirty years. Data from the U.S. Department of Energy (DOE) and Ward’s Communications, Ward’s World Motor Vehicle Data provide an interesting view of the growth in motor vehicle use.

Figure 1 China Truck and Car Registration
China Vehicles

While the U.S. still accounts for the largest motor vehicle market, the rest of the world is quickly accelerating towards more vehicles on the road. Figure 2 shows the number of vehicle registrations over the last thirty years for China, the U.S. and the rest of the world (ROW). Vehicle registration growth in the U.S. has been growing at a 2% per year rate from 1975 to 2005. The largest growth in vehicle registration is in China and India where growth in the last ten years is up 195% and 99%, respectively.

Figure 2 World Vehicle Registration
World Vehicles

With an explosion in motor vehicle use, what fuel should we be using to better performance and reduce emissions? Let’s go back to two basic concepts of energy: Specific Energy and Energy Density. For a quick review, (Molecular Weight Calculator) the specific energy of a fuel relates the inherent energy of the fuel relative to its weight. Specific energy is often measured in kilo-joules per gram (kj/g). One kilo-joule equals one kilowatt-second meaning one kilowatt-hour (KWH) equals to 3,600 kilo-joules. Also one British Thermal Unit (BTU) equals 1,055.05585 joules. A reference to the specific energy and energy values of most fuels can be found at Hydrogen Properties

Figure 3 Specific Energy
Specific Energy

By specific energy hydrogen is the clear leader. However, vehicles must inherently carry their fuel supply, so to determine which fuel is best for motor vehicles, energy density of the fuel is the next measurement. While vehicle fuel efficiency is dependent upon a number of factors such as engine type and performance, make and model of vehicle, road conditions and fuel, we are focusing on fuel energy.

Figure 4 Energy Density: KWH per Gallon
Energy Density

Figure 4 illustrates how fuels compare with respect to energy density, that is, energy relative the container size. We again are using KWH to measure energy value. Hydrogen, because it is so light, requires 15.9 times the container volume to provide the same energy as diesel. Biodiesel provides more power per gallon than Ethanol, which requires 1.6x, the container size for the same amount of energy as diesel. Biodiesel and diesel are relatively similar with respect to energy density. While both Ethanol and Biodiesel are both form of renewable energy, Biodiesel offers more bang per gallon. Before we are able invest more into hydrogen and solar energy to bring alternative energy into parity with conventional hydrocarbon fuels, diesel and biodiesel offer better energy efficiency among hydrocarbon fuels.

Table 1 Specific Energy, Energy Density & CO2
Specific Energy

As a final assessment of hydrocarbon fuels, let’s compare carbon dioxide (CO2) emissions among our list of fuels. CO2 emission is a function of carbon concentration and combustion process of the fuel. Fuel energy research at the Department of Environmental Protection (EPA) and DOE indicate 99% to nearly 100% combustion of with fuels used in vehicles. That means almost all of the atoms in the fuel are converted to either heat or byproducts such as CO2.

Figure 5 illustrates how much CO2 is produced per gallon of fuel. Remember the molecular weight of CO2 is about 44 with oxygen contributor nearly 73% of the weight and is taken from our atmosphere during combustion. This is why more CO2 is created than the actual weight of the fuel. A second factor needs to be considered when evaluating CO2 emission and that is how much CO2 is produced per energy value. In comparing CO2 emissions per KWH of energy, Ethanol produces about 7% less CO2 than diesel or Biodiesel and 5% less than gasoline. Neither of these estimates considers the emissions from the processing to produce Ethanol or Bioiesel.

Figure 5 CO2 per Gallon
CO2

The bottom line is Ethanol and Biodiesel provide marginal relief to our energy crisis with biodiesel offering better efficiency and Ethanol marginally less CO2 missions. The only real solution to our imminent energy crisis is alternative energies such as solar, hydrogen fuel cells, and wind.

Home Heating Concerns

With oil prices over $80 per barrel, the National Energy Assistance Directors’ Association in its press release today Record Home Heating Prices for Heating is expecting the average home heating cost for the ’08-’08 season to rise 9.9%. For homeowners using oil heat, heating costs are expected to increase 28% and for homes using propane, a 30% increase is expected.

With rising energy costs driven by costly oil extraction, the potential impact from carbon emissions with our continuing use of oil on climate change and rising sea levels, as well as the potential for fuel supply disruptions, could exacerbate our tenuous relationship with energy.

Eventually, as price rise dramatically, alternative energy becomes more compelling. The problem is our economy is so inextricably link to oil, that our energy security is based on securing foreign oil.

Figure 1 Oil Prices and Home Heating CostsHome Heating

Without support and research on alternative energies such as solar and fuel cell technologies, we are hostage to oil. The U.S. economy is facing one of the most crises since the Oil Embargo of the 1973. Inflation driven by escalating oil prices is impacting the cost of home heating, transportation, production, materials, and food, particularly as corn is diverted to ethanol production. The housing market is in turmoil with falling home values, rising foreclosures, and a credit crisis that is making it more difficult to secure a mortgage may lead to slower consumer spending. With rising inflation and slower growth we may find ourselves in an economic world described as stagflation that was coined in the ’70’s to describe the bleak environment when gas stations rationed fuel, unemployment grew and the Federal Reserve raised rates dramatically to quell inflation.If we could limit our dependence on foreign oil through investment into solar energy and fuel cell technologies, we would not be impacted by the exogenous events in oil producing nations.

We believe there are a number of catalyst that could serve to dramatically lower the cost of alternative energies. It takes initiatives from all of us to change the balance. After all, oil is becoming more costly to extract, new oil discoveries are in difficult and challenging environments, and oil will eventually run out – it is finite. If we wait to long, our ability to make a difference may not be available.

Hostage to Oil

Without greater investment into solar and hydrogen energies, we are held hostage to rising oil prices. Alternative energies such as solar and hydrogen fuel cells offer tremendous potential to provide energy independence and energy security. The dependence of the U.S. upon imported foreign oil raises inflation, weakens our currency, exacerbates the trade deficit, and forces consumers to pay higher prices for home heating and transportation. With oil exceeding $80 a barrel in late September 2007, the only beneficiaries are countries exporting oil and oil conglomerates. I guess when countries such as Dubai, after accumulating a large trade surplus based on inflated oil prices, decides to diversify away from oil and buy a non-voting stake in the NASDAQ market, it’s a wake-up call.

To better understand the potential of alternative energy, we should try to understand two basic concepts of energy: Specific Energy and Energy Density. Without digressing into chemistry 101, (Molecular Weight Calculator) the specific energy of a fuel relates the inherent energy of the fuel relative to its weight. Typically, specific energy is measured in kilo-joules (kj) per gram. A joule is a measure of kinetic energy – one joule is the amount of energy needed to move two kilograms at a velocity of one meter per second. Or a kilo-joule equals one kilowatt-second meaning one kilowatt-hour (KWH) equals to 3,600 kilo-joules. Your local electric utility bills you by the KWH, which according to the US Department of Energy Average Retail Price of Electricity in 2007 is approximately $0.11 per KWH.

Table 1 Specific Energy and Energy Density
Specific Energy

The specific energy of a fuel tells us how much energy can be derived from a measured amount fuel by weight. By ranking each fuel by its specific energy, one can determine how efficient each fuel is. Specific energy and fuel density are often proportional to the ratio of carbon and hydrogen atoms in the fuel. A reference to the specific energy and energy values of most fuels can be found at Hydrogen Properties

Figure 1 Specific Energy
Specific Energy
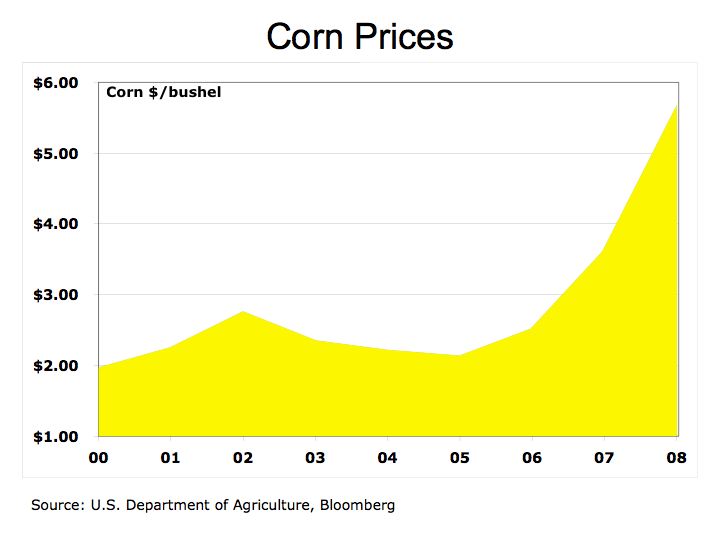
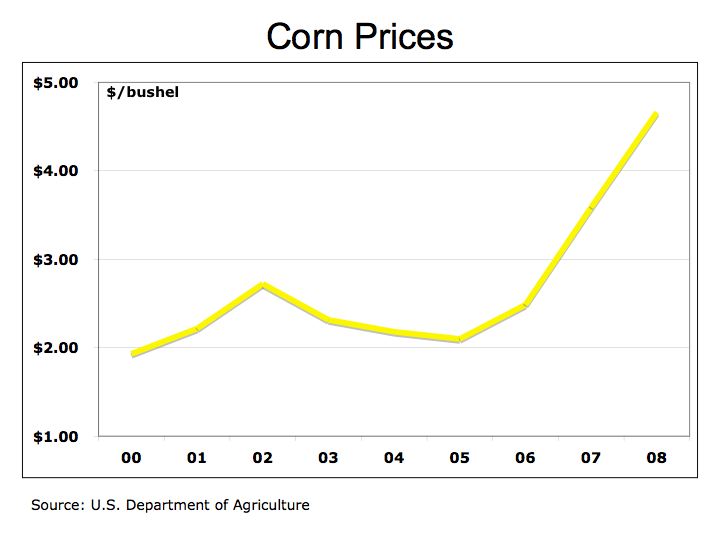
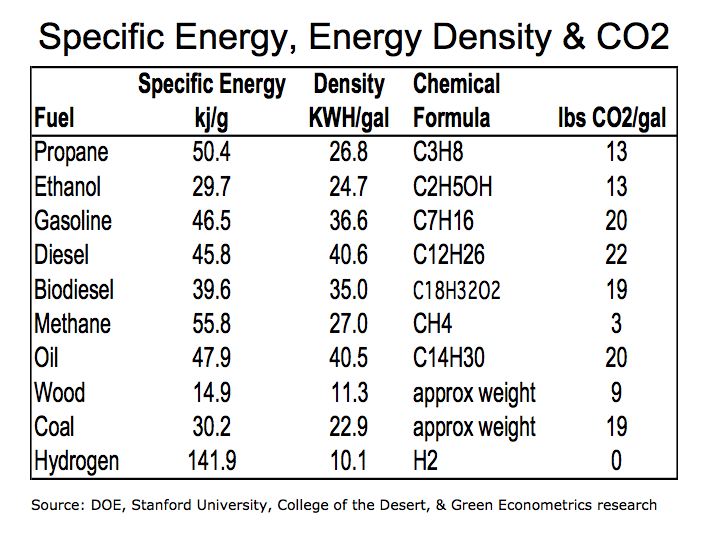
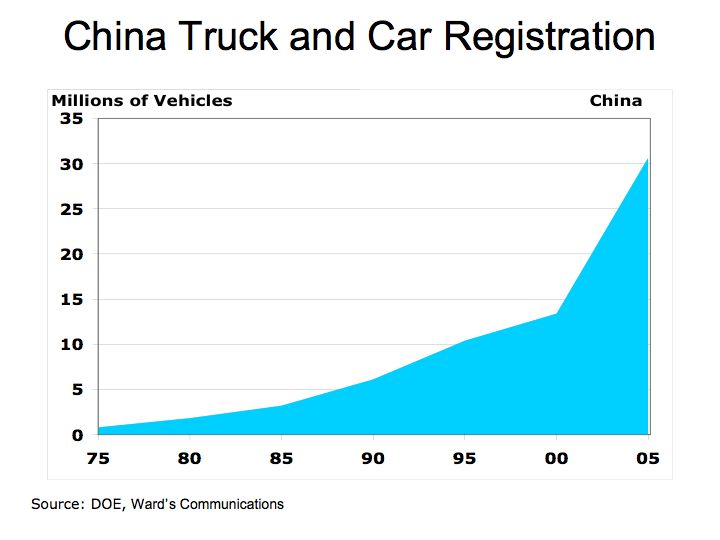
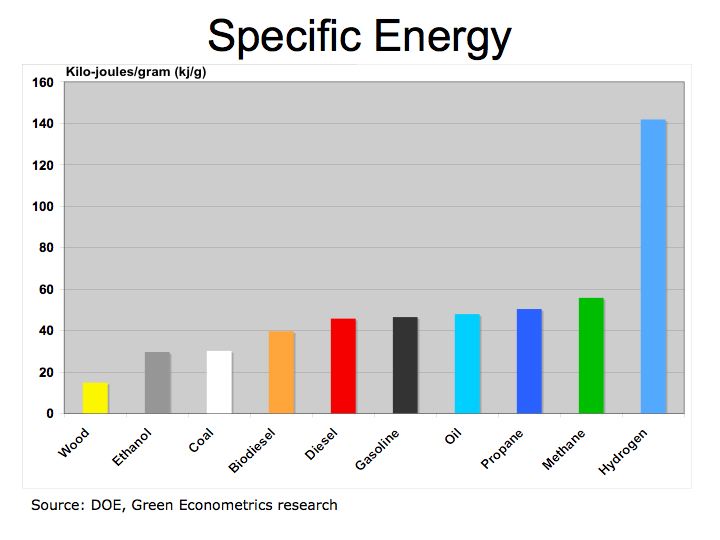
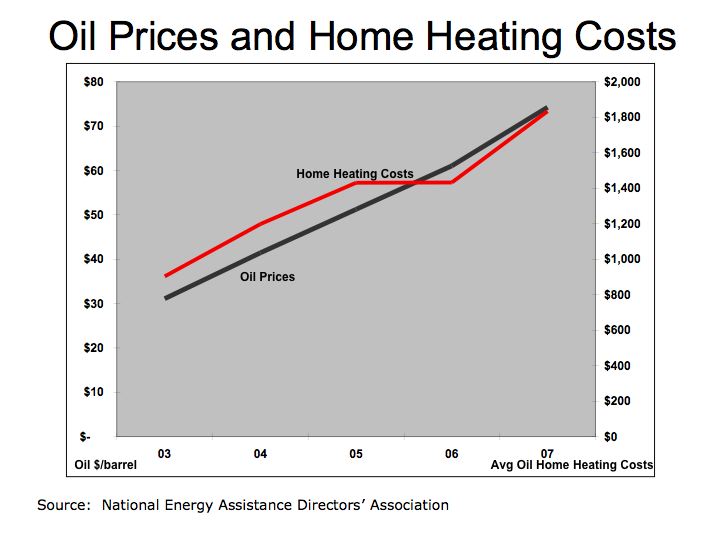
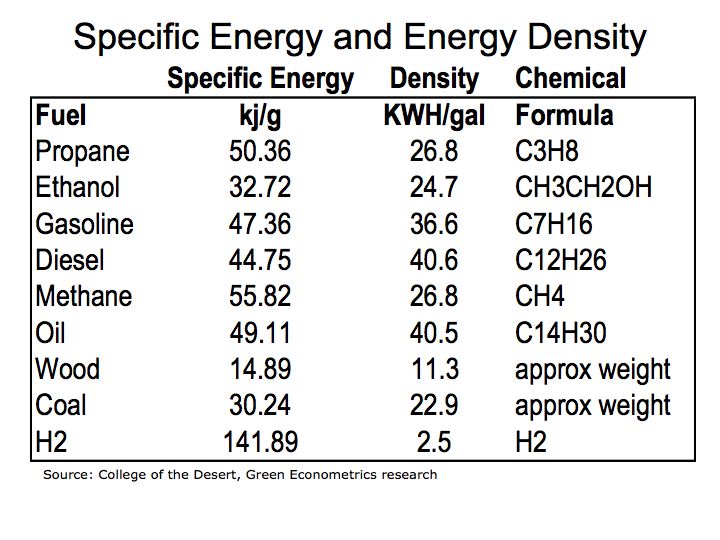
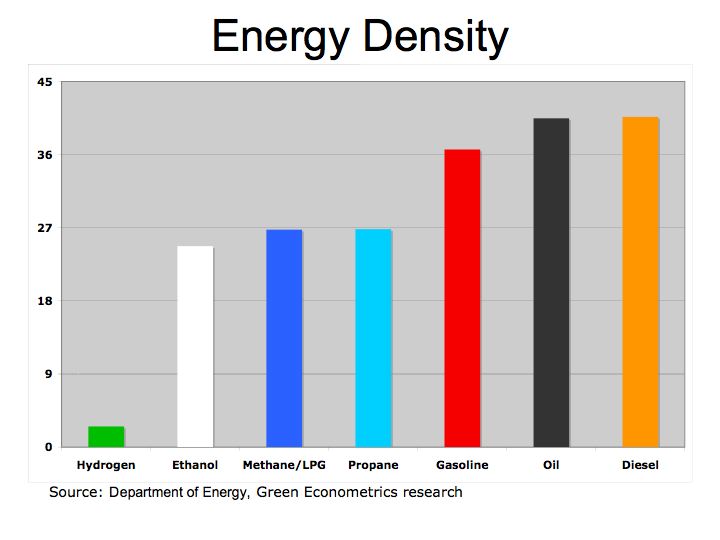
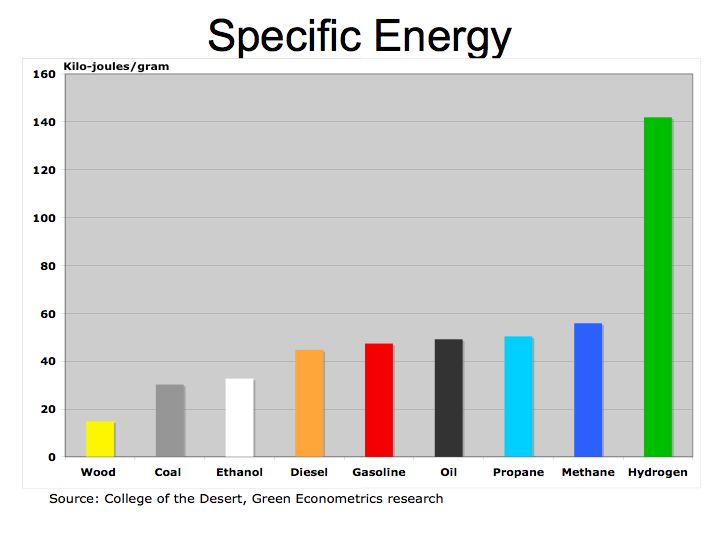
Figure 1 illustrates how fuels compare according to their specific energy. As we can see, hydrogen, because it’s extremely light, has the highest specific energy in comparison to hydrocarbon fuels.

This however, is not the full story because volume or energy storage requirement becomes a significant factor for gaseous fuels. Specific energy is important to analyze fuel efficiency by weight, but for hydrogen that must be pressurized and cooled to bring to a liquid state, the energy density become more relevant to fuel efficiency.

Figure 2 Energy Density: KWH per Gallon
Energy Density

Figure 2 illustrates how fuels compare according to their energy density, that is, energy relative the container size. As we can see from figure 2, hydrogen, because it is so light, requires 15.9 times the container volume to provide the energy of diesel or oil. In comparison to diesel, ethanol requires 1.6x the container size for the same amount of energy.

The container size becomes a significant detriment for housing hydrogen. Energy density is usually measured in kilo-joules per cubic meter (kj/m3). As kilo-joules are readily translated into KWH by multiplying by the number of seconds in an hour (3,600) and the College of the Deserts’ computation into gallons, we are converting the data into KWH per gallon for those of us in the U.S.

Hydrogen fares poorly relative to energy density. However, technology offers an approach to enhance the benefits of hydrogen with fuel cells. Fuel cell enable hydrogen molecules to interact with oxygen through a membrane that allows transmission in only one direction to convert H2 into an electric current to power your automobile. Fuel Cell Basics Fuel cells often capture the hydrogen electron from hydrocarbon fuel such as methane allow convention fuels to generate hydrogen for electric generation.

In a hydrogen-based economy, solar energy can provide electric to generate hydrogen through electrolysis and vice versa. Jeremy Rifkin’s The Hydrogen Economy eloquently illustrated the hydrogen economy where fuel cell act as mini power plants and the electric network resembles the Internet where cars plug into an electrical grid supplemented by solar cells at your home and work. Electric power generation moves from large utility generation to a distributed generation – everyone plugged in can generate power to the grid. The key benefit of hydrogen is that it democratizes the energy economy bringing power to all countries in the world.

An interesting technical analysis of hydrogen energy is provided by Ulf Bossel and Baldur Eliasson Energy and the Hydrogen Economy The bottom line is that solar and hydrogen energies offer tremendous potential to low long-term fuel costs and improve our environment and climate. More research is required to lower costs and improve feasibility.

Ethanol: Benefits and Issues

There are several studies evaluating ethanol as fuel for transportation that offer both positive and negative impacts from ethanol. On the positive side there is less CO2 emitted from ethanol than conventional hydrocarbon fuels, domestic producers gain economic value from employment and purchasing power, and there is less dependence on foreign oil. Other studies have concluded less efficiencies from ethanol such as negative energy values because of the fertilizers and energy used to produce ethanol is larger than the amount of energy produced, CO2 is released during the fermentation and combustion process, and it still must be blended with hydrocarbon fuels leaving us dependent on foreign oil.

Ethanol is alcohol-based fuel made from crops. Fermenting and distilling starch crops, typically corn, into simple sugars produce ethanol. Chemically ethanol is similar to hydrocarbon fuels in that they both contain carbon and hydrogen atoms.

To understand the economics, let’s compare ethanol to hydrocarbon fuels by efficiency and costs. The first step is to convert the BTU (British Thermal Unit) value of ethanol into Kilowatt-Hours (KWH) in order to have a common measure of energy. Remember the KWH is a useful measure of energy because we can equate KWH to engine horsepower performance and compare hydrocarbon fuels to alternative energies like solar and wind and compare these energy costs on a common level.

Our fuel energy conversion links Energy Units and Conversions KEEP, and Fuel BTUs provide some useful measures to evaluate ethanol in comparison to hydrocarbon fuels like diesel and gasoline.

One KWH equals 3,413 BTUs so we divide the BTU value for each fuel by 3,413 to arrive at its corresponding KWH energy value.

Energy Comparison
1 gallon of ethanol = 84,400 BTUs = 24.7 KWH
1 gallon of diesel = 138,690 BTUs = 40.6 KWH
1 gallon of gasoline = 125,000 BTUs = 36.6 KWH
1 gallon of oil = 138,095 BTUs = 40.5 KWH

Figure 1 Kilowatt-Hours per GallonKWH per Gallon

As seen from figure 1, ethanol is not the most efficient fuel because of its low BTU value in comparison to hydrocarbon fuels. However, ethanol is a form of renewable energy because the crops can be grown to generate more fuel.

Energy Economics

To compare the energy cost of ethanol to hydrocarbon fuels we convert each fuel into a cost per KWH. Our prices are quarterly average U.S. energy prices by fuel type: Ethanol Prices, , and Oil Prices

Figure 2 Cost per Kilowatt-HoursEnergy Costs

On a cost per KWH basis, ethanol is similar to hydrocarbon fuels. So depending on current fuel cost, which varies by location, ethanol could be higher or lower than diesel or gasoline.

On the production of ethanol a bushel of corn produces about 2.76 gallons of ethanol according a study by AgUnited . According to U.S. Department of Agriculture it takes 57,476 BTUs of energy to produce one bushel of corn Energy Balance of Corn Ethanol therefore, for BTU of energy used to produce ethanol there are 4 BTUs of energy gained from the ethanol for transportation.Carbon EconomicsEthanol is produced from fermentation of starch to sugars and is represented by the equation C6H12O6 = 2 CH3CH2OH + 2 CO2 according to University of Wisconsin Chemistry Professor Bassam Z. Shakhashiri The two CO2 molecules given off from the fermentation process of ethanol does add to CO2 emissions, but the growing process and biomass also extract CO2 from the atmosphere.

Emission of CO2 from hydrocarbon fuels depends on the carbon content and hydrogen-carbon ratio. When a hydrocarbon fuel burns, the carbon and hydrogen atoms separate. Hydrogen (H) combines with oxygen (O) to form water (H2O), and carbon (C) combines with oxygen to form carbon dioxide (CO2). How can a gallon of gas produce 20 pounds of CO2 To measure the amount of CO2 produced from a hydrocarbon fuel, the weight of the carbon in the fuel is multiplied by (44 divided 12) or 3.67. For ethanol we compared its basic structure to gasoline, diesel, and crude oil.

In the combustion process, ethanol produces CO2 at a rate that is below that of gasoline. The equation for ethanol combustion is C2H5OH + 3 O2 –> 3 H2O + 2 CO2. Ethanol Combustion In our simple example, the carbon weight in ethanol (two carbon with a combined atomic weight of 24 to a total weight of 46 for the molecule of C2H5OH) is multiplied by 3.67 to determine the amount of CO2 produced from ethanol. We then compared the output of CO2 to the amount of energy produced to arrive at pounds of CO2 per KWH. Bottom line is that ethanol emits 11% less CO2 than gasoline and is a renewable fuel.

Figure 3 Pounds of CO2 by Fuel TypeEthanol CO2

There are several studies on ethanol with the majority indicating benefits. Some of these include: High-level ethanol blends reduce nitrogen oxide emissions by up to 20% and ethanol can reduce net carbon dioxide emissions by up to 100% on a full life-cycle basis. Ethanol Benefits and Clean Cities While ethanol produces less CO2 than gasoline, it still emits CO2 and keeps us dependant upon hydrocarbon fuels.

For further information on fuel combustion Combustion Equations and for Energy to Produce Ethanol Ethanol Production