Category Solar Energy Economics

Infrastructure Investment: Electric Vehicles and Smart Grid

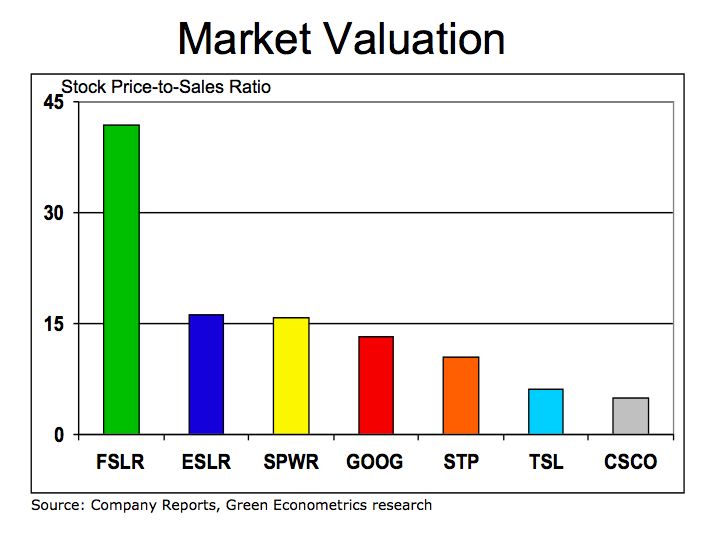
After several months in Silicon Valley three factors resonate clearly in the process of innovation: access to data, applied analytics, and time to insight. Innovative ideas and technology can just as easily be spawned in New Jersey or Milan as in Silicon Valley. Our focus is why investment into infrastructure that facilitates access to energy or commerce, is the critical factor in game changing events.

Investment onto infrastructure to support access to energy enabled New York City to gain prominence over Philadelphia and Boston as the largest economic center in the US. Access to energy can be traced back to 1829 when the first American steam locomotive in Honesdale, PA initiating the American Railroad to transport Anthracite coal mined in nearby Carbondale to a canal network ultimately linking to the Hudson River and New York City. See post Coal: Fueling the American Industrial Revolution to Today’s Electric

As a corollary, in demonstrating the importance of investing into infrastructure to support economic growth, this is the tale of two Southern cities. In the 1950’s, Memphis, TN and Atlanta, GA were roughly the same size. While Memphis enjoyed economic growth from its port on the Mississippi River, Atlanta was land locked. Atlanta strategically invested by focusing on the future of jet aircraft building the infrastructure for the largest airport in the US in 1961. Within 10 years Atlanta had double the population and economic growth of Memphis. Today Atlanta has an economy five times that of Memphis because of innovative thinking and investment into infrastructure of the future.

Figure 1 Infrastructure: Tale of Two Cities Infrastructure
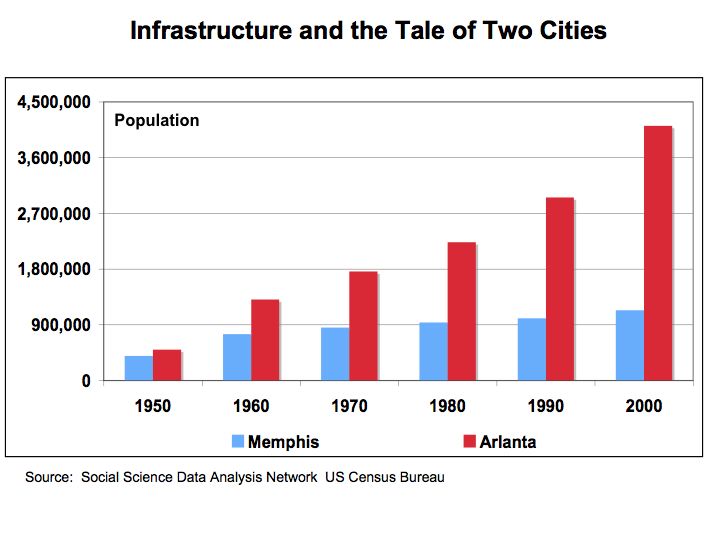
Source: Social Science Data Analysis Network

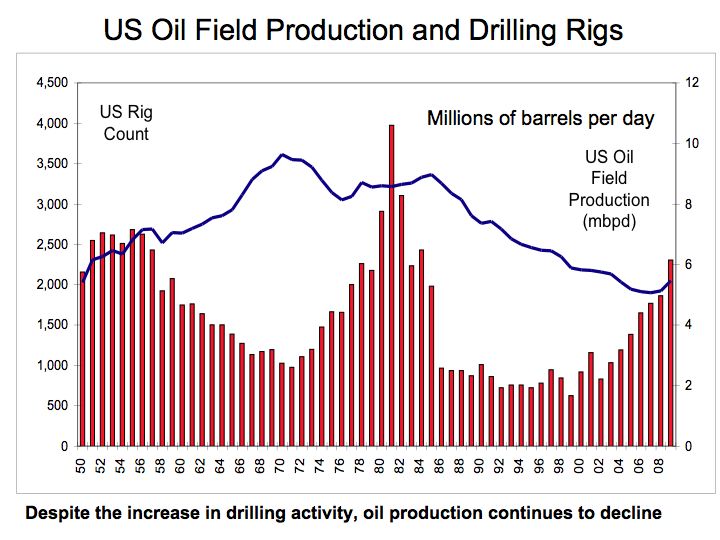
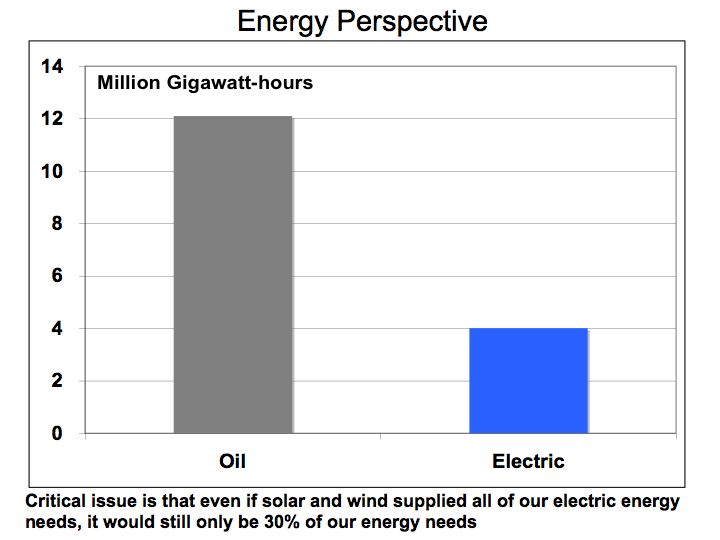
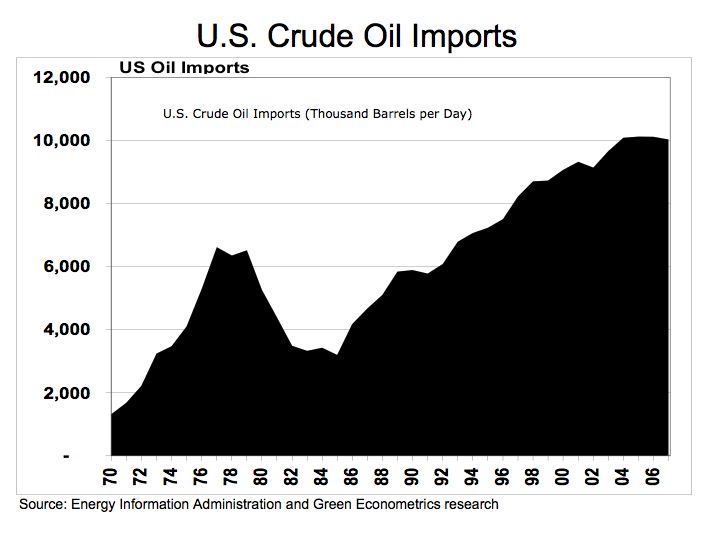
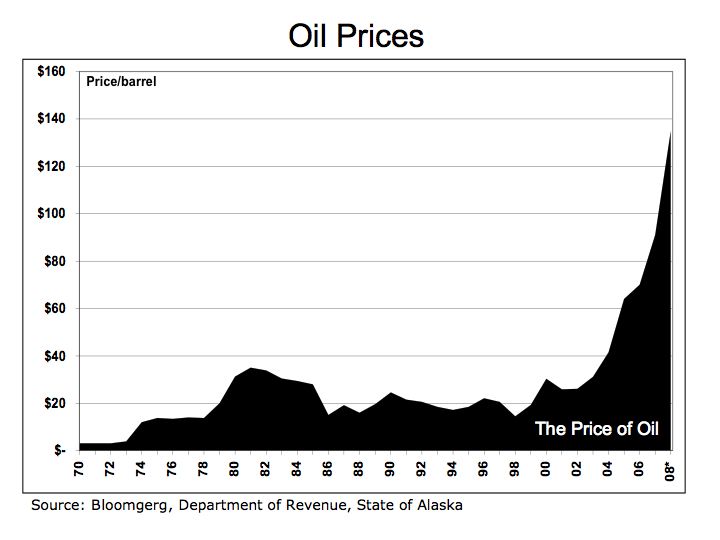
Electric vehicles (EV) and energy storage are perhaps the most important energy strategy second to renewable energy such as solar photovoltaic. The reason EV is so important to a national energy strategy is the fact that oil used for transportation accounts for more than twice the energy required to supply the entire electric needs of the US market. See the Green Econometrics post Energy Perspective The issue is formulating an effective energy strategy that embraces renewable energy and smart grid technologies.

Figure 2 US Electric VehiclesElectric Vehicles
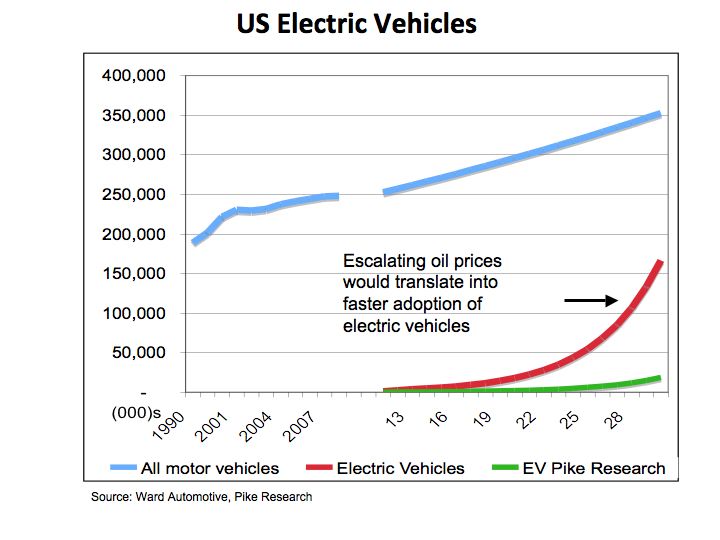
Source: Ward Automotive, Pike Research, Green Econometrics

Just how critical is infrastructure to supporting electric vehicles?

According to information from Tesla Motors’ registration filings with the SEC in June 2010, the charge time on the Tesla Roadster using a 240 volt, 40 amp outlet to full capacity takes approximately 7 hours. Assuming most drivers are in their vehicles for work five days a week and one day on the weekend, the electric energy consumption to charge the electric vehicle amounts to approximately 67 KWH a day and for a six-day per week charging, 20,966 KWH per EV per year.

According to the DOE Energy Information Administration, the average residential home consumes about 11,000 KWH a year. So the electric vehicle is roughly double is energy use of a typical home. Given capacity constraints in electric generation, tripling the electric energy use per house would more exacerbate our already tenuous energy situation,

Figure 3 Smart Grid is Critical for US Electric VehiclesSmart grid
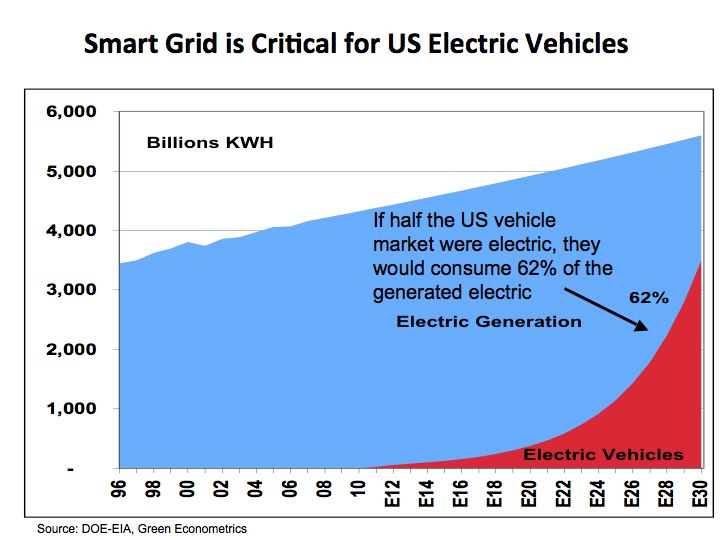
Source: EIA, Green Econometrics

To sustain economic growth and avoid dependence on foreign oil, electric vehicles provide a migration path towards energy independence. To support the adoption of electric vehicles, a tremendous investment in our electric infrastructure is required. A dramatic supply shock to oil could raise substantially the retail price of gas and thereby drive consumer towards EVs at an accelerated rate. If half the vehicles on the road were electric, our electric generating capacity would need to increase dramatically and outfitted with smart grid technologies to stabilize transmission.

The bottom line is vision and innovation require investment into infrastructure and in particular renewable energy generation like solar and wind and the grid to support intelligent transmission and distribution.

University of Illinois Researchers Demonstrate Innovative Approaches to Lower Photovoltaic Panel Production Costs

Even if silicon is actually the industry common semiconductor in the majority of electric products, including the solar cells that photovoltaic panels employ to convert sunshine into electricity, it is not really the most effective material readily available. For instance, the semiconductor gallium arsenide and related compound semiconductors offer practically two times the performance as silicon in solar units, however they are rarely utilized in utility-scale applications because of their high production value.

University. of Illinois. teachers J. Rogers and X. Li discovered lower-cost ways to produce thin films of gallium arsenide which also granted usefulness in the types of units they might be incorporated into.

If you can minimize substantially the cost of gallium arsenide and other compound semiconductors, then you could increase their variety of applications.

Typically, gallium arsenide is deposited in a single thin layer on a little wafer. Either the desired device is produced directly on the wafer, or the semiconductor-coated wafer is cut up into chips of the preferred dimension. The Illinois group chose to put in multiple levels of the material on a one wafer, making a layered, “pancake” stack of gallium arsenide thin films.

Figure 1 Thin Film Solar Thin Film
Source: University of Illinois

If you increase ten levels in one growth, you only have to load the wafer once saving substantially on production costs. Current production processes may require ten separate growths loading and unloading with heat range ramp-up and ramp-down adds to time and costs. If you take into account what is necessary for each growth – the machine, the procedure, the time, the people – the overhead saving derived though the new innovative multi-layer approach, a substantial cost reduction is achieved.

Next the scientists independently peel off the levels and transport them. To complete this, the stacks alternate levels of aluminum arsenide with the gallium arsenide. Bathing the stacks in a solution of acid and an oxidizing agent dissolves the layers of aluminum arsenide, freeing the single thin sheets of gallium arsenide. A soft stamp-like device picks up the levels, one at a time from the top down, for shift to one other substrate – glass, plastic-type or silicon, based on the application. Next the wafer could be used again for an additional growth.

By doing this it’s possible to create considerably more material much more rapidly and much more cost effectively. This process could make mass quantities of material, as compared to simply the thin single-layer way in which it is usually grown.

Freeing the material from the wafer additionally starts the chance of flexible, thin-film electronics produced with gallium arsenide or many other high-speed semiconductors. To make products which can conform but still retain higher performance, which is considerable.

In a document published online May 20 in the magazine Nature the group explains its procedures and shows three types of units making use of gallium arsenide chips made in multilayer stacks: light products, high-speed transistors and solar cells. The creators additionally provide a comprehensive cost comparability.

Another benefit of the multilayer method is the release from area constraints, specifically important for photo voltaic cells. As the levels are removed from the stack, they could be laid out side-by-side on another substrate to create a significantly greater surface area, whereas the typical single-layer process confines area to the size of the wafer.

Figure 2 Solar Arsenium Arsenium
Source: University of Illinois

For solar panels, you want large area coverage to catch as much sunshine as achievable. In an extreme situation we could grow adequate levels to have ten times the area of the traditional.

After that, the team programs to explore more potential product applications and additional semiconductor resources that might adapt to multilayer growth.

About the Source – Shannon Combs publishes articles for the residential solar power savings web log, her personal hobby weblog focused on recommendations to aid home owners to save energy with solar power.

Energy Perspective

After reviewing oil data from the Energy Information Administration (EIA), Global Petroleum Consumption , it may be helpful to put energy consumption into perspective. Most of us are quite familiar with alternative energy such as solar and wind, but the reality is, even if solar and wind could supply all of electric energy needs, the majority of our energy needs is still predicated on access to oil.

While industry experts and scientist debate whether more drilling will ameliorate the energy challenge we face, let’s look at a couple of data points. Figure 1 US Oil Field Oil Production and Drilling Rigs – illustrates that higher drilling activity as measured by Baker Hughes Rig Count data does not necessarily correlate to more oil production as measured by US Oil Field Production by the EIA. Higher drilling activity does not produce more oil.

Figure 1 US Oil Field Production and Drilling Rigs US Oil Demand
Source: Energy Information Administration and Baker Hughes research

Despite the large investment in drilling rigs that more than doubled from 1,475 in 1974 to over 3,100 in 1982, US oil production remained relatively flat. Moreover, even the most recent drilling expansion activity that again more than doubled from 1,032 rigs in 2003 to over 2,300 rigs in 2009, resulted in relatively flat oil production, suggesting that on the margin unit oil production per drilling rig was declining. Perhaps even more disturbing is that the most recent drilling activity in the US was accomplished through extensive use of technology. Seismic imaging technology is being used to better locate oil deposits and horizontal drilling technologies are employed to more efficiently extract the oil, yet oil production still lags historic levels. While on the margin, newly announced offshore drilling could add to domestic oil production, extraction costs of oil will continue to rise adding to further oil price increases.

However, what is most profound is our dependence on oil for most of our energy needs similar to how wood was used for fuel construction material during the 1300’s and 1600’s. If we translate energy consumption into equivalent measuring units such as kilowatt-hours, we can compare and rank energy consumption. Although electricity is captured through consumption of several fuels most notably coal, a comparison of energy usage between oil and electric provides an interesting perspective.

Figure 2 Energy Perspective – provides a simple comparison of the consumption of oil and electricity measured in gigawatt-hours (one million kilowatt hours). A barrel of oil is equivalent to approximately 5.79 million BTUs or 1,699 KWH and the US consumed approximately 19.5 million barrels per day equating to 12 million gigawatt-hours a year. The US uses 4 million gigawatt-hours of electric energy annually. The critical point is that even if solar and wind supplied all of our electric energy needs, it would still only comprise 30% of our total energy needs. Therefore, without an energy strategy that facilitates migration towards a substitute for oil, particularly for transportation, we are missing the boat.

Figure 2 Energy Perspective Oil
Source: Energy Information Administration and Green Econometrics research

It’s not all doom and gloom. Technologies are advancing, economies of scale are driving costs lower, and the economics for new approaches to transportation are improving. From hybrids and electric vehicles benefiting from advances lithium-ion batteries to hydrogen fuel cell vehicles getting 600 miles on a tank of fuel. These advanced technologies could mitigate our addiction to oil, however, without formulating an energy strategy directing investments towards optimizing the economics, energy efficiency, environment, and technology, we may miss the opportunity.

The bottom line is that oil is supply-constrained as there are no readily available substitutes, and therefore, without a means to rapidly expand production; supply disruptions could have a pernicious and painful impact on our economy, national security, and welfare.

Falling Panel Prices could bring Solar closer to Grid Parity

Rising inventory levels of photovoltaic (PV) panels and new production capacity coming online is driving solar PV prices lower and thereby, bringing solar energy closer to grid price parity. With the release of the latest earnings of solar energy companies, Wall Street’s keen attention to revenue guidance, inventory levels and pricing are paramount in diagnosing the health of the solar energy industry. Expectations call consolidation of the solar industry with some key players gaining market share and for others it becomes more challenging. However, despite the turbulence in the industry, consumers will benefit in the near-term as solar PV prices fall and government incentive fuel growth in solar PV deployment.

To get a better perspective on the solar PV industry, let’s examine inventory levels for some of the leading solar PV suppliers. The following chart, Figure 1, compares inventory levels in relationship to sales volume. While inventory levels have increased, the level of inventories to sales is not egregious

Figure 1 Sales and Inventory levels install

While it is important to control inventory levels in relationship to sales, revenue growth is predicated upon price, performance, and return on investment for prospective customers. Thin-film PV has emerged as the low-cost solar solution even with its lower efficiency levels in comparison to mono-and poly-crystalline PV panels. Thin-film still offers a lower cost/watt than crystalline PV, see Solar Shootout in the San Joaquin Valley , but prices for crystalline PV are falling as a result of rising production capacity and inventory levels.

Figure 2 Market Value Market Value

In Figure 2 Green Econometrics is comparing the market value of some of the leading PV suppliers as measured by their respective stock prices. In the valuation of solar PV suppliers, the stock market appears to be betting heavily on thin-film PV, as First Solar (FSLR), the leading thin-film PV supplier, enjoys a market value that accounts for over half the value of the entire solar industry. FSLR is positioned as the low-cost supplier in the solar industry with its announcement of $1 per Watt reducing its production cost for solar modules to 98 cents per watt, thereby braking the $1 per watt price barrier. However, new panel suppliers, mainly from China are pushing prices lower for poly-and mono-crystalline panels suppliers. ReneSolar (SOL) is seeing average selling prices for wafers at $0.93 per watt and bring PV panels prices to under $2.00 per watt.

There appears to be a lot riding on the success of thin-film PV and as prices fall for crystalline PV, the closer we get to grid parity. In the following chart, Figure 3, price for crystalline PV have declined quite dramatically in the last 30 years. According to the Energy Information Administration, in 1956 solar PV panels were $300 per watt, and in 1980, the average cost per solar modules was $27/watt and has fallen precipitously to approximately $2/watt in October 2009. As the installed cost of solar PV falls closer to $4/watt, pricing per kilowatt-hour (KWH) (depending on your climate and geography), equates to approximately $0.16/KWH that would be inline with utility rates after rates caps are removed.

Figure 3 Solar PV Prices econ

The bottom line is that despite the lower PV panel costs; we are still not at parity with hydrocarbon fuels such as coal and oil. Carbon based taxes or renewable energy incentives as well as more investment into alternative energy should improve the economics of solar and wind and bring us to grid parity.

Solar Energy – Closer to Grid Parity?

Last month First Solar (FSLR) achieved a milestone in the solar industry with its announcement of $1 per Watt reducing its production cost for solar modules to 98 cents per watt, thereby braking the $1 per watt price barrier.. While the achievement is great news for the solar industry some studies suggest more work is needed. An article in Popular Mechanics $1 per Watt talks of university studies questioning the scalability of solar given the immense global needs for energy. Last year our post included an article Solar Energy Limits – Possible Constraints in Tellurium Production? discussing possible limits on tellurium production on thin film solar photovoltaic (PV) suppliers.

In addition, Barron’s published an article (March 30, 2009)_ Nightfall Comes to Solar Land providing unique insight into the economics of solar PV suppliers. High oil prices and soaring stock prices on solar PV companies fueled silicon suppliers to ramp production capacity that has now transitioned, according to the Barron’s article, into an over supply of polysilicon used in the production of PV panels and subsequently, eroding the cost advantage established by thin film PV companies such as First Solar and Energy Conversion Devices (ENER) over polysilicon PV firms such as SunPower (SPWRA).

However, the PV panels typically represent approximately half the cost of a solar energy system. The following figure, Solar Installation Costs compares the total cost of installing a solar energy system which includes labor and supporting matertials.

Figure 1 Solar Installation Costs install

As illustrated in Figure 1, the panels represent a significant cost of installation, but the labor and support brackets for the PV panels are significant as well. While thin film PV enjoys significantly lower panel costs and is easier to install, the supporting brackets are sometimes more expensive. As prices for silicon fall, the cost disparity between thin film and silicon PV will narrow.

Figure 2 Solar Energy Economics econ

In Figure 2 Green Econometrics is comparing PV efficiency as measured by watts per square meter versus cost per watt. The selected companies represent a small portion of the global PV suppliers, but do illustrate the position of the leading US suppliers. The ideal model is to lower cost per watt while improving PV efficiency. But be cognizant that PV module cost per watt may not be indicative of the total system costs.

A comparison of wind and solar energy costs is demonstrated by Detronics and offers a useful framework to compare wind and solar costs by kilowatt-hour (KWH). As a caveat, wind and solar resources will vary dramatically by location. In the Detronics example, the costs per KWH represent the production over one year and both wind and solar have 20-year life spans. Over twenty years the 1,000-watt wind systems cost per KWH of $7.35 would average approximately $0.36 per KWH and the 750-watt solar systems cost of $10.68 would amount about $0.53 per KWH over the investment period.

Figure 3 Alternative Energy PricingEnergy Pricing

The Alternative Energy Pricing chart was base on research from Solarbuzz which is one of the leading research firms in solar energy. The cost per KWH that Solarbuzz provides is a global average. Even with cost per watt falling below $1.00, the system costs after installation are closer to $5.00 according to Abound Solar (formerly known as AVA Solar) and is still higher than parity with grid with a cost of $0.21 per KWH.

The bottom line is that despite the lower PV panel costs; we are still not at parity with hydrocarbon fuels such as coal and oil. Carbon based taxing or alternative energy stimulus and more investment into alternative energy is required to improve the economics of solar and wind.

Vote the Economy by Voting for Energy

Access to energy was instrumental fueling the Industrial Revolution. Over the last 200 years, industrial nations have migrated from wood to coal and now to oil as a source of energy. During the 1700’s, wood was used for just about everything from fuel to constructing houses and building wagons and even tools. As demand for wood increased, the cost of wood rose as deforestation led to the scarcity. The scarcity of wood resulted in deteriorating economics.

It was the availability and access to coal that enabled the growth of Industrial Revolution by providing accessible energy. The Industrial Revolution was predicated upon the availability of Labor, Technology, Capital, and Energy. Scarcity of any of these inputs could undermine economic growth, as was the case with capital during the Great Depression of the 1930’s and the Energy Shock of the 1970’s.

Oil, driven by rapid growth in automobile usage in the U.S, has replaced coal as the main energy fuel. According to the Energy Information Administration (EIA), the 70% of oil consumption in the U.S. is for transportation .

Figure 1 US Oil Imports Oil Imports

Figure 1 illustrates US historical oil imports, as measured by the Energy Information Administration in U.S. Crude Oil Field Production (Thousand Barrels per Day) that dates back to 1970. The EIA provides oil import data dating back to 1910. To estimate the amount of money the US spends on oil imports every year, we can use the data from the State of Alaska Department of Revenue, which provides historical data on the price of oil an derive an average yearly figure.

Figure 2 US Oil Import Spending Oil Spending

Figure 2. appears quite staggering given the amount of money we send to oil producing countries. The US is spending hundreds of billions to import oil. According to the EIA, the US imported an average of 10,031,000 barrels per day equating to $263 billion in imported oil during 2007 when the State of Alaska measured the yearly average spot price for a barrel of oil at $72.

According to Solarbuzz, Germany leads the world in solar photovoltaic (PV) installations with 47% of the market while China increased its market share of PV production from 20% to 35%. The US accounts for 8% of the world solar PV installations. Solarbuzz indicates the global solar PV industry was $17 billion in 2007 and the average cost of solar electricity is $0.2141 per KWH. If a portion of our $260 billion sent to oil producing countries were to be invested into solar energy, perhaps the US would not lag the world in alternative energy.

The bottom line is that the money spent on importing oil has a deleterious impact on our economy and continues our dependence on hydrocarbon fuels producing carbon and other harmful byproducts that negatively impact our climate and health of our children. The longer we are dependent on oil, the longer our economy and environment suffer. Use your vote for alternative energy and not drill baby drill.

”DRILL BABY DRILL” – NO INVEST INTO ENERGY TECHNOLOGY

Using the latest data from the Energy Information Administration (EIA) , oil production remains significantly below historical levels achieved in ‘70’s and ‘80’s. The peak production in 1970 has not been replicated despite significant expansion of drilling activity during the 1980’s.

Oil Drilling and Production

Figure 1 Oil Drilling and Production Oil Production

Figure 1 illustrates US historical oil production, as measured by the Energy Information Administration in U.S. Crude Oil Field Production (Thousand Barrels per Day) that dates back to 1920 juxtaposed against U.S. rig count, as measured by Bakers Hughes. The chart suggests that during the first energy shock to hit the US and the world, drilling activity expanded dramatically. By 1981, weekly North American oil rig count reached a high of 4,530 oil rigs in 1981.

U.S. Crude Oil Field Production reached a peak of 9.6 million barrels per day in 1970. In 1981, the height of US oil drilling, oil production was 8.57 million barrels per day. By 2002, U.S. Crude Oil Field Production was 5.74 million barrels per day. Over the last six years oil production declined 10.7% while over this same period, drilling activity as measured by Baker Hughes’ North American Rigs Running weekly rig count, increased 125%.

The decline in U.S. oil production is quite disturbing. During the last decade, a host of new technologies were introduced to help facilitate oil production. Companies such as Dawson Geophysical Co. (DWSN) that enhanced the market for energy exploration by providing seismic data acquisition services. Dawson Geophysical acquires and processes data using 2-D and 3-D seismic imaging technology to assess the potential of hydrocarbon sources below the earth’s surface.

Companies such as W-H Energy Services Inc. that was recently acquired by Smith International, Inc (SII) , offer an array of drilling services such as horizontal and directional drilling for onshore and offshore oil drilling, and 3-demensional rotary steering drilling systems. Smith Int’l is growing revenues at over 19% annually and Dawson’s revenues are growing 53%. With these oil drilling and energy exploration technologies growing at double rates, and drilling activity expanding at 14%, why is oil production falling?

With the rancor of “drill baby drill’ heard as call to solve the energy crisis, energy technologies such as solar and wind energy solutions deserve greater emphasis. Oil will eventually run out. There is a finite amount of oil in the ground. The Tar Sands will not solve the problem. According to Alberta Energy, sand oil production was 966,000 barrels per day (bbl/d) in 2005 and is expected to reach 3 million bbl/d by 2020. Tar sands would only contribute 3.5% towards our current oil consumption of 84.5 million barrels per day.

The bottom line is that our dependence on oil leaves our economy vulnerable. Energy is the catalyst that enables economic development. The longer we are dependent on importing oil from countries hostile to civilized existence, the more tenuous grows the environment. We need to conserve existing energy use and invest into energy technologies that foster the development of alternative energies, thereby, limiting our dependence on oil period.

Energy Crisis – What Can We Do

As energy and food prices set new world records, what can we do at home to avert the crisis? Food prices are rising because corn is diverted from food production to producing ethanol for use as fuel in motor vehicles and is exacerbated by the recent flooding in the Mid West. Oil prices continue to escalate as demand for oil in developing countries increases and supply constraints, rising production costs, and limited refining capacity constrain the supply of oil. These factors continue to weigh against homeowners that will face escalating fuel bills to heat or cool their homes. There are some viable alternative energy solutions including wind and solar as well as home insulation that should offset the rising cost of energy. As far as food for fuel, we need to break our dependence on hydrocarbons which continues to impact our climate and weather and transfer our wealth to oil producing nations

Corn Prices have increased 264% since 2005. The rising price of corn used for ethanol is causing farmers to plant more corn and less production of other grains such as wheat or soy. Lower supply of grains is driving up food prices. Rising food prices is most debilitating to the poor, especially those in developing countries.

Figure 1 Corn Prices
Corn

Growing demand for oil and questions over Peak Oil suggesting even with oil prices rising to such an elevated level, production is rather anemic. According to the Energy Information Administration (EIA) , while oil prices increased 344% since 2001, oil production from OPEC is up only 1.2% over this same period.

Figure 2 Oil Prices
Oil

According to the EIA The demand for oil in China is growing at an 8.1% CAGR over the last five years. With demand for oil growing significantly in developing countries and despite production developments in Saudi Arabia and the 5-to-8 billion deepwater Tupi oil discovery in over Brazil The Tupi announcement in January 2008 is the world’s biggest oil find since a 12-billion-barrel field discovered in 2000 in Kazakhstan according the International Herald Tribune. These new oil discoveries are often in inhospitable areas or deep ocean environments, which makes extraction costly and difficult.

Figure 3 Rig Count and OPEC Oil Production
OPEC

What can we do? . Forget drilling for more oil, electric vehicles and investment into alternative energy is the only way to avert this crisis. OPEC area drilling activity is up 48% since 1998 and yet, despite dramatically higher oil prices, up 5 fold since 1998, OPEC oil production increased only 11% over 1998.

Homeowners could begin to deploy energy saving and alternative energy systems. Wind and solar energy could help reduce some of the pain. As consumer embrace hybrids, electric, and fuel cell vehicles, wind and solar should begin to offer a stronger value proposition. Energy saving tips such as compact fluorescent bulbs, on-demand hot water heaters, and thicker home insulation products should help reduce heating and cooling costs.

According to the American Wind Energy Association AWEA a turbine owner should have at least a 10 mph average wind speed and be paying at least 10 cents per Kilowatt-hour (KWH) for electricity. There are electric utility and tax credits available in some areas. There are also questions regarding zoning restrictions, and whether to connect to batteries for energy storage, or directly to your electric utility. Consult the Wind Energy Resource Atlas of the United States Wind Resource Maps to get a better understanding of wind speeds in your area.

Cost wind systems will vary depending on model and installation costs will vary by your location. The Whisper 500 from Southwest Windpower offers electric production of 538 KWK/month at 12 mph (5.4 m/s). The system weighs 155 lb (70 kg) and has blade span of 15 feet (4.5 m) and must be mounted on a tower in cement. At 538 KWH per month, that is enough energy to cover the needs a modest house with conservative electric usage. Small wind systems can range from under $1,000 to over $20,000 with a payback period of approximately five years depending on wind resources and utility rates.

Solar photovoltaic (PV) panels cost an average of $4.80 per watt according to Solarbuzz which is about $0.24 per KWH over a 20 year life of the PV system. With an average output of approximately 10.6-watts/square foot (114 w/m^2), a five KW PV systems would cover 515 square feet (47.8 sq. meters) costing approximately $36,000 before credits and tax benefits and produce about 490 KWH per month. Of course installations costs are extra, but with PV production ramping and new PV suppliers entering the market we can expect costs to decline. Federal and local tax credits as well as selling unused electric to your local utility offers economic value on the margin.

The economic value is expected to increase as costs decline and electric rates increase and we can expect significantly higher utility rates in the near future. The economics of zero carbon emissions is not even measured as a benefit to the consumer. We are just beginning to see the cost impact of extreme weather and climate change.

Consumers should try to ameliorate the rising cost of energy by investing into solar and wind. There are several companies offering complete installation services. Among these include: Akeena Solar (AKNS) in California and The Solar Center in New Jersey.

The bottom line: energy and food prices are creating a crisis for consumers globally and there are several initiatives that could help minimize the pain. In addition, the erratic weather patterns around the world may be just a prelude to climate changes due to the impact of carbon dioxide on climate, which may cost us much more in the long run. Let’s stop the drain of wealth cause by oil and invest into clean and renewable energy solutions.

Solar Energy Limits – Possible Constraints in Tellurium Production?

Solar energy is gaining considerable attention from Wall Street and countries looking to achieve energy independence. Solar energy represents one of the most significant energy solutions to help eradicate our addiction to oil. Despite the tremendous success offered with solar photovoltaic (PV), more research is required to sustain further deployment and achieve energy independence. Some semiconductor materials used to develop photovoltaic devices are scarce and may limit PV from achieving mass penetration. Let’s review the current solar PV market to better understand the dynamics of this market.

Figure 1 PV Production by Year
PV Production

Figure 1 demonstrates the rapid market growth of solar PV and Solarbuzz is astute to point out some critical data points: cumulative PV deployment is still less than 1% of global electric usage, PV industry faces capacity constraints, and Germany and Spain account for 47% and 23% of total PV deployment in 2007. With the significant growth in both the production and deployment of solar PV devices, the stock price of some of the leading PV suppliers have appreciated dramatically even despite a recent pull back in the beginning of the year.

Figure 2 PV Production of Leading Suppliers
MkPV Suppliers

Despite the turbulence on Wall Street in 2008 with the NASDAQ down 14% year-to-date, and Dow Jones Industrial Average down 7.3% YTD, investor appetite for clean technology stocks remains robust. First Solar (FSLR), a leading supplier of thin film solar PV remains in positive territory and is up nearly ten-fold from its IPO in November 2006. Thin film PV offers a cost advantage over traditional crystalline PV cells. PV devices employ various elements with different band gap properties to achieve improving solar efficiencies. (See our post on semiconductor band gaps: What’s Pushing Solar Energy Efficiency?, October 1st, 2007)

Figure 3 Market Capitalization Solar PV Suppliers
Mkt Cap

There are several elements used in thin film PV production. Among the elements used include cadmium and tellurium (CdTe), copper, indium, and selenium, (CuInSe), and copper, indium, gallium, and selenium (CIGS). These various elements are used to improve operating efficiencies and lower production costs of PV devices. In general, crystalline PV devices have higher solar efficiencies, but cost more due to their material thickness of 200-to-300 microns. Whereas, thin film PV are usually about 3 microns deep offering significantly lower production costs. However, SunPower (SPWR) the leading polycrystalline silicon PV supplier offers the highest solar efficiency a rating of 22.7% that started shipping in 2007.

Figure 4 FSLR and SPWR Solar PV Production
Mkt Cap

FSLR and SPWR are the two leading PV players as measured by Wall Street in terms of market valuation. The cost-efficiency tradeoff between these two PV suppliers offers an interesting framework to evaluate the solar PV market.

Figure 5 PV Cost-Efficiency
Cost-Efficiency

The stock market appears to be betting on FSLR given its market capitalization of $22 billion and trading at 43 times 2007 revenues of $504 million. FSLR employs CdTe in its solar modules. In several postings on Seeking Alpha starting back in November 2007, Anthony and Garcia de Alba have provided valuable insight into material constraints in the production of PV devices.

Tellurium is a rare metalloid element that is used in producing semiconductor materials because it does not conduct electricity. Tellurium is recovered as a by-product in refining and processing of gold and copper as well as other ores. Tellurium was primarily used to create metal alloys that enable easier machining of end products.

Because of its unique properties, Tellurium and cadmium (CdTe) have been used in thin film PV production since the 1980’s. According to a comprehensive study by Fthenakis and earlier work by Moskowitz “The Life Cycle Impact Analysis of Cadmium in CdTe PV Production”, CdTe is deposited on a thin film substrate using electrodeposition, chemical surface deposition, and vapor transport deposition. FSLR reports in their 10K that they employ a proprietary vapor transport deposition process for CdTe PV production.

A thin film of CdTe is deposited on a substrate at a thickness of 3 microns. According to the Fthenakis and Moskowitz, back in the 1980’s, a 10 megawatt (MW) PV facility employing vapor transport deposition of CdTe uses 3,720 kilograms (kg) of CdTe to achieve a10% efficiency at 3 microns. A one-one bond of CdTe with an atomic weight of Cd at 112.41 and Te at 127.60 suggests Te comprises 53% of the weigh of CdTe. With 3,720 kg of CdTe used at 10MW, the amount of Tellurium used is estimated at 1,978 kg or 197.8 kg/MW.

The electrodeposition CdTe process using a mixture of cadmium sulfate and tellurium dioxide used 880 kg of tellurium dioxide, which amounts to approximately 696.8 kg of Te for 10 MW PV productions. The electrodeposition CdTe process would equate to about 69.7 kg of Te per MW. For a 100 MW PV production approximately 7 tons of Te are consumed.

One would assume the PV production process would improve significantly from the 1980’s and the amount of Te consume would decline with improving efficiencies. This would suggest that FLSR at 200 MW PV capacity in 2007 would consume somewhere between 14 and 38 metric tons of tellurium. This figure is significantly higher than the estimates derived from the FSLR tellurium posts on Seeking Alpha that are closer to10 tons per 100 MW (100 kg/MW).

Figure 6 Te Production
Te

Let’s proceed with the conservative figure of 100 kg/MW (10 tons at 100 MW) to assess the tellurium constraints. Tellurium production is a by-product of gold, copper and other ores. We have found Te production estimates ranging from 132 metric tons (MT) to 300 MT per annum. In a National Renewable Energy Laboratory (NREL) report Assessment of Critical Thin Film Resources in 1999 estimated Te production between 200 and 300 metric tons per year in 1997 and indicated under utilization of capacity for the production of tellurium.

Let’s compare our conservative estimate of 100kg/MW Te usage for FSLR to the optimistic production forecast of 300 MT to evaluate capacity constraints for FSLR. With 300 MT (300,000 kg) global Te production and FSLR using 80% of the Te production, capacity of PV tops out at 2,400 MW (2.4 GW).

The U.S. electric energy usage in 2006 was 4,059.91 billion kilowatt hours (KWH) which translates into 463,460 MW (divide 4060 by 365 days x 24 hours). So without significant investment into research and development for PV FSLR could be constrained at 2,400 MW representing only 0.5% of the U.S. electric usage in 2004. Further more, if FSLR were to be constrained at 2.4 GW annual production, revenues ($2.60 per watt Q4/07) would peak at approximately $6.24 billion, a price-to-sales multiple of 3.4x with its market capitalization of $22 billion.

However, in comparison to leading companies in energy, pharmaceuticals, technology and finance, FSLR’s market capitalization is relatively small. Perhaps with improving production processes, FSLR could reduce the amount of Te per panel and improving mining and metal refinement process could increase Te production to expand the market for CdTe thin film PV devices.

Figure 7 Market Capitalization of Leading Companies
Mkt Cap

The bottom line is that more research and investment into alternative energies is required to ameliorate the world from being held hostage to oil and hydrocarbon fuels that are directly linked to rising CO2 levels and climate change.

Hydrogen Fuel Cells – energy conversion and storage

World oil demand continues to rise despite efforts to limit demand. Renewable energies such as solar and wind have the potential to limit our dependence on hydrocarbon fuels, but one issue remains prominent – storing energy. While the sun provides radiation for solar and generates wind, when its cloudy or dark we are unable to produce solar energy. One must provide a means to store that energy for when it is needed. Fuel cells enable energy conversion and fill a reliable role in alternative energy strategies.

A chart compiled by Wasserstoff-Energie-Systeme GmbH (h-tec) provides an easy to understand depiction of how fuel cells integrate with solar and wind energy solutions. Fuel cells provide the enabling technology that allows hydrogen to serve as the storage and transport agent. The solar energy that is produced during the daylight hours is used in an electrolyzer to produce hydrogen that in turn, is then used to operate the fuel cell producing electricity at night when it is needed. This process is called the solar-hydrogen energy cycle. Figure 1 illustrates the importance of energy storage in adopting alternative energies.

Figure 1 Solar-Hydrogen Energy Cycle
Energy Cycle

Demand for oil and hydrocarbon fuels continues to grow despite effort to conserve. Total Petroleum Consumption shows increasing oil demand from China and India while demand in the U.S. grows at a slower pace. With improving efficiencies and lower production costs, fuel cells could provide a solution to our appetite for oil in motor vehicles. Figure 2 describes how fuel cells and electrolyzers (fuels running in reverse) work.

Figure 2 Fuel Cells
Fuel Cells

Fuel cells are devices that convert chemical to electrical energy – in essence; it’s an electrochemical energy conversion device. In the chemical process of a fuel cell, hydrogen and oxygen are combined into water, and in the process, the chemical conversion produces electricity. In the electrolyzer, an electrical current is passed through water (electrolysis) and is the reverse of the electricity-generating process occurring in a fuel cell.

Hydrogen fuel cells offer tremendous opportunity for storing and transporting energy enabling broad applications for home, business, motor vehicle and large-scale energy projects. The follow provides a review of current technologies applicable to hydrogen fuel cells. Factors to consider in using hydrogen fuel cells include operating efficiency, operating temperature range, and material used for the electrolyte (the catalyst that separates hydrogen) and fuel oxidant (that transfers the oxygen atoms).

Figure 3 Hydrogen Fuel Cell Technologies
FC Technologies

One of the most practical fuel cell technologies for motor vehicle use include Proton Exchange Membrane (PEM) because it operates at normal ambient temperatures and offers high electrical efficiency. There are several useful web sites that illustrate the benefits of hydrogen fuel cells. h-tec and the National Renewable Energy Laboratory provide some very useful information on hydrogen fuel cells.

We are also seeing progress on fuel cell vehicles that could ultimately ameliorate are demand for oil, if not eliminate it entirely, all with no carbon dioxide or other harmful emissions. We see most major automakers developing hydrogen powered fuel cell vehicles. GM is making progress introducing several models using GM’s Fuel Cell Technology.
Honda’s experimental hydrogen refueling station in Torrance, CA uses solar to produce hydrogen for their hydrogen fuel cell vehicle Honda’s FCX .

The bottom line is that the availability of cheap oil is on the decline and without further research on alternative energies we may find the global economy in a very tenuous position. Further research into solar and hydrogen fuel cells could significantly reduce our dependence on oil.

Ethanol offers short-term solutions, but corn-based ethanol is not the answer

Ethanol may emit less CO2 and help reduce the demand for foreign oil in the short term, but ethanol and in particular, corn-based ethanol raises food prices, is less efficient than gasoline, diesel, and biodiesel, and is not a substitute for oil.

According to research compiled by National Geographic Magazine , the energy balance of corn ethanol, (the amount hydrocarbon fuel required to produce a unit of ethanol) is 1-to-1.3 whereas for sugar cane ethanol the ratio is 1-to-8. This suggests corn-based ethanol requires significantly more energy to produce than sugar cane ethanol. Corn ethanol is only marginally positive.

A major issue with corn ethanol is its impact on corn prices and subsequently, food prices in general. It is the price of oil that is impacting the price of corn because nearly all ethanol produced in the U.S. is derived from corn. Therefore, corn prices are inextricably linked to oil prices as well as to the supply and demand of corn as food and feedstock. Corn Prices while volatile and impacted from weather and other variables appear to follow the rising price of oil as illustrated in Figure 1. In turn, corn prices are also influencing other commodity prices where corn is used for feed for livestock.

The rising motor vehicle usage in China and India is escalating the already tenuous situation in the oil markets. With ethanol tied to oil prices we are beginning to see corn prices exacerbate the inflationary pressures at the retail level. Over the last year consumers are paying more for food with large increases in the prices of eggs, cereal poultry, pork, and beef which are tied to corn.

Figure 1 Corn Prices
Corn Prices

Senate legislation for Renewable Fuels Standard calls for ethanol production to increase to 36 billion gallons by 2022 with 21 billion derived from as cellulosic material such as plant fiber and switchgrass . Corn is expected to comprise 42% of the ethanol production in 2002 from virtually all today. The fact is that ethanol production at its current level of 6 billion gallons equates to only 4% of our gasoline usage and is already impacting food prices. Gasoline consumption in 2005 amounted to 3.3 billion barrels or 140 billion gallons. Current estimates put gasoline consumption at 144 billion gallons a year in 2007. Even if vehicles could run entirely on ethanol, there is not enough corn harvest to substitute our demand for oil. We need a cohesive and coordinated effort using multiple technologies to develop alternative energies to reduce our dependence on foreign oil.

Performance

According to Renewable Fuels Association ETHANOL FACTS:
ENGINE PERFORMANCE,
ethanol offers higher engine performance with octane rating of 113 in comparison to 87 for gasoline and has a long history in the racing circuit. In 2007, the Indy Racing League, sponsors of the Indianapolis 500 started using ethanol in racecars. However, the higher engine performance may come at a cost of lower fuel efficiency.

Table 1 Specific Energy, Energy Density & CO2
Specific Energy

Efficiency

Gasoline offers 56% higher energy efficiency (specific energy) over ethanol as measured by kilo-joules per gram (kj/g). (As a reference: 1 kilowatt-hour = 3,600 kilojoules = 3,412 British Thermal Units) Biodiesel with 35 kj/g is 33% more energy efficient than ethanol at 24.7 kj/g.

In terms of energy density, ethanol would require larger storage capacity to meet the same energy output of gasoline diesel, and biodiesel. Ethanol requires a storage tank 48% larger than gasoline and 41% larger than diesel for the same energy output.
Please see Hydrogen Properties and Energy Units

For a quick review of Specific Energy and Energy Density – (Molecular Weight Calculator) the specific energy of a fuel relates the inherent energy of the fuel relative to its weight and is measured in kilo-joules per gram.

CO2 Emission

The molecular weight of CO2 is approximately 44 with two oxygen molecules with an approximately weight of 32 and one carbon atom with a weight of 12. During the combustion process, oxygen is taken from the atmosphere producing more CO2 then the actual weight of the fuel. In the combustion process a gallon of gasoline weighing a little over six pounds produces 22 pounds of CO2.

CO2 emission is a function of the carbon concentration in the fuel and the combustion process. During combustion ethanol produces approximately 13 pounds of CO2 per gallon. Gasoline and diesel produce approximately 22 and 20 pounds per gallon, respectively. CO2 emissions per gallon appear quite favorable for ethanol. However, the results are less dramatic when CO2 emissions are compared per unit of energy produced.

Figure 2 CO2 per KWH
CO2 / KWH

When measured in pounds of CO2 per kilowatt-hours (KWH) of energy, the results show ethanol producing 6% less CO2 than diesel or biodiesel and 5% less than gasoline. In the case of ethanol, the lower specific energy of the fuel negates the benefit of its lower CO2 emissions. Meaning more ethanol is consumed to travel the same distance as gasoline or diesel thereby limiting the benefit of its lower CO2 emissions.

The bottom line is ethanol does not ameliorate our dependence on foreign oil and while it demonstrates higher performance for racecars, it is still less efficient than gasoline diesel, and biodiesel, and diverts food production away from providing for people and livestock. The reality is there are special interest groups that obfuscate the facts about ethanol for their own benefit. The real solution to our imminent energy crisis is alternative energies including cellulosic ethanol, solar, hydrogen fuel cells, and wind.

Economics of Solar PV Suppliers

Improving economics and high market valuations should help drive research for alternative energy. With the release of Q3/07 financials, it’s clear that the economics of solar photovoltaic (PV) suppliers is improving. Some of the leading pure play publicly traded PV stocks are demonstrating significant improvements in financial performance that should drive further investment into solar and green technology. The improving economics of solar should continue to drive further investment into alternative energy companies as venture capital firms and Wall Street find that alternative energy is a significant secular trend with sustainable economic foundation.

Most visible among the solar PV suppliers is First Solar (FSLR) with y/y revenue growth for Q3/07 increasing 290% and gross margins exceeding 50% and operating margins above 30%. FSLR’s management was clear in articulating that these strong Q3 numbers reflect ramping on of its German manufacturing facility and would not be sustainable. However, with gross margins exceeding 50% and operating margins above 30% Wall Street takes notice and rewards the firm with valuation multiple envious of leading technology companies such as Google (GOOG) and Cisco Systems (CSCO).

Figure 1 Revenues, Margins, and Capacity
Solar Financial Performance

The stronger financial performance of solar PV suppliers is significant because it improves the viability of the solar PV business model thereby attracting more investors and in turn drives funding for alternative energy start up companies. FSLR went public in November 2006 with a closing price of $24.74 on its first day. With a closing price one year later of $212.63, FSLR offers investors a yearly return of 759%. The attractive return generated by solar stocks tends to attract more investors and drives market valuations higher thus feeding the flow of additional venture capital funding.

In terms of market valuation FSLR trades at a significant premium to most companies in the S&P 500 as well as leading technology companies including GOOG and CSCO. . Most solar PV companies trade at higher market valuation multiples than CSCO and GOOG. Both FSLR and Sun Power (SPWR) trade at premium price-to-sales (P/S) and price/earnings-to-growth (PEG) multiples in comparison to some leading technology stocks. In terms of PEG ratios, FSLR and SPWR trade at 2.9x and 2.2x respectively while CSCO and GOOG trade at 1.3x and 1.2X, respectively. In comparison, the S&P 500 index trades at a PEG of 0.8x while the technology and energy segments trade at 0.6x and 2.2x, respectively. These high market valuations prove the venture capital community with high exit values on their current crop of alternative energy investments. Please see Figure 2.

It is this premium market valuation multiple that suggests the importance of alternative energy. Wall Street tends to be a leading indicator and keen in its ability to identify secular trends. Major trends command premium valuations and reward venture capital with attractive exist strategies. Wall Street rewards cash flow growth fueling further venture capital funding that in turn, fuels the flow of intellectual and financial capital. The value migration measured by price-to-sales multiples and illustrated by A. Slywotsky in his book Value Migration provide a framework to gauge the significance of trend towards alternative energies. Capital gravitates to the business model that creates economic value and is measured by a stock’s price-to-sale ratio. By that measure solar stocks is where the value is headed.

Figure 2 Price-to-Sales Ratio
PS Ratio

The bottom line is that high market valuations attract research funding and brain power. Rising oil prices, rapid industry growth, and high public market valuations of solar PV companies, should act to attract further venture capital funding of alternative energy companies. Increased solar funding should translate into increased research and talent migration that could improve solar efficiency and reduce costs that in turn could bring solar to electric grid parity.

Solar and Hydrogen: Energy Economics

After reviewing some of the details of Honda’s experimental solar-power hydrogen refueling station in Torrance, CA and its fuel cell vehicle several questions concerning efficiency and practicality come to mind. It most be noted that solar and hydrogen don’t emit harmful byproducts such as carbon dioxide or carbon monoxide so both technologies are important to our energy security. First let’s look at the efficiency of hydrogen and second the efficiency of generating hydrogen from solar.

As we learned from science class, hydrogen is the most abundant element in the universe. Hydrogen has approximately 3 times the energy per unit mass as gasoline and requires about 4 times the storage volume for a given amount of energy according to a Hydrogen Energy report from Stanford University. In further review of additional information on hydrogen we are also making some adjustments to our fuel-ranking table.

We are revising Table 1 that was used in our post of October 3, 2007 for data on the energy density for hydrogen from 2.5 kilowatt-hours (KWH) per gallon to 10.1 KWH/gal and is reflected in the revised Table 1 below. The discrepancy lies in measuring the weight of hydrogen in liquid volume. We are calculating the energy density of hydrogen using the high heat values of hydrogen of 61,000 British Thermal Units (BTUs) and a weight 0.57 pounds per gallon from the Stanford Hydrogen Report.

As a reference: 1 KWH = 3,600 kilojoules = 3,412 BTUs

Revised Table 1 Specific Energy, Energy Density & CO2
Specific Energy

Hydrogen offers tremendous energy potential, but as we see from Table 1, hydrogen has a low energy density meaning it requires a large storage container to make it practical for use in a motor vehicle. Several car manufacturers including GM and Toyota have developed hydrogen vehicles. Hydrogen can be used in internal combustion engines replacing gasoline or in fuel cells to generate electric to power the vehicle. However, there are some limitations to the current technology that may limit the economic viability hydrogen powered vehicles in the near term. But there are no detrimental emissions with hydrogen as apposed to hydrocarbon fuels thus providing tremendous benefits as vehicle efficiency improves.

Honda’s solar-powered hydrogen fueling station takes nearly a week in sun to produce enough hydrogen to power Honda’s FCX concept hydrogen fuel cell vehicle. Honda employs a Proton Exchange Membrane Fuel Cell (PEMFC) that converts hydrogen to electric that in turn, powers the vehicle. The Honda FCX fuel cell vehicle has two fuel tanks that can be filled with up to 156.6 liters of hydrogen or about 43 gallons that offers 430km (267 miles) driving range. The hydrogen fuel cell vehicle provides a reasonable driving range, but with a fuel efficiency of 6.5 miles per gallon (MPG), suggests more research is needed.

BMW’s Hydrogen 7 can travel 125 miles on hydrogen and 300 on gasoline before refueling. In tests the BMW 745h liquid-hydrogen test vehicle has 75 kg tank has a Hydrogen Fuel Efficiency of 10 km/liter or about 25.2 MPG and cruising speed of 110 MPH. Not too bad for an internal combustion engine that is able to run on gasoline or hydrogen.

Figure 1 Specific Energy
Specific Energy

Given the changes to hydrogen’s energy density we are also adjusting hydrogen density (Figure 2) to reflect liquid hydrogen and high-energy value as noted by Hydrogen Properties College of the Desert.

Revised Figure 2 Energy Density: KWH per Gallon
Energy Density

We still have more questions given hydrogen’s very high specific energy, (3 times that of gasoline) and low energy density (4 times the volume of gasoline). Hydrogen is more efficient then petroleum fuel, yet when used as a fuel cell in a vehicle Honda’s MPG of 6.5 MPG is quite low. The fuel efficiency of BMW’s Hydrogen 7 of 25.2 MPG is only at parity with gasoline.

The efficiency of using solar energy to generate hydrogen may not be the most efficient method. One report from Walt Pyle, Jim Healy, and Reynaldo Cortez Solar Hydrogen Production by Electrolysis indicated that a 1-kilowatt solar photovoltaic device could generate 1 cubic meter of hydrogen in 5.9 hours. Essentially, 5.9 KWHs from a 1KW solar cell produces 1 cubic meter of hydrogen. We know that a pound of hydrogen in liquid state equals approximately 61,000 BTUs (51,500 BTUs at low heat value) or 17.9 KWH.

Research at Caltech, suggests that photoelectrochemistry The Lewis Group may offer a more efficient means of generating hydrogen. We will continue to explore solar efficiency and hydrogen fuel cells to evaluate the economics of alternative energy.

The bottom line is that our dependence on foreign oil is the biggest threat to national security and without cultivation of alternative energies we continue to endure an untenable situation. Further research into solar and hydrogen fuel cells could significantly ameliorate our dependence on oil.

Economics of Solar Energy – price parity and efficiency: Are we there yet?

With the Solar Decathlon is taking place in Washington DC today promoting commercially available solar energy technology and oil prices pushing to an all time high of $84/barrel, where are we in terms of cost parity with hydrocarbon fuels. Advances in solar energy technology, lower production costs, and rapidly rising oil costs could bring solar energy into parity with hydrocarbon fuels within five years.

The cost of solar energy remains prohibitively high at about $0.45 per kilowatt-hour (KWH) for an installed system. (a kilowatt-hour equals a 100-watt light in operations for 10 hours and equals 3,412.14 British Thermal Units – BTU) As a reminder, there is significant variance in cost per KWH ($0.23-to-$0.68) because a solar energy system is dependent upon daily available sunlight, which varies from about two hours a day in Alaska to almost six hours in Arizona. Solar energy costs are based on data from solar photovoltaic (PV) supplies SunPower (SPWR) and Sharp Solar.

In comparison to hydrocarbon fuels, one gallon of gasoline has an energy value equal to approximately 125,000 BTUs and cost around $3.00/gallon. The energy value of a gallon of gasoline equates to 36.6 KWH, therefore its price is about $0.08 per KWH. So there is significant disparity between gasoline at $0.08/KWH and solar energy at $0.45.

Fortunately, there are a number of initiatives seeking to improve the economics of solar energy. When we measure the cost of solar energy in dollars per watt we find a complete solar energy systems cost around $8.90/watt. (If we amortize the $8.90/watt over a twenty year expected life of a solar energy system, it amounts to $0.45/KWH) To improve the economic value of solar energy we can lower production costs and/or improve solar efficiency in terms of raising the KWH of electric produced per solar panel.

From the Lewis Group. at Caltech, we learned about several technological approaches to improving solar energy efficiency. Among some of the leading solar technologies are multi-junction semiconductor cells and solar concentrators. In a multi-junction cell, individual cells are made of layers, where each layer captures part of the sunlight passing through the cell. One of the key limits to solar efficiency are the semiconductor band gaps where excess solar energy is lost to heat instead of being converted to electric. Solar concentrators amplify available sunlight and increase the watts per square meter per solar panel.

Last year the Department of Energy reported that solar energy achieved a new record in efficiency performance. The news release, New World Record Achieved in Solar Cell Technology. suggesting that solar concentrators and multi-junction PV cells could surpass the Shockley-Queisser single-junction solar efficiency limit of approximately 31% for single layer solar cell. The multi-junction, concentrator solar cell produced by Boeing-Spectrolab (a Boeing company BA) achieved a world-record conversion efficiency of 40.7% in lab experiments while commercial products operate at 26.5%-to-28.3% efficiency range.

The DOE believes breakthroughs in solar efficiency such as these may lead to systems with an installation cost of only $3 per watt, which translates into a cost of $0.15/KWH. In addition, solar PV cell suppliers are diligently working to reduce production costs. SunPower is targeting a 23% solar efficiency as a goal to reduce its solar energy system cost by 50% by 2012. Semiconductor solar cells benefit from economies of scale, which could reduce cost by 20% for each doubling of production. These solar initiatives should act to reduce solar energy costs.

Meanwhile, as energy costs rise with oil at $84/barrel, the cost of gasoline is expected to increase. If gasoline at the local filling station rises to $6.00/gallon, its cost in KWH jumps to $0.16/KWH. At that price gasoline would be above those achievable through solar energy advancements of $0.15/KWH.

Figure 1 Photovoltaic Device: Efficiency/Cost
PV Costs

With pricing on PV cells falling below $3.00/watt (or $0.15/ kilowatt-hour), solar energy will be close to parity with conventional hydrocarbons. If the cost of gasoline rises to $6.00 a gallon, it would cost $0.16/KWH while current cost of electric is about $0.11/KWH because of the low cost of coal. The bottom line is innovative research initiatives have the potential to deliver disruptive technologies that significantly changes the economics of delivering an energy solutions to all nations.

Further review:
Please see research at California Institute of Technology’s division of Chemical and Chemical Engineering at The Lewis Group.
Imperial College, Jenny Nelson’s Third generation Solar Cells.
DOE’s National Renewable Energy Lab (NREL) Third Generation Solar Photon Conversion (Exceeding the 32% Shockley(Exceeding the 32% Shockley—Queisser Limit)
Solar Energy Market Data Solarbuzz