The US utility grid, comprised of electric generation, transmission (high voltage long distance transport) and distribution (last mile connection to end user) consumes approximately 3.8 trillion kilowatt hours (kWh) with 1.28 trillion kWh in commercial use or roughly 34% of the grid.
In 2021, Electric Vehicles (EV) represented approximately 3% of the registered vehicles in the US. The U.S. Department of Transportation’s Federal Highway Administration states the average person drives around 13,500 miles every year. The average electric car consumes 34.5 kWh per 100 miles. This works out as 0.346 kWh per mile. https://ecocostsavings.com/electric-car-cost-per-mile/ That amounts to 36 billion kWh or 1% of the electric grid.
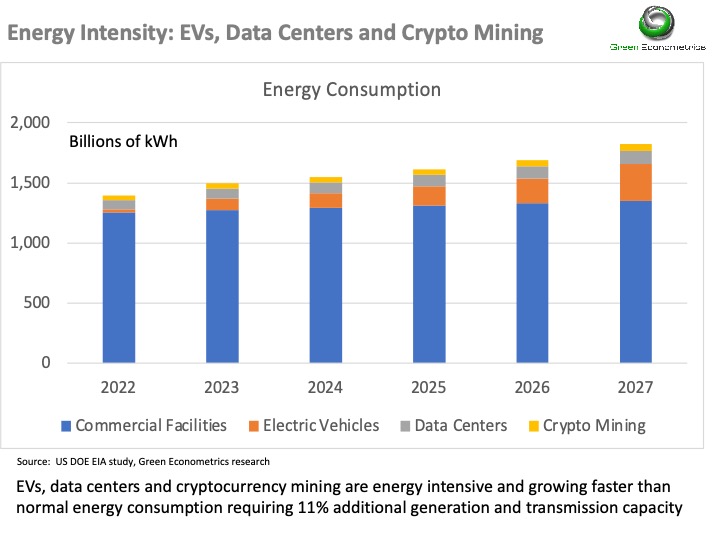
Vehicle manufacturers are projecting substantial migration to EVs which will increase the impact on the grid. When EVs account for 25% of total vehicles, an additional 7% of grid capacity will be required.
The required grid buildout will be complicated further by the adding huge numbers of physical EV charging locations. The Federal Government has just allotted $5 billion to assist states that have aggressive charging station construction plans. Bottom line: the EV transformation will have a trillion-dollar impact on the economy — driven by the 30%-to-60% energy efficiency gain of EVs over internal combustion engines.
Currently, there are over 160,000 fueling locations around the country such as gas stations and convenience stores. EV charging units, not individual locations, just a power connector, are estimated to be at around 36,000. What is important to note is that the majority of these legacy EV charging systems are Level 1 and Level 2 type requiring charge times of an hour to go 100 miles. These legacy EV charging systems are not conducive for vehicle commuting behavior. Who can wait an hour to charge their vehicle?
The trend is for next generation fast charge (FC) and extreme fast charge (EFC) EV charging systems that are capable of extending range and providing faster charge times more indicative of the average gas refueling time. The limitation is that the number of FC and EFC charging locations is minute. Tesla operates over 20,000 Supercharger connections globally but only 908 physical US locations.
The bottom line is that the buildout to support fast charging EVs will require extensive capital investment and generation capacity that is further complicated by managing distributed energy resources such as DC power conversion, energy storage and renewable energy.
While EVs are changing the utility landscape, digital transformation – where greater reliance is required by expanding data centers that consume substantially more energy than manufacturing facilities – is consuming energy at an even faster rate. The economics of cloud computing, machine learning, AI chips, and analytics-driven business models are only accelerating this digital transformation and dependence on data centers. When one adds crypto currency mining to the mix, the utility grid will predictably undergo substantial change. At current growth projections, Green Econometrics forecasts that EVs, data centers and crypto mining will require an additional 11% energy generation and grid capacity by 2027.
Why Cloud Computing and Data Analytics Enable Digital Transformation
From the inception of the Industrial Revolution several core ingredients enabled the transformation and growth of industry. Among these core building blocks of the Industrial Revolution namely: access to risk capital, visionary entrepreneurs, available labor, technology, resources and energy. Technology and energy play a crucial role in not only growing industry but enable scale. Technology can open new markets and provide advantage through product differentiation and economies of scale. Energy is literally the fuel that scales operations.
Today technology, built from knowledge and data, is how companies compete. Energy now emerges as even more integral in scaling operations. Just as James Watt developed the first steam powered engine in 1606 commencing the Industrial Revolution, it was the access to available coal with the use of the steam powered pump, invented by Thomas Savery in 1698, that allowed greater access to coal that gave scale to industry.
Most recently, the pending transaction of Salesforce’s (CRM) acquisition of Slack (WORK) after acquiring Tableau last year serves as a reference in valuing the importance of technology is to sustaining market value. The market value of seven companies accounts for 27% of the approximately $31.6 trillion for the S&P 500. Evaluating the industry and market impact of innovative technologies can be viewed through the lens of stock valuations, particularly as it applies to mergers and acquisitions. This article reviews the companies and the technologies from the perspective of market sales opportunity and the economic impact of the technologies based on the price/performance disruption to the industry.
So why are we focusing on energy and data today? Energy, predominantly hydrocarbon fuels such as oil, natural gas and even coal is how people heat their homes and buildings, facilitate transportation, and generate electricity to run lights, computers, machines and equipment. In addition, there is substantial investment focus on the digital economy, Environmental and Social Governance (ESG), and innovative technologies. A common thread among these themes is energy and data.
Data and Energy are the pillars of the digital economy. Energy efficiency can reduce carbon emissions, thereby improve ESG sustainability initiatives. Innovative technologies around energy and data are opening new markets and processes from formulating new business models to structuring and operating businesses.
The climate imperative and investing in energy infrastructure and environmental ESGs are predicted on energy efficiency and relevant performance metrics to evaluate investment allocation decisions. Therefore, our initial emphasis begins with a background on energy consumption with focus on electric consumption trends, carbon footprint, Green House Gas (GHG) emissions, sustainability, electric grid resilience, and technologies that impact energy including Electric Vehicles (EV), energy storage, and Autonomous Driving (AD). Data technologies encompass cloud architecture, Software as a Service (SaaS), Machine Learning (ML) analytics, and the importance of data as the digital transformation gives rise to the digital economy.
Digital Economy Performance Metrics
Before we dive into the financial and competitive analysis, let’s review business models that are disruptive to the status quo. That is are innovative technologies capable of rapid scale and efficiency gains that change the economics of the market and business profitability. In addition, disruptive events, driven primarily by technology, often appear as waves as the adoption of innovative technologies expands through the market.
Prominent technological waves such as the personal computer (PC), followed by the internet and smartphones and most recently social media and cloud computer all manifested themselves in engendering new business models and creating new market opportunities that dramatically changed the status quo among leading companies at the time. We will use the internet and mobile technology waves to explain how the introduction of innovative technologies offering vastly improved means of commerce enabled the development of new services that changed the business landscape.
Most recent advances in technology appear as waves and give rise to new business models and markets. The internet is one example. The internet enables the connection and process of communication over a new channel. The internet allowed one-to-one and one to many communications and the ability to engage, transact and scale using a digital platform that tremendously lowered the cost of engagement. Scale is among the most important attributes of the internet because the cost of digital replication is close to zero.
Mobile and smartphones began a new era in the digital world. The smartphone allowed a large portion of the world to interact with the internet for the first time on a mobile device. The mobile wave provided platform that enabled the introduction of a host of new business models. The introduction of the Apple iPhone gave way to several new services and industries all from your cell phone.
Let’s review the business model impact of innovative technologies as it applies to cost structure.
Cost Structure and Disruptive Innovation
As explained by ARK Investment Management’s Catherine Wood, the rate of cost decline can be used as a proxy for evaluating the disruptive impact of innovative technology. Cost structure improves as unit production expands. As first postulated by Theodore Wright, an aerospace engineer, who postulated that “for every accumulated doubling of aircraft production, costs fell by about 20 percent”. Wright’s Law as it is now known is also called the Learning Curve or Experience Curve and it is found across industries that experience different rates of declining costs.
What is important from the perspective of investment firms such as Ark is that the magnitude of disruptive impact can be gleaned from these declining cost curves. Revenue growth can then be correlated from these declining cost curves. Essentially, demand elasticity and future sales can be derived from the rate of product cost declines.
This is why price/performance and scientific metrics play an important role in evaluating products, services and company competitive positions. For example, the average cellular price per gigabyte (GB) of data is approximately $12.37 in 2020 according to Small business trends. Another example in science, is the physical performance of an LED light assessed by lumens the light output to the amount of energy consumed in watts such as lumens/watt (Lm/W). These metrics are points in time. For more context, the changes over time and magnitude of change provide insight into inflection points, trends, patterns and relationships.
As devices become complex, encompassing separate processors for communications, computing, power, video and various sensors, it is the integration and orchestration of the overall device performance that becomes of greater value to the user. So, price/performance, scientific understanding and economics become more attuned to relationships among these varied and interdependent components.
As digital transformation grows, underlying technology platforms become a core differentiator for key players. Our research reveals that current market leaders need to identify and embrace important new technologies now and adapt to the continuous emergence of new innovative platforms — often through M&A activities. In our full report, we take a look at significant technology disrupters and identify key players to watch.
Two overarching themes, data and energy, inform our approach; and our core premise that drives our innovative technology analysis is that as more commerce commences over digital platforms, more energy is consumed and more data is generated. This lens enables us to identify important emerging trends as well as obstacles to progress; while sorting out the technologies and firms most likely to emerge as winners going forward.
Importantly, our ongoing research reveals that there is also a confluence of interactivity between classes of technology that results in cross dependencies, correlation, cross pollination and scale that creates nuances within each segment. It is our implementation of data collection and analysis between segments, comprehensively addressed in our full report, which adds the insight required for confident decision making. Order your copy now.
In our full report, we identify some of the sectoral trends fueling the new digital economy and the innovative technology companies creating value in our research. Let’s break it down by sector:
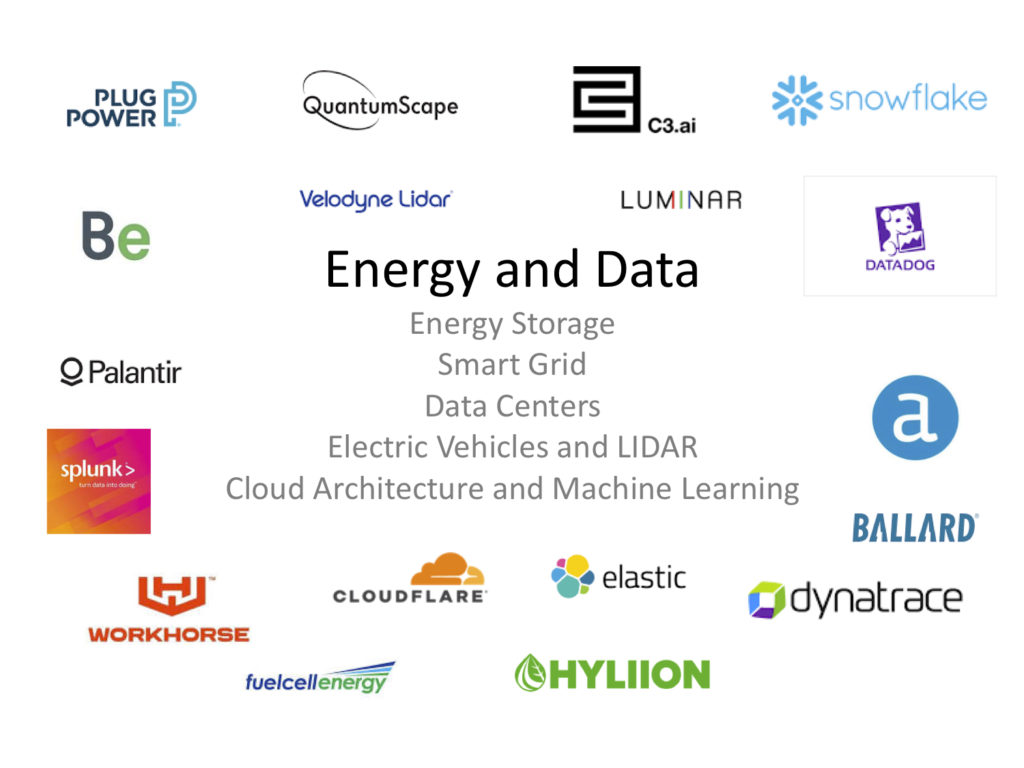
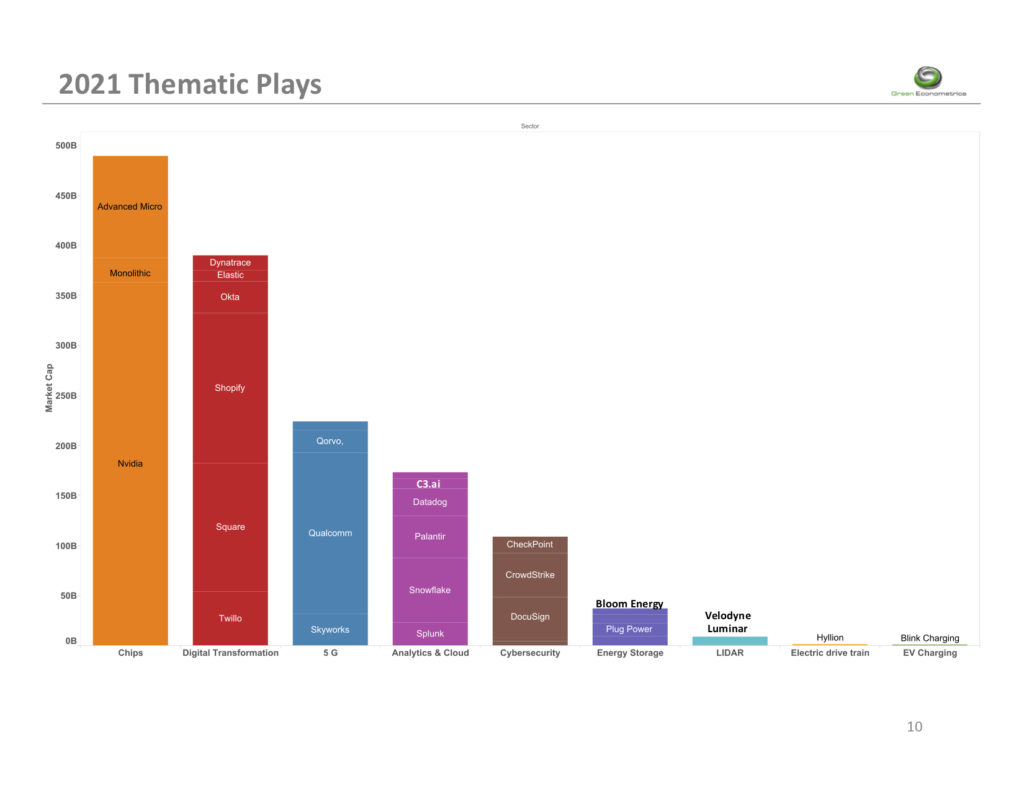
Energy Storage – is the key differentiator for electric vehicles (EVs) and the end-to-end mobility solutions of the future. It also plays a vital role in energy efficiency and resiliency. Energy storage is a core technology to address energy efficiency; critical to controlling carbon emissions, grid resiliency, and providing EV charging solutions. Energy storage systems have substantial benefits for energy consumers, including: industrial, commercial, public, and households. From cost reduction to business continuity and equipment protection, proper energy management delivers significant business efficiencies. There are, however, associated high switching costs for energy storage to be considered. Our focus in our full, in-depth report includes thorough analyses of Plug Power (PLUG), Ballard (BLDP), FuelCell (FCEL), Bloom Energy (BE) and QuantumScape (QS)
Cloud Architecture – another key sector we examine, provides a very cost-effective means of providing separate layers of data storage, computing and transactional services to enterprises and agencies where reliability, scalability and availability are critical to performance and the maintenance of a competitive edge. Virtualization services enable separation of hardware and software as well as method for separating data from control planes. Innovative tools including Databricks and recent IPO Snowflake provide scale and data integration to manage cloud services and data analytics. Our focus in this niche includes Alteryx (AYX), Datadog (DDOG) Palantir (PLTR) Splunk (SPLK) C3.ai (AI) and Snowflake (SNOW).
The pandemic, and to a lesser extent, global climate change are accelerating digital transformation in business, industry, agencies and non-governmental organizations. This transformation is also a transition – to a new way of doing business on all levels; to a new way of looking at the impact and footprint of our business and personal activities; and to a new normal, that is not likely to look a lot like what we’re used to. This coming year will see a number of existing trends accelerate, and new developments which will underlie and drive major changes in business and operational models.
This report will look at a number of industry sectors, as well as the impact of digital transformation on the public sector. In depth reports on each of these sectors are available by yearly subscription for $950 by request.
We have to start somewhere, so let’s take a look at the rather dramatic and emblematic transformation now taking place in the automobile/truck manufacturing sector.
Engendering a data analytics framework culture to optimize process innovation will lead to improving productivity. The adoption of new technologies is often challenging with lagging productivity gains. Investments into business processes contribute to faster adoption of new technologies and higher market valuations. For example, workflow processes provide a framework to better leverage new technologies by shortening the time to productivity gains. In addition, investments into business processes, intangible assets, contribute to higher equity valuations and are often reflected in growing levels of goodwill generated with technology company acquisitions.
As a core process we suggest a data analytics framework using feedback loops to optimize outcomes and deliver a better approach to leveraging technology adoption. This approach ensures that technology adoption strategies and implementations are based on data and driven by process optimization. In addition, employing an analytics roadmap to manage disruptive technology adoption with defined feedback loops set to optimize successful outcomes further improves value.
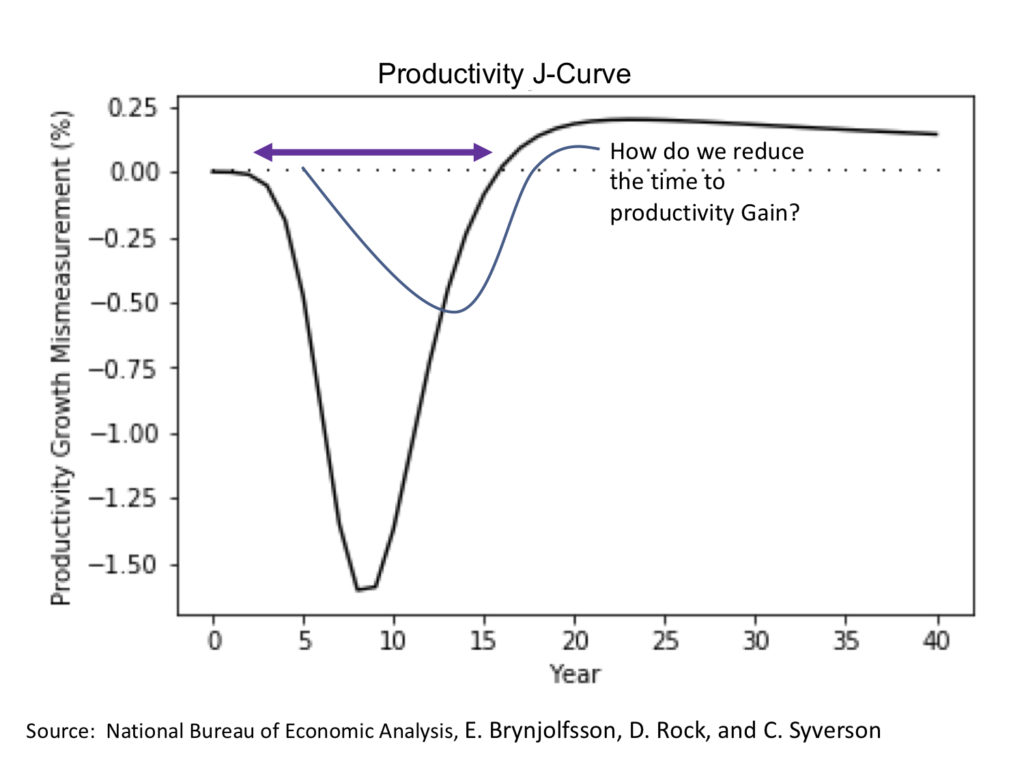
Technology and the Productivity J-Curve Paradox
As mega trends unfold; such as cloud architecture, 5G cellular, big data, IoT sensors along with machine learning, a successful structural framework for embracing these new technologies needs to embrace and address the disruption while engaging with processes that optimize desired outcomes.
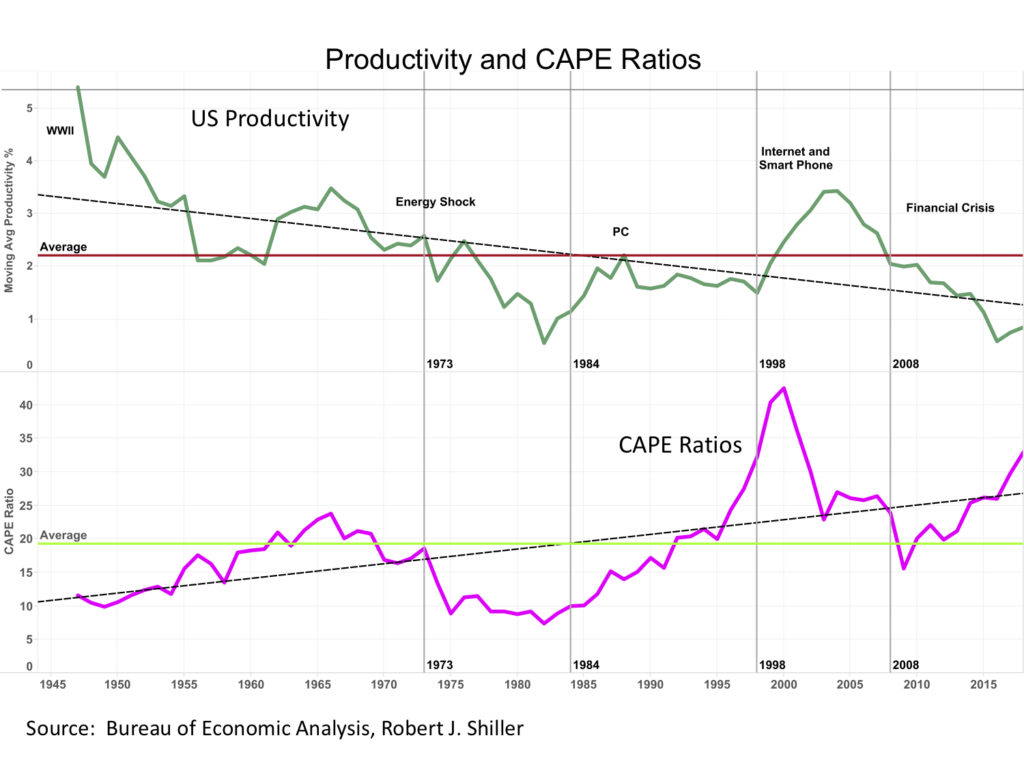
In 1987, Robert Solow, a Nobel Laureate and MIT professor, quibbled about the preponderance of computers and lack of productivity. So this is not a new issue. The economics of business process and the Productivity J-Curve concept was framed by Erik Brynjolfsson, Daniel Rock, and Chad Syverson – who examined the often slow and bumpy productivity gains arising from the adoption of new technologies. Their collective studies from the National Bureau of Economic Analysis offer a compelling rationale for developing business processes that enhance the adoption of innovative technologies. In essence, because training, experience curves, changes to business operations and services lag productivity gains. Their findings suggest “the more transformative the new technology, the more likely its productivity effects will initially be underestimated.” A recent article in The Economist,Reasons to be Cheerful, highlighted how education and training that speed the adoption of new innovation could raise productivity.
A data analytics framework is applicable to insight discovery; provides a roadmap towards innovation; and enables capabilities that can optimize approaches to new business models and opportunities. The following paper provides examples revealing how and why to apply visual analytics for discovery, innovation and evaluating new opportunities.
Discover how waveforms and patterns are applied to science and finance, and how customer usage patterns can reveal new approaches to market micro-segmentation and persona classifications. Lastly we’ll reveal how the deployment of IoT devices across the enterprise fuels data flow in the physical world regarding the performance and conditions of business assets.
Introduction
Our theme is applying visual data analytics as a tool for discovery, innovation and evaluating market opportunities. We show how two metrics, price and volume, are able to convey insight and establish price targets for technical analysis. Why energy consumption patterns and waveforms lend themselves to understanding science and classifying human behavior. How proxy metrics can serve as measures for physical events. Why linking granular visibility into processes and the monitoring of conditions and operating performance help build an advantage in the digital economy.
Green Econometrics relies on visual analytics as a core fabric in our data analytics frameworks because visual analytics are integral to discovery, innovation and new opportunity development. Visual insights are easy to understand – allowing business objective and performance metrics to seamlessly transfer across business units. So how do we do it?