Why Visual Data Analytics: Discovery, Innovation and Opportunities
A data analytics framework is applicable to insight discovery; provides a roadmap towards innovation; and enables capabilities that can optimize approaches to new business models and opportunities. The following paper provides examples revealing how and why to apply visual analytics for discovery, innovation and evaluating new opportunities.
Discover how waveforms and patterns are applied to science and finance, and how customer usage patterns can reveal new approaches to market micro-segmentation and persona classifications. Lastly we’ll reveal how the deployment of IoT devices across the enterprise fuels data flow in the physical world regarding the performance and conditions of business assets.
Introduction
Our theme is applying visual data analytics as a tool for discovery, innovation and evaluating market opportunities. We show how two metrics, price and volume, are able to convey insight and establish price targets for technical analysis. Why energy consumption patterns and waveforms lend themselves to understanding science and classifying human behavior. How proxy metrics can serve as measures for physical events. Why linking granular visibility into processes and the monitoring of conditions and operating performance help build an advantage in the digital economy.
Green Econometrics relies on visual analytics as a core fabric in our data analytics frameworks because visual analytics are integral to discovery, innovation and new opportunity development. Visual insights are easy to understand – allowing business objective and performance metrics to seamlessly transfer across business units. So how do we do it?
We begin by focusing on energy for several reasons. Energy is relatively easy to measure and it is integral to operating a physical or digital business. The physical world is propelled by energy. Energy is used for heat, transportation and the generation of electric power. Also, the movement and behavior of people can be measured through energy consumption signatures or digital footprints. In addition, patterns are revealed from observing the flow of energy from the waveforms produced from electro-magnetic and gravitational forces as well as digital patterns regarding consumer usage, engagements and conversion that play in understanding desire, sentiment and crowd psychology.
Discovery
Why focus on energy: 1) Energy is transformed through waves that often exhibit patterns that can be visually illustrated thereby providing faster time to insight and understanding; 2) Energy drives our economy from production and transportation to electric power as well as powering the digital economy; 3) People consume energy that can be classified into personas which can be illustrated in a consumption signate to reveal patterns.
Visual analytics play a key role in technical analysis where patterns and trends are used to establish stock price targets and classify crowd psychology and consumer sentiment. Visual analytics applies to discovery as wave patterns reveal insight into how and why energy is transformed.
What can data analytics tell us about energy and behavioral patterns? The data analytics framework starts with data accessibility along with the ability to measure and curate data for analysis. Energy consumption leaves tracks similar to the digital footprints in the online economy. Nearly all business activities depend on energy flow leaving a tell into consumption patterns and behavior.
Patterns can be revealed through visual analysis. To better understand visual analysis as a tool for behavioral analysis let’s review how charts used by technical analysts are used to provide clues into sentiment, behavioral finance and crowd psychology. Technical analysis uses price and volume data to provide target price and deliver an understanding of supply and demand for stocks. In this fashion, visual analytics offer insight into behavioral finance and market psychology through identification of patterns and trends using just two metrics – stock price and volume.
The primary factor behind charts and visual analytics is that humans are emotional and irrational and that they often behave similarly under similar circumstances. Therefore, some patterns tend to repeat or become cyclical allowing analysts to project future price targets from chart patterns.
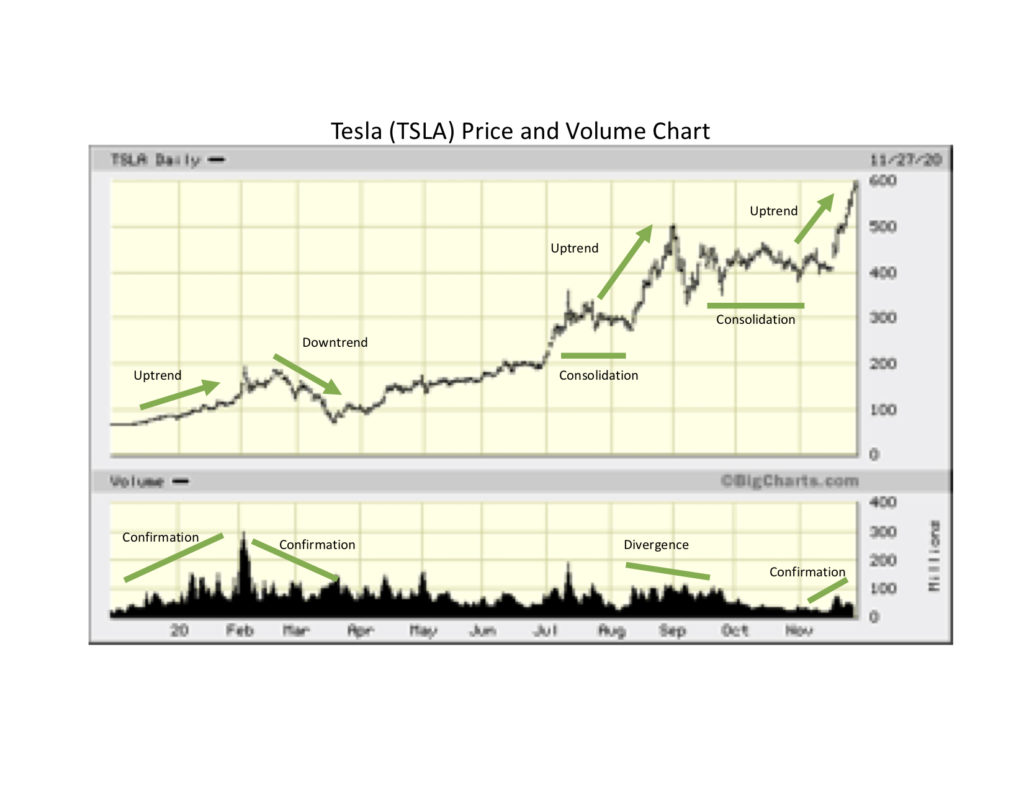
The following exhibit is a price and volume chart for Tesla, (NASDAQ: TSLA). Tesla is a disruptive technology company addressing the electric vehicle (EV), energy storage, distributed grid, solar and autonomous driving markets.
Figure 1 Stock Price Patterns
A major theme in the equity market is that the stock market discounts all available information and that is reflected in the stock price. So, if all currently available information is reflected in the stock price, then the chart shows supply and demand for a given stock. This chart from Big Charts shows trends, inflections points and conviction to the downside and upside.
While it might be easy to capture stock price data and visual charts, data accessibility has constraints. Sometimes proxy values can substitute for discovery and identification of trends. Sometimes data curation and analytics are required to discern trends and patterns.
When it comes to energy, the compilation of data is helpful in discerning trends. As an example, the following exhibit shows the consumption of oil in comparison to electricity. Some context is needed to illustrate the energy consumption trends. Fossil fuels are used in transportation, heating for homes and buildings, in addition to generating electricity. That context helps to understand why the growth trend in electric consumption has important economic considerations.
Going forward, the oil consumption trend appears to wane while consumption of electricity grows more important. This trend might become more evident as the transportation industry more broadly adopts EVs. With most car and truck manufacturers releasing electric cars and trucks, more energy will become electric. How we generate electricity and how efficient we become as consumers of electricity will play a significant role in business operations and industrial competitive advantage. The takeaway from Figure 2 is that electric energy consumption is increasing faster than the consumption of oil. The consumption trend indicates electric average annual growth rate of 4% versus 1% for oil, and when compared against population growth of 1%-to–2%, per capita electric consumption is increasing.
Figure 2 Energy Trends
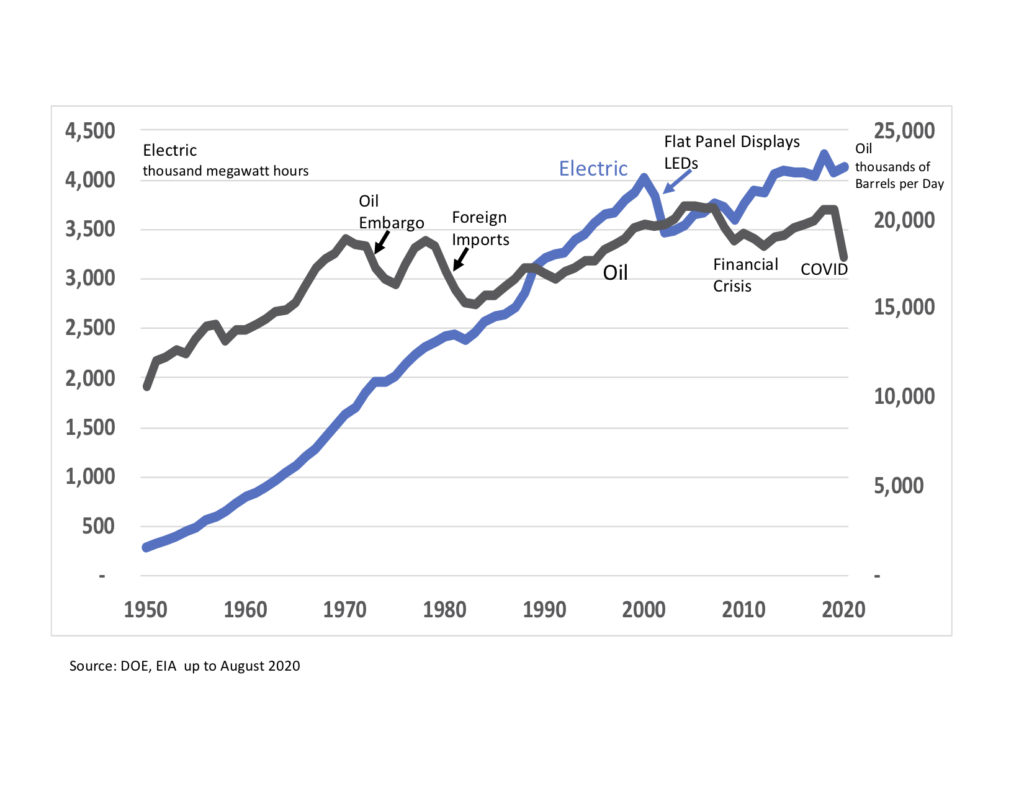
Visual analytics continue to play an increasingly valuable management role. Understanding the relationship among variables and the role of sensors and proxy measures adds to the complexities of models. Still visual tools help explain and clarify identified issues and reveal useful patterns and trends. Adding context to the data significantly improves understanding. For example, the 1973 oil embargo and shift to fuel efficient foreign imports impacted oil consumption. Similarly, shift to energy efficient flat panel TV and computer displays, LED lighting and EnergyStar appliances resulted in improvements in energy savings.
To illustrate, let’s look at how visual analytics can be applied to science discovery. Waveforms can be applied to numerous applications from finance to power quality, efficiency and fault detection in electric motors – as well as scientific discoveries such as detection of gravitational waves to identify black holes using laser interferometer gravitational wave observatory (LIGO) run by Caltech. What is interesting about observational patterns in astrophysics is use of visual analytics to convey meaning and understanding.
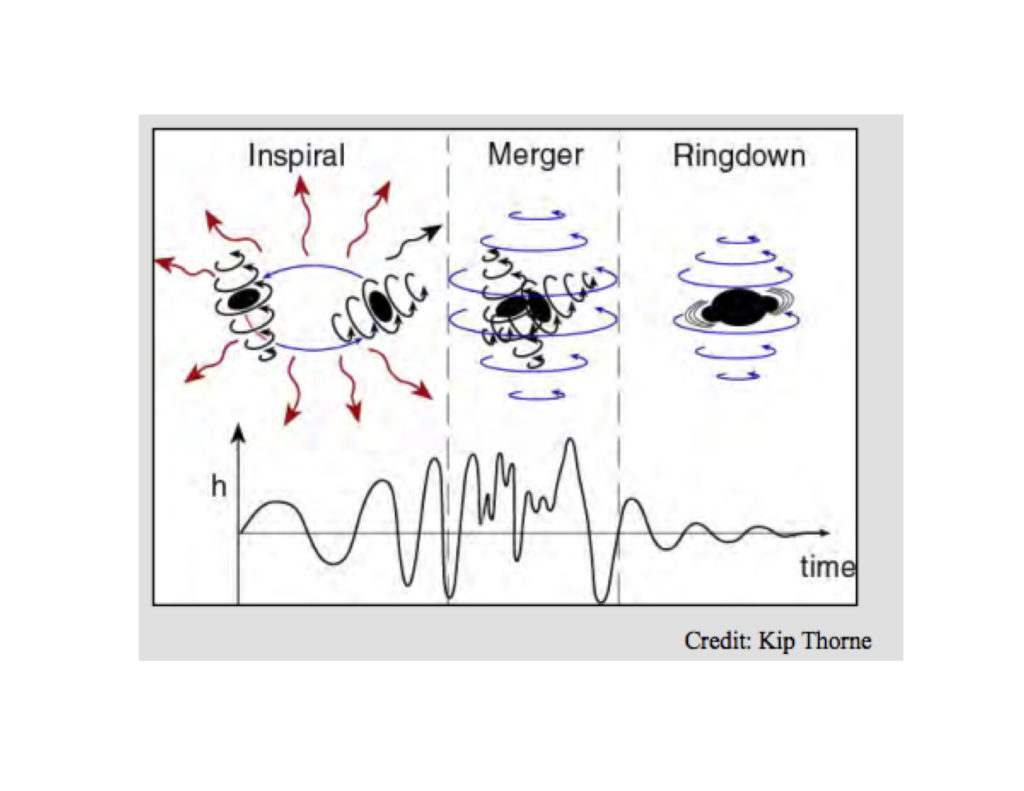
The graphic from LIGO shows the waveform produced from the interaction and consolidation of two black holes. Our point is that deriving trends and patterns starts with simple visual tools including data analytics. The waveforms show a distinctive pattern, a signature formed by gravitational waves. The graphic shows the sequence of two black holes, super compact massive stellular matter, merging into one. Because black holes are so massive, their own gravity prevents them from emitting light as a star kike object. Gravitational waves are a means of detecting the existence of the black holes. These gravitational waves produce a signature waveform thus depicting the behavior and interaction of supermassive stellar objects.
As depicted in Figure 3 LIGO Black Hole Waveforms, the wave graphs are measured by amplitude and frequency. These same wave patterns can be found in an array of physical world measurement such as sound, vibration, electrical, mechanical, light and others. Analog devices and sensors can translate energy flows, particle detection, and interaction into digital data flows which when combined with analytics can provide insight.
Figure 3 LIGO Black Hole Waveforms
Identifying and classifying waveform patterns helps to answer questions. An article in the June 13, 2020 edition of The Economist Science & Technology titled “Something’s in the air” provides a great example of observation and cause and effect. The article describes how by observing wave patterns in the ionosphere, the upper layer of the earth’s atmosphere, scientists can classify and understand terrestrial events that may have caused their occurrence such as earthquakes and volcanoes.
The takeaway is that subtle changes can be measured and classified for event detection and potential impact. In this example proxy sensors detected changes in the density of charged particles, ions, which could be observed and the patterns of behavior were then classified to describe events on earth. The article indicated that the Defense Advanced research Projects Agency (DARPA) was developing AtmoSense to further study ionosphere wave patterns.
This leads us to using observation and data analytics to engender innovation processes. By innovation processes we mean processes designed to link logical relationships of activities to create value. Essentially, we seek to scale and automate high margin business processes.
Innovation
Opower is a company founded in 2007 as a meter reading software-as-a-service platform for utilities to manage customer engagements. Using energy consumption data from eclectic utility meters and data analytics, Opower was able to identify behavior patterns through energy consumption. Programs such as Peak Time Savings, developed by Opower’s behavioral demand response platform, have been embraced by several major utilities. Opower used customer load signatures to understand behavioral patterns and used that profile to develop pricing and marketing programs such as behavioral demand response and micro-segmentation of the market to tailor their messaging.
Where and when energy is consumed is important for utility capacity planning and meeting peak demand. Programs such as demand response to mitigate peak demand periods are helpful to reduce energy consumption but also to reduce capital and operating costs. Analytical tools to measure and benchmark consumer energy consumption patterns against national averages is useful in deidentifying outliers and anomalous circumstances.
Utilities need to match demand to capacity through customer incentives to reduce energy consumption during peak operating hours. The cost to maintain a utility transmission and generation network is capital intensive. A significant limitation for electric utilities is matching supply to demand. Without a cost-effective means of energy storage, utilities are limited in that energy is produced to meet actual demand. The development of the smart grid and renewable micro-grid infrastructure is quite dependent upon energy storage technology. In addition, greater visibility into energy consumption can help mitigate constraints on utility networks.
Access to data and analytics provide a means of addressing utility infrastructure constraints as well as open new opportunities. Data analytics enables better marketing communication by providing insight into customer usage patterns and behavior. Opower with its smart meters and data analytics could analyze the energy consumption data and send a personalized message to customers as a means of incentivizing energy savings.
Time of use energy consumption patterns offer insight into consumer behavior. Using behavioral analysis and data analytics personalized messages can be delivered to customers to motivate them to save energy. The Opower framework focused on behavioral demand response as a means to save energy and allows utilities in their program to personalize targeted incentives to their customers based on the end customer energy usage profile. Customer energy consumption was defined by load shapes, patterns of usage by time of use. The time of use patterns are associated with lifestyles such as day time users, night peaks, or twin peak loads. Oracle (NASDAQ: ORCL), a leading player in database management systems, acquired Opower in 2016 for $532 million.
Opportunities
We are currently at the forefront of technological innovation and the confluence of IoT devices, and data analytics and cost-effective cloud computing are poised to unleash new opportunities in energy efficiency, sustainability and composable business models. Just as granular visibility into business processes can serve to better reconfigure resource allocation, IoT devices lend themselves to understanding conditions and performance of assets, resources, and equipment. IoT connected devices enable data access to when, where, and how energy and resources are consumed.
IoT devices provide better data access through their ability to measure analog signals, translating the physical world into digital flows. Together with wireless network connectivity, IoT devices lower monitoring and measuring costs, thus enabling cost effective data access. When combined with cost-effective machine learning algorithms and cloud computing architecture, a better tool is created to identify opportunities and inflection points that outline the paths to new business models and markets.
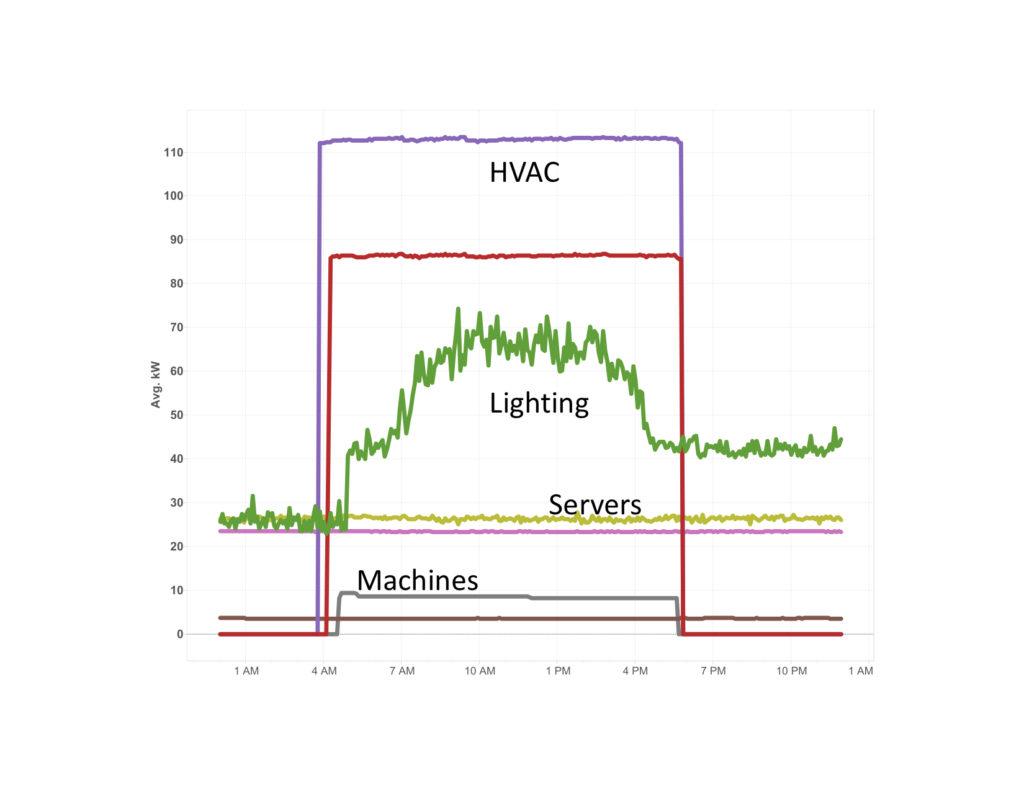
The ability of IoT devices to capture data from a wide array of analog sensors provides granular visibility into process and activities. Going back to our energy focus, current transformers (CTs) can offer consumption detail into where, when and how energy is consumed. The ability to access the data at five-minute intervals enables facility managers to mitigate peak demand charges and initiate programs to improve energy efficiency. The Facility Load Signature chart depicts the time of use energy consumption around key activity parameters. Our findings suggest that heating, ventilation and air conditioning (HVAC) and lighting comprise nearly 75% of electricity usage in an office facility.
Figure 4 Facility Load Signature
When various datasets are interspersed, such as combining IoT sensors monitoring air quality, energy use, waste, production, operating conditions with digital data, opportunities expand dramatically. Therefore, by mapping the physical world conditions, including performance metrics that are aligned to business objectives, and the digital, including behavioral patterns and waveforms, data analytics transforms data flow into digital assets that together create agile and composable business models.
As the buildout of the 5G network infrastructure ensues, data capacity and flow integration coupled with cloud storage and data management architecture, will accelerate and together will leverage the value of visual analytics. These factors contribute to building a competitive advantage in the digital economy.
Summary
The focus of this paper was applying a data analytics framework to discover new understanding; to provide a process for innovation through new business models; and to identify new business opportunities. The theme is applying visual analytics for discovery, innovation and new opportunities. Applying visual analytics such as waveforms and pattern recognition to science and finance can offer new perspectives and intuitive insight. Energy is an interesting lens through which customer usage patterns can reveal new approaches to market micro-segmentation. IoT devices fuel data flow in the physical world and provide a window into the performance and conditions of business assets. A data analytics framework focuses on resource conservation and efficiency optimization from energy efficiency, sustainability and reconfiguring resources to adapting to disruptive business models.
About Green Econometrics
Our analytics framework helps businesses navigate uncertainty with greater confidence and lower risk. The key takeaway is that the competencies developed through implementing a data-driven analytics strategy create value in the business, people, process efficiencies and innovation.
Green Econometrics provides research and consulting services regarding data analytics. Our analytics approach is to identify and define relevant metrics that are aligned to business objectives, measure and benchmark performance, while optimizing outcomes based on machine learning algorithms. We help to benchmark performance with respect to business value creation such as process improvement and operating efficiencies. Part of our business strategy analytics framework may include sustainability metrics regarding environmental conditions such as quantifiable ESG metrics including indoor air quality and energy efficiency. Sustainability, energy efficiency, and process performance metrics are all in our wheelhouse.
Related Posts