Why Visual Data Analytics: Discovery, Innovation and Opportunities
A data analytics framework is applicable to insight discovery; provides a roadmap towards innovation; and enables capabilities that can optimize approaches to new business models and opportunities. The following paper provides examples revealing how and why to apply visual analytics for discovery, innovation and evaluating new opportunities.
Discover how waveforms and patterns are applied to science and finance, and how customer usage patterns can reveal new approaches to market micro-segmentation and persona classifications. Lastly we’ll reveal how the deployment of IoT devices across the enterprise fuels data flow in the physical world regarding the performance and conditions of business assets.
Introduction
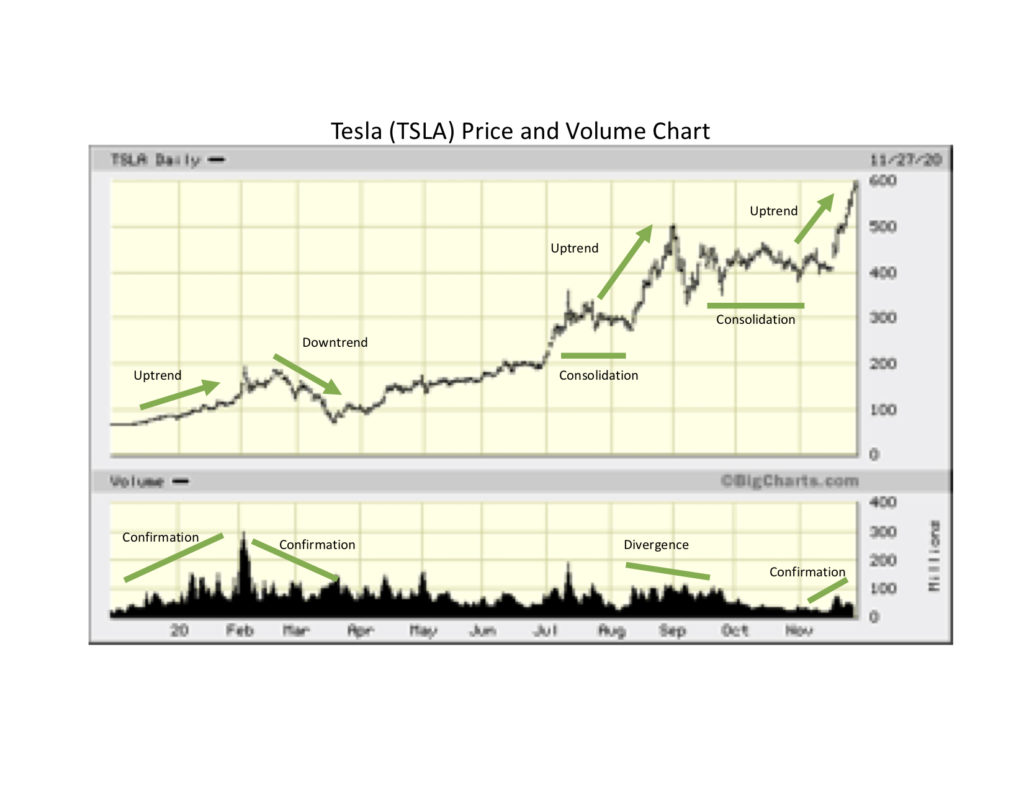
Our theme is applying visual data analytics as a tool for discovery, innovation and evaluating market opportunities. We show how two metrics, price and volume, are able to convey insight and establish price targets for technical analysis. Why energy consumption patterns and waveforms lend themselves to understanding science and classifying human behavior. How proxy metrics can serve as measures for physical events. Why linking granular visibility into processes and the monitoring of conditions and operating performance help build an advantage in the digital economy.
Green Econometrics relies on visual analytics as a core fabric in our data analytics frameworks because visual analytics are integral to discovery, innovation and new opportunity development. Visual insights are easy to understand – allowing business objective and performance metrics to seamlessly transfer across business units. So how do we do it?