Cloud Analytics Disruptive Innovation
Why Cloud Computing and Data Analytics Enable Digital Transformation
From the inception of the Industrial Revolution several core ingredients enabled the transformation and growth of industry. Among these core building blocks of the Industrial Revolution namely: access to risk capital, visionary entrepreneurs, available labor, technology, resources and energy. Technology and energy play a crucial role in not only growing industry but enable scale. Technology can open new markets and provide advantage through product differentiation and economies of scale. Energy is literally the fuel that scales operations.
Today technology, built from knowledge and data, is how companies compete. Energy now emerges as even more integral in scaling operations. Just as James Watt developed the first steam powered engine in 1606 commencing the Industrial Revolution, it was the access to available coal with the use of the steam powered pump, invented by Thomas Savery in 1698, that allowed greater access to coal that gave scale to industry.
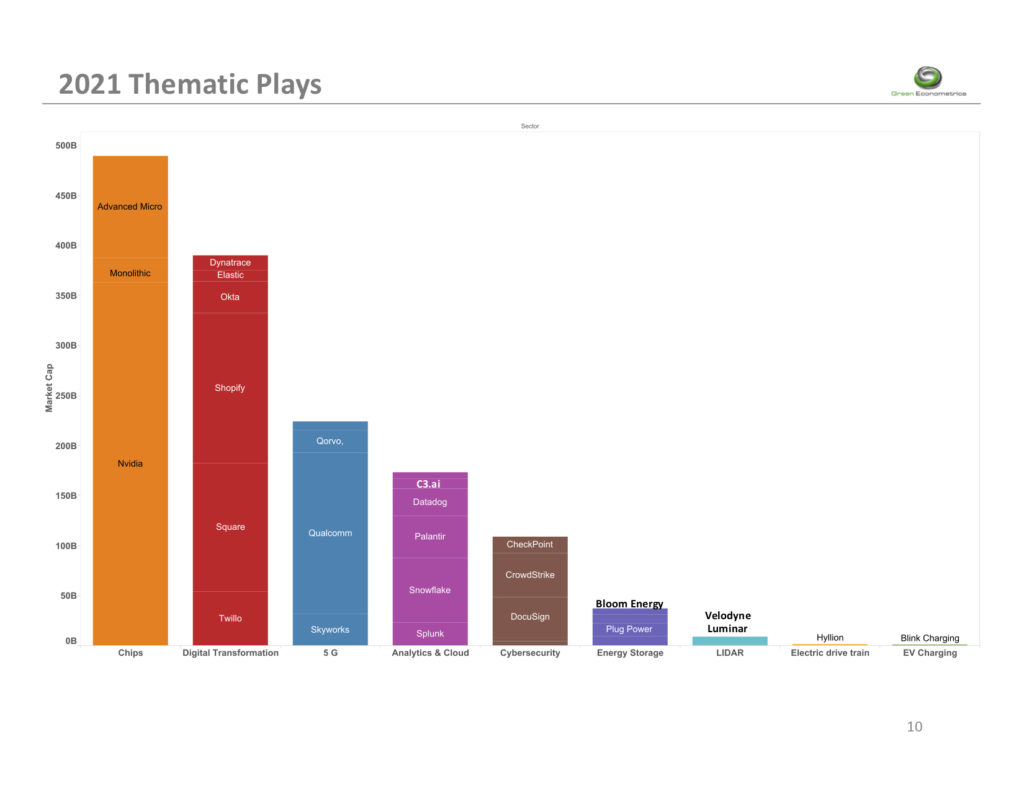
Most recently, the pending transaction of Salesforce’s (CRM) acquisition of Slack (WORK) after acquiring Tableau last year serves as a reference in valuing the importance of technology is to sustaining market value. The market value of seven companies accounts for 27% of the approximately $31.6 trillion for the S&P 500. Evaluating the industry and market impact of innovative technologies can be viewed through the lens of stock valuations, particularly as it applies to mergers and acquisitions. This article reviews the companies and the technologies from the perspective of market sales opportunity and the economic impact of the technologies based on the price/performance disruption to the industry.
So why are we focusing on energy and data today? Energy, predominantly hydrocarbon fuels such as oil, natural gas and even coal is how people heat their homes and buildings, facilitate transportation, and generate electricity to run lights, computers, machines and equipment. In addition, there is substantial investment focus on the digital economy, Environmental and Social Governance (ESG), and innovative technologies. A common thread among these themes is energy and data.
Data and Energy are the pillars of the digital economy. Energy efficiency can reduce carbon emissions, thereby improve ESG sustainability initiatives. Innovative technologies around energy and data are opening new markets and processes from formulating new business models to structuring and operating businesses.
The climate imperative and investing in energy infrastructure and environmental ESGs are predicted on energy efficiency and relevant performance metrics to evaluate investment allocation decisions. Therefore, our initial emphasis begins with a background on energy consumption with focus on electric consumption trends, carbon footprint, Green House Gas (GHG) emissions, sustainability, electric grid resilience, and technologies that impact energy including Electric Vehicles (EV), energy storage, and Autonomous Driving (AD). Data technologies encompass cloud architecture, Software as a Service (SaaS), Machine Learning (ML) analytics, and the importance of data as the digital transformation gives rise to the digital economy.
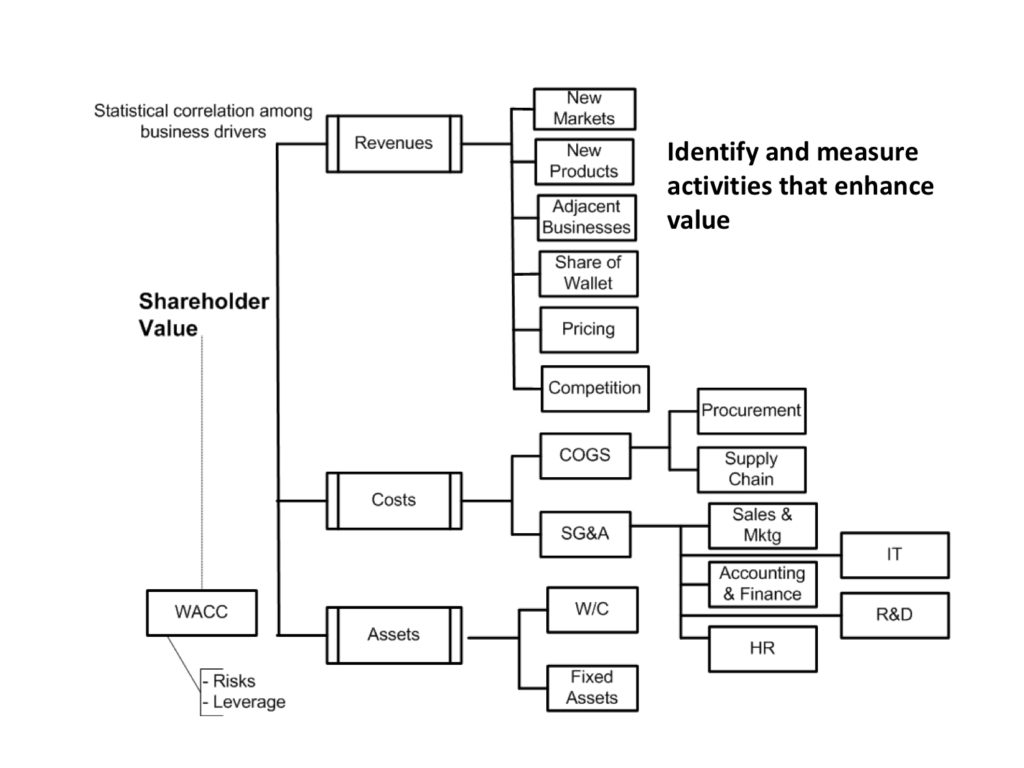
Digital Economy Performance Metrics
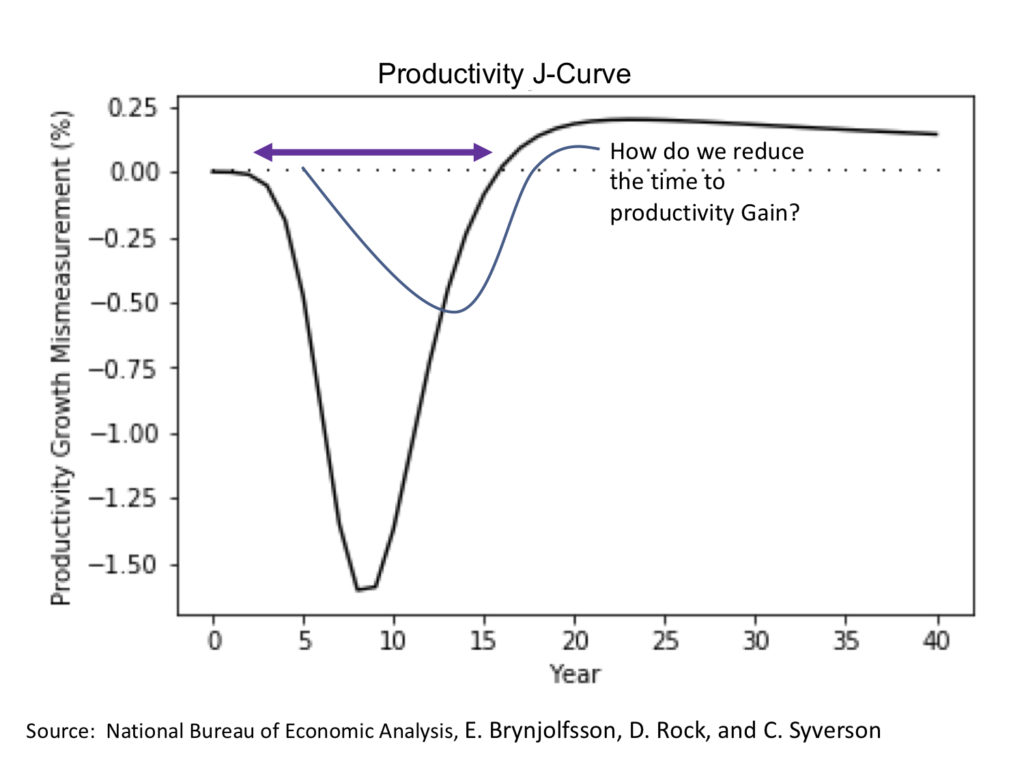
Before we dive into the financial and competitive analysis, let’s review business models that are disruptive to the status quo. That is are innovative technologies capable of rapid scale and efficiency gains that change the economics of the market and business profitability. In addition, disruptive events, driven primarily by technology, often appear as waves as the adoption of innovative technologies expands through the market.