3 Metrics to Guide Air Quality Health & Safety
What it Means to Your Business
Key Air Quality Metrics
This post explores how the use of three key air quality metrics can improve the health and safety of your business. Occupant health and safety are paramount in the current environment and sensors that detect harmful compounds can serve as front line of defense. Given these uncertain times, efforts to reduce risks and improve environmental conditions, will help to better support employees and build customer trust.
Begin the process by establishing a goal such as sustainability or worker productivity. From your goal or objective identify metrics that are aligned with the goal, and then measure your progress toward the goal. Deploying this process improvement framework will improve your business in measureable ways. In this manner we are transforming metrics and data analytics into performance improvement aligned to desired outcomes including sustainability and energy efficiency.
Our approach is to identify metrics aligned to your goals and objectives and provide an analytics framework to assess performance. This involves data curation, our proprietary data architecture and machine learning algorithm to provide context, perspective and visual insight. Key is performance benchmarking for health, safety, sustainability and energy efficiency. These are core environmental metrics and process capabilities that will transform your business model.
To zero-in on important indoor air health metrics, cost effective sensors are required. Based on health and energy efficiency objectives, we found these core indoor environmental metrics, namely carbon compounds including: CO2 and methane, Volatile Organic Compounds (VOCs), and particles. In our previous post, Green Econometrics discussed Air Changes per Hour (ACH) as a measure of air filtration performance – how many times does the air in a room change in an hour? In this manner, monitoring CO2 levels can serve as a proxy for determining acceptable ACHs. It is more cost effective to monitor the number of room air changes per hour using air filtration than to deploy expensive sensors to detect pathogens and viruses.
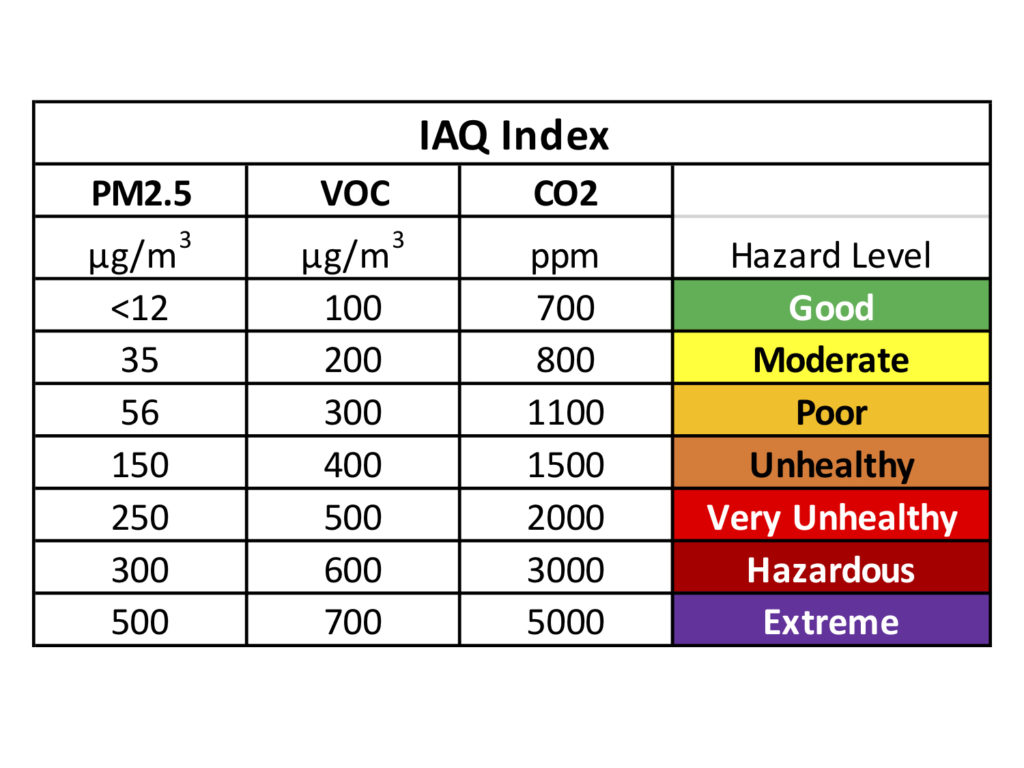
The following exhibit serves to illustrate the scale used to monitor health quality of indoor air. The three key air quality metrics are CO2, measured in parts per million, Volatile Organic Compounds (VOC), measured in micrograms per cubic meter of air (µg/m3), and particulate matter (PM) particles with the sizes of 2.5 micrometers and smaller and are also measured in µg/m3.
Performance Benchmarking to Objectives
How does your facility benchmark against the acceptable indoor air quality index? It is vitally important to get a read on your building. Determine and establish a baseline for operating conditions and performance objectives. A performance objective could be sustainability with emphasis on environmental metrics, employee and customer safety or energy efficiency. Once you have an goal in mind, define metrics relevant to measuring your progress towards that objective.
Several organizations including the Environmental protection Agency (EPA) the American Society of Heating, Refrigerating and Air-Conditioning Engineers (ASHRAE) as well as health organizations such as the American Lung Association have established guidelines of acceptable air quality. Simple policies and procedures in the event of elevated levels for each metric should be established and followed as directed. For example, elevated CO2 levels suggests poor ventilation and low ACH while low CO2 levels may indicate over ventilation and poor energy efficiency. Elevated PM2.5 levels are detrimental to human health and a leading indicator of lung disease. In dealing with VOCs, it is important to identify possible sources of contaminants to ascertain the severity of exposure to elevated VOC levels.
Figure 1 Indoor Air Quality Index
As we discussed in a prior post, CO2 levels can serve as a surrogate to assess employee productivity, occupant safety and as a guide to gauge air filtration and energy efficiency. The American Lung Association indicates that particulate matter (PM2.5) could potentially be the most pernicious to our lungs. VOCs are also important particularly for industrial facilities. By enabling a system to monitor and measure indoor air quality, a useful tool can be created to guide decisions and policies.
Green Econometrics’ analytics approach is to identify and define relevant metrics, align those metrics with business objectives, measure and benchmark performance and optimize outcomes using machine learning algorithms. We help to benchmark performance with respect to process improvement and operating efficiencies. Part of the analytics framework is to include metrics regarding environmental conditions including air quality and energy efficiency as well as operating conditions and performance. Green Econometrics’ mission is to integrate sustainability solutions within the organization; and engineer processes for disruptive abundance thereby improving employee and customer health, plant and campus safety, and overall resource efficiency. We want to engender the best practices for: air, water, food and energy.
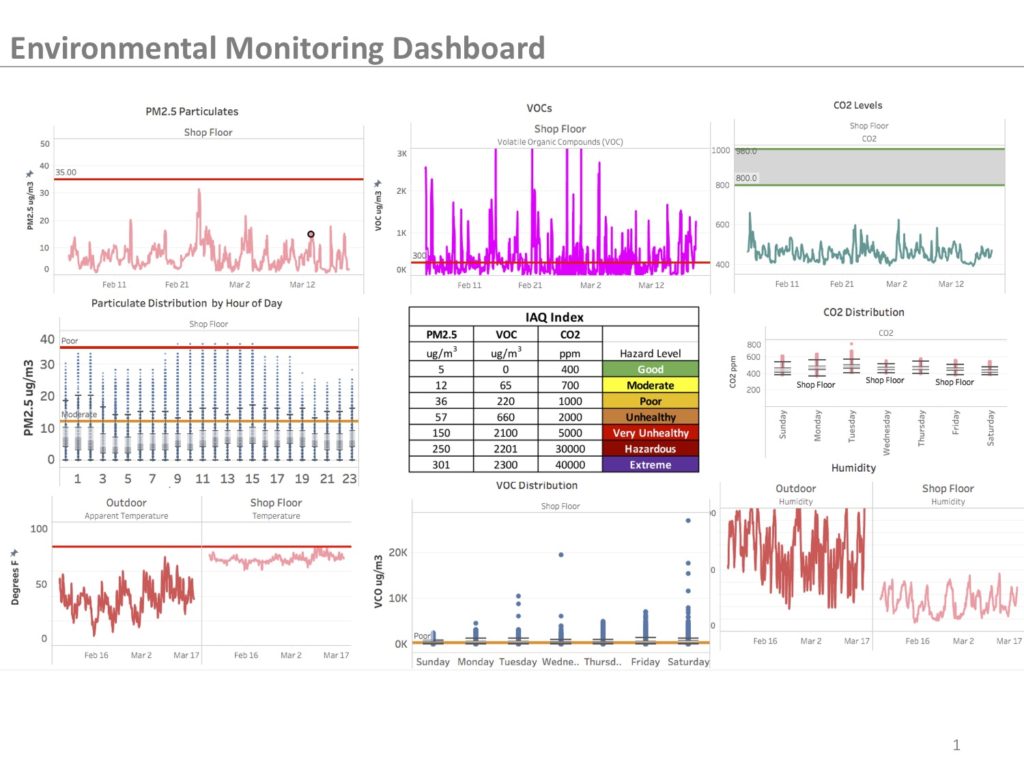
Figure 2 Environmental Dashboard
If we are ever going to secure our buildings and office spaces from the threat of this and other worldwide pandemics, we need to be planning and making the necessary changes now. Let us get you started on the process.
Related Posts