Why Data Analytics Process Blueprints Mitigate Productivity J-Curve and Create Value
Analytics platforms transform technology adoption
Engendering a data analytics framework culture to optimize process innovation will lead to improving productivity. The adoption of new technologies is often challenging with lagging productivity gains. Investments into business processes contribute to faster adoption of new technologies and higher market valuations. For example, workflow processes provide a framework to better leverage new technologies by shortening the time to productivity gains. In addition, investments into business processes, intangible assets, contribute to higher equity valuations and are often reflected in growing levels of goodwill generated with technology company acquisitions.
As a core process we suggest a data analytics framework using feedback loops to optimize outcomes and deliver a better approach to leveraging technology adoption. This approach ensures that technology adoption strategies and implementations are based on data and driven by process optimization. In addition, employing an analytics roadmap to manage disruptive technology adoption with defined feedback loops set to optimize successful outcomes further improves value.
Technology and the Productivity J-Curve Paradox
As mega trends unfold; such as cloud architecture, 5G cellular, big data, IoT sensors along with machine learning, a successful structural framework for embracing these new technologies needs to embrace and address the disruption while engaging with processes that optimize desired outcomes.
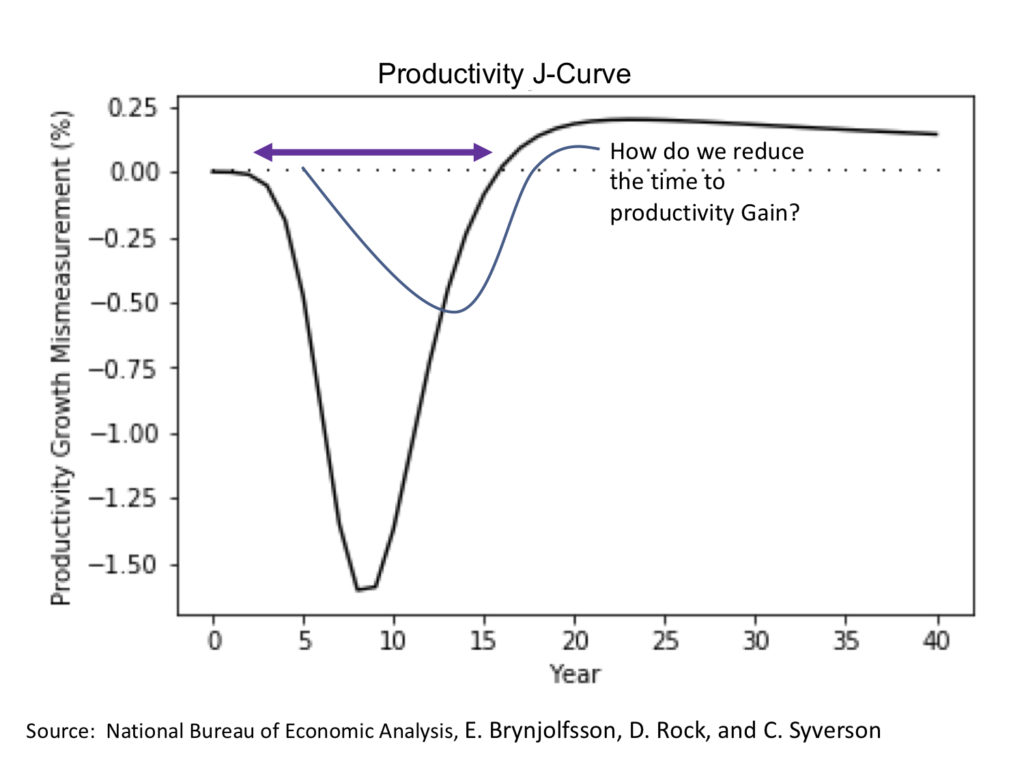
In 1987, Robert Solow, a Nobel Laureate and MIT professor, quibbled about the preponderance of computers and lack of productivity. So this is not a new issue. The economics of business process and the Productivity J-Curve concept was framed by Erik Brynjolfsson, Daniel Rock, and Chad Syverson – who examined the often slow and bumpy productivity gains arising from the adoption of new technologies. Their collective studies from the National Bureau of Economic Analysis offer a compelling rationale for developing business processes that enhance the adoption of innovative technologies. In essence, because training, experience curves, changes to business operations and services lag productivity gains. Their findings suggest “the more transformative the new technology, the more likely its productivity effects will initially be underestimated.” A recent article in The Economist, Reasons to be Cheerful, highlighted how education and training that speed the adoption of new innovation could raise productivity.
Figure 1 Productivity J-Curve
Investments in technology require the right workflow processes that are able to leverage both the technological innovation and its assimilation into business operations. Without timely technological integration, the true measurement of productivity gains is muted. Therefore, investment into intangible assets such as employee training, retooling and business processes are prerequisites to better capitalize on technology investment.
The issue with productivity metrics is that the creation of intangible assets has not often been counted in productivity growth. Intangible assets are non-physical items, consisting of goodwill, patents, formulas, process techniques, customer relationships among others. Intangible assets play an increasing role in valuing a business. These intangible assets, both identifiable and unidentifiable, can be very substantial yet hard to quantify under generally accepted accounting principles. When a company is acquired, these intangibles are measurable and reflected as goodwill to the acquiring company. Acquisitions are influenced by the nature of how goodwill is calculated. Goodwill is recognized as the premium paid for a company above the fair value of assets and liabilities. Part of the issue with productivity measurements resides with the measurement of intangibles both as capital investment and intangible outputs.
A proxy for evaluating the contribution of intangible assets to productivity and ultimately business value, is the premium a firm will pay for unidentifiable intangible assets in the form of goodwill. The premium a company is willing to pay over fair market value, often measured as market value to revenue ratio (or price-to-sales ratio), is often quite substantial for innovative technology companies. When Facebook (NASDAQ: FB) acquired WhatsApp in 2014, it recorded $15.3 billion in goodwill on revenue of $10 million indicating the growing importance of intangible assets. Microsoft (NASDAQ: MSFT) acquired LinkedIn in 2016 for $26.2 billion and recorded roughly $16 billion in goodwill. Over the last decade, Alphabet (NASDAQ: GOOG), Facebook, and Microsoft increased their market value to goodwill ratio by 79X, 39X and 32X fold, respectively.
Figure 2 Goodwill
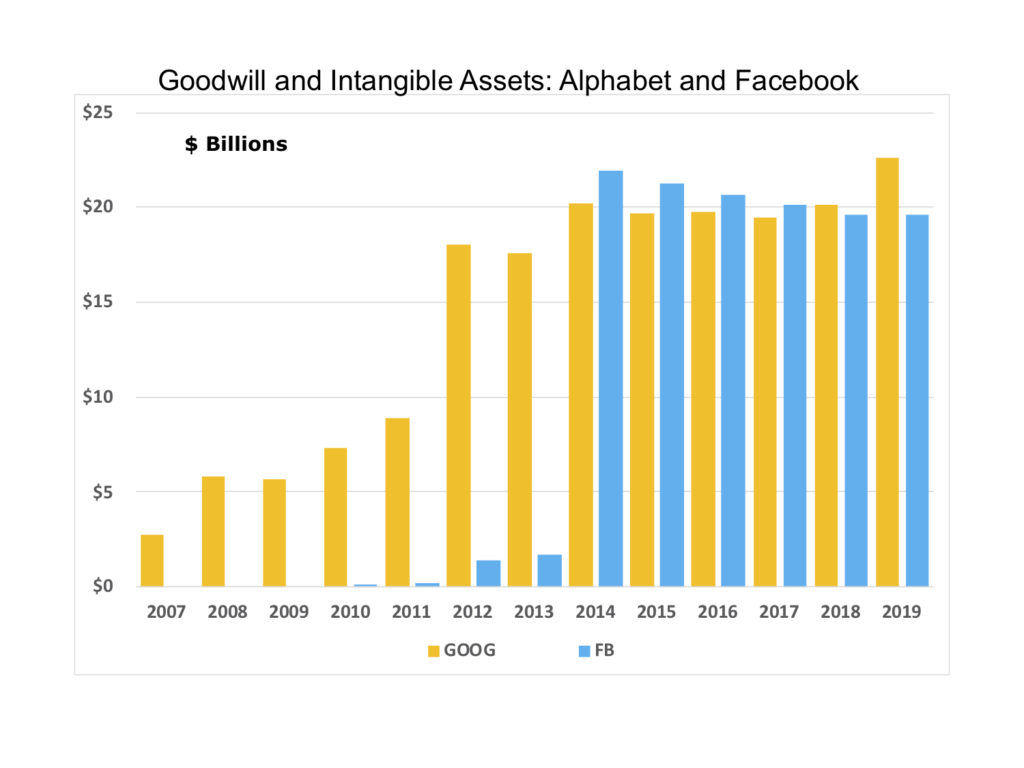
While some may argue the value of goodwill in M&A, it’s hard to argue with the fact that Microsoft’s market valuation grew from $460 billion in 2016 to $1.6 trillion in 2020. A recent study by Calcbench on the goodwill on balance sheets indicates goodwill, specifically intangible assets, are now comprising a growing portion of equity and asset value. Goodwill represents over 40% of the equity value of all public companies and nearly 10% of the total assets of the S&P 500. The goodwill to asset ratio trends suggests an increasing level of intangible assets. Large allocations to goodwill reflect the value intangible assets provide, particularly in the digital economy.
Resource Allocation and Intangible Assets
Our takeaway is that intangible assets such as processes and formulas are growing in importance in the digital economy and now, we are finding that composable workflow processes provide additional value as a means to improve productivity because processes can leverage technology adoption.
Implementing the analytics process itself can serve to assimilate new technologies faster and create business value while offering a sustainable competitive advantage. The Productivity J-Curve and lack of immediate dividend on intangible investments may exacerbate the latency of technological payback. The Productivity J-Curve limits time to value because of uncertainty around resource allocation, technology selection and lack of a process roadmap.
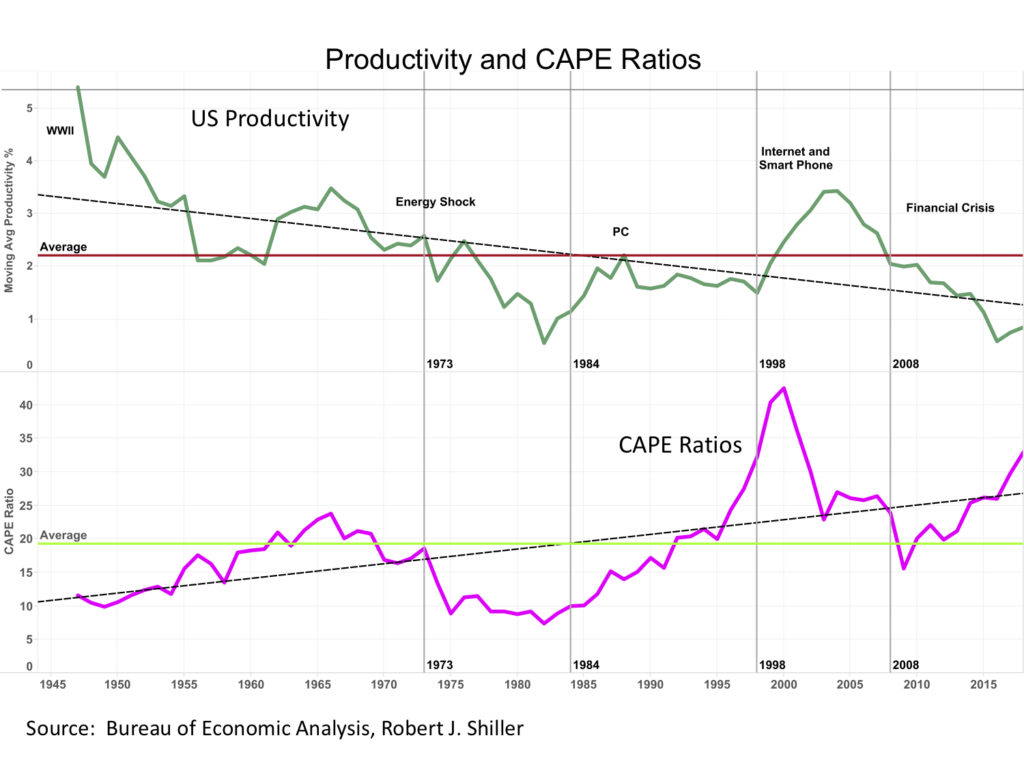
While productivity growth becomes more difficult to measure in terms of intangible inputs and outputs, the market continues to offer premiums to expectations. The Shiller CAPE (Cyclically Adjusted Price Earnings) ratio provides insight into market valuations. From the late 1970’s to current times the level of productivity growth has fallen below its historic mean. Over this same period the CAPE ratio is significantly above the mean equity valuation parameter.
Figure 3: Productivity and CAPE Ratio
Could business investment into intangible assets provide additional payoff and value? Intangibles are associated with brand name, employee talent or customer relationships. As the economy further expands toward digital commerce, a company depends more on intangible assets. This migration towards the digital economy may depend more on intangible assets reflecting the value of intellectual property (IP) formulas and workflow processes. What role do business processes play in bridging strategy to value? When the workflow process incorporates an analytics framework that aligns performance metrics to desired outcomes through feedback loops, time to productivity payback is reduced.
Digital Transformation
As more companies begin to address the digital economy and recognize the importance of processes to leverage new technologies and augment business models, analytics and machine learning will take center stage.
Mega Trends
Let’s review some of the major trends fueling the new digital economy.
- Cloud Architecture provides very cost-effective means of providing separate layers of data storage, computing and transactional services where reliability, scalability and availability are critical. Virtualization services enable separation of hardware and software as well as separating data from control planes. Innovative tools including Databricks and recent IPO Snowflake (NASDAQ: SNOW) provide scale and data integration to manage cloud services and data analytics.
- Big Data – growth in digital and data capture from mobile devices is accelerating the growth in data. Data is accelerating in three Vs: volume, velocity and variety. From server log files to sensor devices the pace will continue as more commerce moves online. Datadog (NASDAQ: DOOG) and Splunk application and cloud service performance monitoring (NASDAQ: SPLK)
- Analytics and Machine Learning – with numerous approaches to statistical analysis and machine learning algorithms proliferating coupled with advances in graphical processing units (GPUs) from Nvidia (NASDAQ: NVDA) and AMD (NYSE: AMD) provides the added computational power to generate faster time to insight and navigate uncertainty. Alteryx (NYSE: AYX), DataRobot and RapidMiner provide visual and machine learning algorithms to gain data insight.
- 5G Cellular Networks – As 5G network infrastructure is deployed, bandwidth capacity could improve by 20-fold. Some discussion indicates an 80-fold increase in bandwidth to carry various data sources. Software Defined Network (SDN) and Cloud Radio Access Networks (C-RAN) offer the promise of virtualized end-to-end services to address multiple vertical market applications. Because of signal attenuation of ultra-high 5G bandwidth capacity, the network infrastructure requires greater density of urban base stations along with backhaul. Qualcomm (NASDAQ: QCOM) and Ciena (NASDAQ: CIEN) have developed innovative voice and data network infrastructure approaches.
- IoT (Internet of Things) sensors – granular visibility into performance and conditions of assets, equipment and processes provide an explosive growth in data. IoT devices provide near real time details of energy, environmental and workflow processes. Senseware offers an array of energy and environmental monitoring sensors and a network communications system for IoT sensors while Monnit has developed a broad line of analog sensors.
- Cybersecurity – as commerce moves towards digital transactions vulnerabilities must be managed. The proliferation of connected devices driven by cloud computing and workforce mobility is growing rapidly with projections by Cisco Systems (NASDAQ: CSCO) expect the number of connected Internet devices will grow from 18 billion in 2017 to 28 billion by 2022 suggesting more focus on endpoints. Leading cybersecurity players such as FireEye (NASDAQ: FEYE) are involved in the detection and prevention of major cyberattack and CrowdStrike (NASDAQ: CRWD) in leveraging high fidelity endpoint device data to the cloud to scale analytics.
Workflow Processes Leverage Technology to Create Value
How can a business Improve the payback from investments in intangible assets like workflow processes? The development of digital talent, data analytics and integration of business strategy will play a growing role in the digital economy and enhance business value. Business focus in the digital economy will depend more on leveraging technology and process to develop composable and agile business models. Process, therefore, becomes an important intangible asset. When process methods incorporate data analytics and establish feedback loops, a roadmap to optimization is created. Therefore, data analytics processes might just be more effective in comparison to other intangible attest such as formulas, recipes, and customer engagement experience. Data analytics and machine learning built into the workflow process leads to better outcomes and additional value creation.
Analytics Process Framework
Business processes are designed to link logical relationships of activities to create value. Building culture around analytics processes for innovation, workflow scale and automation of high margin business activities adds value. The analytics process roadmap uses machine learning algorithms to optimize performance to meet specifically defined business objectives. The combination of granular visibility into business process operations and performance metrics, machine learning and statistical algorithms will improve performance, and provide a feedback mechanism that enables navigation on a path to optimize key results.
A properly designed analytics process is a blueprint that employs a dynamic approach focusing on key metrics from which remotely monitored data is measured and cataloged in a format that provides insight as well as the ability to benchmark progress towards goals and objectives. The analytics process roadmap offers a visual framework to access data, measure performance, and guide the decision process with data-driven insight. The key is enabling a feedback mechanism with corrective approaches to deliver the desired outcome and business objectives as well as the analytics process culture to engage and empower employees.
Composable and Agile Business Models
With heightened uncertainty and disruptive technology there are crucial tactics in business strategy to better manage technological adoption and navigate uncertainty. Our post on composable and agile business models discusses analytics processes that serve to create business value: 1) composability, the framework and interrelationships among component parts that can be reassembled to transform the business model; and, 2) business process agility, the ability to reconfigure resources and business processes for innovation and scale. These approaches enhance decision making in uncertain times and improve business performance with measurable results which might be the right tool for your business.
By leveraging technology and process a dynamic platform is created that accesses data from business intelligence systems and endpoint data using machine learning and visual algorithms at scale and delivers insight for decision support. In this manner, cloud architecture, analytics, endpoint secure IoT, and big data are combined into a process that delivers actionable insight in near real time. It’s the process that ties the technology components together. As one leading Silicon Valley CEO noted, just knowing the correct ingredients to bake a cake is not enough, one must know the steps involved in delivering the right results. This is why process might carry more importance than best of breed IT selection. And analytics may serve as the best architecture for new business processes.
A business strategy analytics framework provides a guide to developing these digital assets and realizing the consequent competitive advantage by identifying potential disruptive events and applying decision support using probabilistic outcomes based on data. These capabilities will expand market opportunities and enable efficient operating procedures to address these markets along with the agility to apply resources based on business objectives and expected outcomes. Learn more about how a data analytics culture can impact your business.
Summary
As businesses adopt new technologies, the promise of payoff is somewhat distant and challenging to achieve. Engendering a culture of process innovation built upon a data analytics framework enables new and improved business processes that will enhance productivity and business value. The value of intangible assets can be found in the amount of goodwill generated with technology company acquisitions. As mega trends unfold including cloud architecture, 5G cellular, big data, IoT sensors and machine learning, why not embrace a process strategy predicated on data analytics? The data analytics framework offers a structural foundation to leverage technologies with processes that optimize desired outcomes.
A Green Econometrics analytics framework helps businesses navigate uncertainty with greater confidence and lower risk. The key takeaway is that the competencies developed through implementing a data-driven analytics strategy create value in the business, people, process efficiencies and innovation.
Green Econometrics provides research and consulting services regarding data analytics. Green Econometrics’ analytics approach is to identify and define relevant metrics that are aligned to business objectives, measure and benchmark performance, while optimizing outcomes based on machine learning algorithms. We help to benchmark performance with respect to business value creation such as process improvement and operating efficiencies. Part of the business strategy analytics framework may include sustainability metrics regarding environmental conditions such as quantifiable ESG metrics including Net Zero, indoor air quality and energy efficiency. Sustainability, operating conditions and performance are all in our wheelhouse.
Related Posts