Disruptive Innovation – Why Energy Storage is Crucial Infrastructure
From the inception of the Industrial Revolution several core ingredients enabled the transformation and growth of industry. Among these core building blocks of the Industrial Revolution namely: access to risk capital, visionary entrepreneurs, available labor, technology, resources and energy. Technology and energy play a crucial role in not only growing industry but enable scale. Technology can open new markets and provide advantage through product differentiation and economies of scale. Energy is literally the fuel that scales operations.
Today technology, built from knowledge and data, is how companies compete. Energy now emerges as even more integral in scaling operations. Just as James Watt developed the first steam powered engine in 1606 commencing the Industrial Revolution, it was the access to available coal with the use of the steam powered pump, invented by Thomas Savery in 1698, that allowed greater access to coal that gave scale to industry.
Most recently, the pending transaction of Salesforce’s (CRM) acquisition of Slack (WORK) after acquiring Tableau last year serves as a reference in valuing the importance of technology is to sustaining market value. The market value of seven companies accounts for 27% of the approximately $31.6 trillion for the S&P 500. Evaluating the industry and market impact of innovative technologies can be viewed through the lens of stock valuations, particularly as it applies to mergers and acquisitions. This article reviews the companies and the technologies from the perspective of market sales opportunity and the economic impact of the technologies based on the price/performance disruption to the industry.
So why are we focusing on energy and data today? Energy, predominantly hydrocarbon fuels such as oil, natural gas and even coal is how people heat their homes and buildings, facilitate transportation, and generate electricity to run lights, computers, machines and equipment. In addition, there is substantial investment focus on the digital economy, Environmental and Social Governance (ESG), and innovative technologies. A common thread among these themes is energy and data.
Data and Energy are the pillars of the digital economy. Energy efficiency can reduce carbon emissions, thereby improve ESG sustainability initiatives. Innovative technologies around energy and data are opening new markets and processes from formulating new business models to structuring and operating businesses.
The climate imperative and investing in energy infrastructure and environmental ESGs are predicted on energy efficiency and relevant performance metrics to evaluate investment allocation decisions. Therefore, our initial emphasis begins with a background on energy consumption with focus on electric consumption trends, carbon footprint, Green House Gas (GHG) emissions, sustainability, electric grid resilience, and technologies that impact energy including Electric Vehicles (EV), energy storage, and Autonomous Driving (AD). Data technologies encompass cloud architecture, Software as a Service (SaaS), Machine Learning (ML) analytics, and the importance of data as the digital transformation gives rise to the digital economy.
Digital Economy Performance Metrics
Before we dive into the financial and competitive analysis, let’s review business models that are disruptive to the status quo. That is are innovative technologies capable of rapid scale and efficiency gains that change the economics of the market and business profitability. In addition, disruptive events, driven primarily by technology, often appear as waves as the adoption of innovative technologies expands through the market.
Prominent technological waves such as the personal computer (PC), followed by the internet and smartphones and most recently social media and cloud computer all manifested themselves in engendering new business models and creating new market opportunities that dramatically changed the status quo among leading companies at the time. We will use the internet and mobile technology waves to explain how the introduction of innovative technologies offering vastly improved means of commerce enabled the development of new services that changed the business landscape.
Most recent advances in technology appear as waves and give rise to new business models and markets. The internet is one example. The internet enables the connection and process of communication over a new channel. The internet allowed one-to-one and one to many communications and the ability to engage, transact and scale using a digital platform that tremendously lowered the cost of engagement. Scale is among the most important attributes of the internet because the cost of digital replication is close to zero.
Mobile and smartphones began a new era in the digital world. The smartphone allowed a large portion of the world to interact with the internet for the first time on a mobile device. The mobile wave provided platform that enabled the introduction of a host of new business models. The introduction of the Apple iPhone gave way to several new services and industries all from your cell phone.
Let’s review the business model impact of innovative technologies as it applies to cost structure.
Cost Structure and Disruptive Innovation
As explained by ARK Investment Management’s Catherine Wood, the rate of cost decline can be used as a proxy for evaluating the disruptive impact of innovative technology. Cost structure improves as unit production expands. As first postulated by Theodore Wright, an aerospace engineer, who postulated that “for every accumulated doubling of aircraft production, costs fell by about 20 percent”. Wright’s Law as it is now known is also called the Learning Curve or Experience Curve and it is found across industries that experience different rates of declining costs.
What is important from the perspective of investment firms such as Ark is that the magnitude of disruptive impact can be gleaned from these declining cost curves. Revenue growth can then be correlated from these declining cost curves. Essentially, demand elasticity and future sales can be derived from the rate of product cost declines.
This is why price/performance and scientific metrics play an important role in evaluating products, services and company competitive positions. For example, the average cellular price per gigabyte (GB) of data is approximately $12.37 in 2020 according to Small business trends. Another example in science, is the physical performance of an LED light assessed by lumens the light output to the amount of energy consumed in watts such as lumens/watt (Lm/W). These metrics are points in time. For more context, the changes over time and magnitude of change provide insight into inflection points, trends, patterns and relationships.
As devices become complex, encompassing separate processors for communications, computing, power, video and various sensors, it is the integration and orchestration of the overall device performance that becomes of greater value to the user. So, price/performance, scientific understanding and economics become more attuned to relationships among these varied and interdependent components.
TAM Expansion Attribute
Total Addressable Market expansion attribute applies to value features that enable the product or service to address a larger market opportunity. For example, offering an EV battery that supports longer vehicle driving range and shorter charge time provides a broader solution to allow more consumers to benefit from the battery feature and therefore capture a larger portion of the market. Quantifying the value proposition so that the market easily understands the benefits can help drive revenues and create a competitive advantage for the supplier
Transaction Costs
Transaction costs are an interesting and often overlooked economic impact on business operations. Transaction costs involve monitoring, measuring, and managing business activities. Transaction costs were defined by Ronald Coase, the 1991 Nobel Prize laureate in Economics with “The Nature of the Firm,” published in 1937. By reducing transaction costs, advances in technology and innovation can translate into higher productivity.
For instance, to facilitate exchange of goods and services, agreements and specifications as to weight, size, volume, ingredients, and performance need to be established. The verification and monitoring of these values involve transaction costs. Minimizing activities associated with managing, monitoring, and measuring reduce transaction costs.
In general, the more goods and services are standardized, the lower the transaction costs. Data and in particular, analytics play key roles facilitating information flow and enhancing decision making.
Scale
The internet has removed geography as a limitation for commerce. The internet enables the ability to communicate and conduct the sales in the same transaction. A standardized approach to transporting data reduced transaction costs associated with monitoring and managing transactions helping to improve productivity. Data over the internet from PC and cellular phones continues to escalate measuring data traffic in the billions of terabytes. The ability to leverage the scalability of internet data transport virtually eliminates transaction costs. The ability to scale substantially improves productivity and thus enables the creation of new business models that disrupt the status quo and open new markets.
Another way to look at scale is Moore’s Law. Gordon Moore, CEO and co-founder of Intel, in 1965 postulated that the number of transistors per silicon chip doubles every year. Moore observed that the number of transistors on a computer chip was doubling about every 18–24 months giving rise to unprecedented improvements in computer processing.
A better understanding of the value of scale is to review Bob Metcalfe who proposed that a network’s value is proportional to the square of the number of nodes in the network. Bob Metcalfe co-invented Ethernet, co-founded 3COM. One way to look at this is to ask what is the value of a cell phone if no one else had a phone or what would be the value of Facebook (FB) if you were the only one on the platform.
Cloud computing lends itself to both scale and lowering transaction costs. Cloud architecture supporting compute, storage and cloud service offerings such as SaaS and platform-based services orchestrated by an array of companies including Apple (AAPL), Amazon (AMZN), Alphabet (GOOG), Facebook, Netflix (NFLX) and many others, demonstrates the formamide disruption of the cloud scale achieves.
Ease of Use
Often overlooked, but ease of use is essential in driving market acceptance on and revenue growth. Just as web browsers allowed more people to experience the internet, enabling a broader audience is key to opening new markets. The iPhone might serve as a prime example of how ease of use can act as a transformative method to enable innovative technologies to bridge the chasm to reach the main street market.
Uncertainty
Decision making facing uncertainty elevates risks and costs in the decision process. Data and analytics help to mitigate uncertainty and risks. Increasing uncertainty increases the costs of decisions. Greater access to data and analytics helps to manage costs by offering perspective, context and insight.
Productivity and Process
When the workflow process incorporates an analytics framework that aligns performance metrics to desired outcomes through feedback loops, time to productivity payback is reduced. From our post on Why Analytics Process Blueprints Mitigate Productivity J-Curve and Create Value engendering a data analytics framework culture to optimize process innovation will lead to improving productivity. The emphasis is that the adoption of new technologies is often challenging with lagging productivity gains and therefore companies that embrace a technology process adopt productivity gains faster. Technology process adoption begins with curating performance metrics that align with business objectives. Data and analytics help to define the process by identifying performance metrics that optimize outcomes through monitoring and measuring data flow.
Standardization
Standardization assists in reducing transaction costs which often translate into higher productivity. To facilitate the exchange of goods and services, specifications as to weight, size, volume, ingredients, and performance are established.
For example, world trade accelerated after the advent of containerized shipping. with the introduction of containerized shipping. Adoption of containerized shipping with standardization and uniformity in packaging, logistics, and operations dramatically reduced costs and improved productivity of global trade. Alphabet introduced Google Cloud services in 2014 using containerized applications and workloads facilitated over the cloud giving rise to Kubernetes. Kubernetes are now an open-source system to deploy, scale, and manage containerized workloads and applications over the cloud. They make it easier, faster and cheaper to manage cloud services.
Better, faster, cheaper has been the mantra product innovation and an attribute to define the magnitude of disruption. We will use the disruptive economic framework and financial analysis to better illustrate what technologies are game changers.
Financial Analysis Approach
This article will explore how data and energy are linked and metrics used to analyze the disruptive impact of new technologies. We will explore two approaches to evaluate financial performance and the economic impact of disruptive technologies. The financial lens from which we view innovative energy and data-oriented companies will focus on several metrics including:
- Return on Invested Capital (ROIC)
- Capital Intensity – Invested Capital
- Revenues and Revenue Growth Rate
- Market Valuation Price-to-Sales (P/S) Ratio
- Operating Cash Flows
To assess the impact of disruptive technologies, our framework will engage performance metrics to quantify the magnitude of the economic impact. Specifically, price/performance metrics geared toward measuring the economic impact on the industry and relative competitive dynamics resulting from the introduction of innovative technologies around energy and data. An understanding of both the level of technological improvement and how investors view technology companies provides the framework to assess trends and inflection points.
Technology – Competitive Economic Analysis
Where direct measurement can be applied some technological advancements can be illustrated using a price/performance framework. In some instances, the measurement might be more elusive to quantify. In those circumstances, a qualitative assessment is useful in understanding the merits of the technology. Geoffrey Moore has several books including Crossing the Chasm and The Gorilla Game providing a vivid description of approaches to understanding market adoption of technology and tools to evaluate performance. The important point is what enables a company to sustain its position of leadership.
Compelling User Benefits -Zoom (ZM)with easy-to-use video conferencing and Twilio (TWLO) multi-channel marketing communications.
Proprietary Technology – Tesla (TSLA) autonomous driving and Velodyne (VLDR) with LIDAR -light detection and ranging technology. Innovation is the battleground.
Market Position – Apple (AAPL) with consumer perception and Amazon (AMZN) dominate in eCommerce and cloud services. Position is powerful. The positioning of Apple products goes a long way in capturing mindshare and appetite.
Economies of Scale – In terms of reach, production, and users. Microsoft (MSFT) desktop business software Facebook (FB) in global user base and Amazon with its cloud server network can expand services rapidly without significantly increasing costs.
Switching Costs – these costs incur when one standardizes on a particular platform such as Microsoft Windows or Apple OS where the cost changing compatible software applications inhibit your desire to switch. Not everything is cast in stone. Ethernet cabling such as CAT 5 or 6 wiring for computer networking started with high switching costs but WIFI and wireless communication rooted those barriers.
These completive economic and industry lenses provide a roadmap to assess how long a company could maintain its market position giving rise to its Competitive Advantage Timeframe. We would be remiss if Michael Porter’s Competitive Advantage five-forces model was not incorporated into the competitive analysis – substitutes, new entrants, supplier and buyer bargaining power and rivalry among existing players.
Digital Transformation
As more companies begin to address the digital economy and recognize the importance of processes to leverage new technologies and augment business models, analytics and machine learning will take center stage. Two overarching themes and core premise to this analysis of innovative technologies is that as more commerce commences over digital platforms, more energy is consumed and more data is generated. Secondly, a core tenant of this discussion is predicated on acquisitions of innovative technologies by incumbent players to sustain their respective growth and competitive advantage period. Thus valuation of new entrants with innovative technologies depends on equity capital tied to the market capitalizations of large tech companies.
Figure 1 Tech Company Market Capitalization
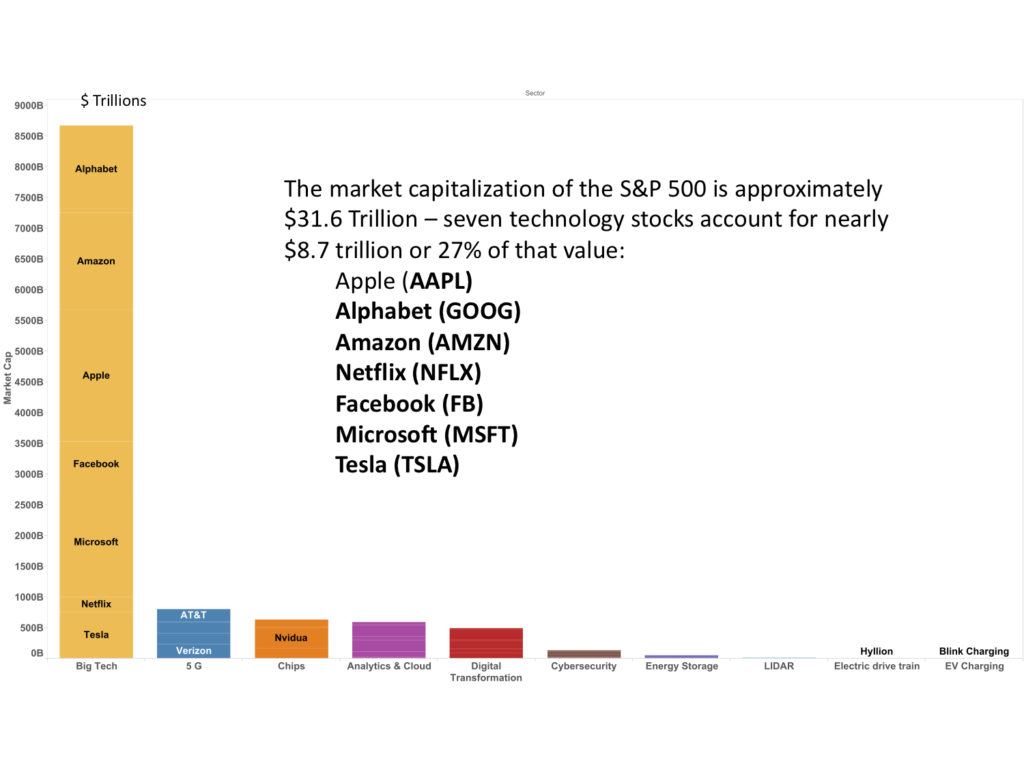
Source: Yahoo Finance, Bloomberg
Seven major technology companies command 27% of the market value of the S&P 500. The market capitalization of Apple, Alphabet, Amazon, Netflix, Facebook, Microsoft and Tesla is over eight trillion in comparison to $31.6 for the entire S&P 500. With large valuations affords the incumbent players to acquire companies with innovative and synergistic technologies and paying up to keep the technology from going into the hands of direct competitors.
Energy Technology Introduction
To set the stage in evaluating the energy sector, let’s begin with the trends evolving in the energy market. The most significant trend is the increase in electric energy consumption. While oil consumption per capita (workforce) trends downward, the electric energy consumption per worker increases even as energy efficient PCs, appliances and LED lighting demonstrate significant progress in lower energy intensity.
Figure 2 Energy Consumption per Worker
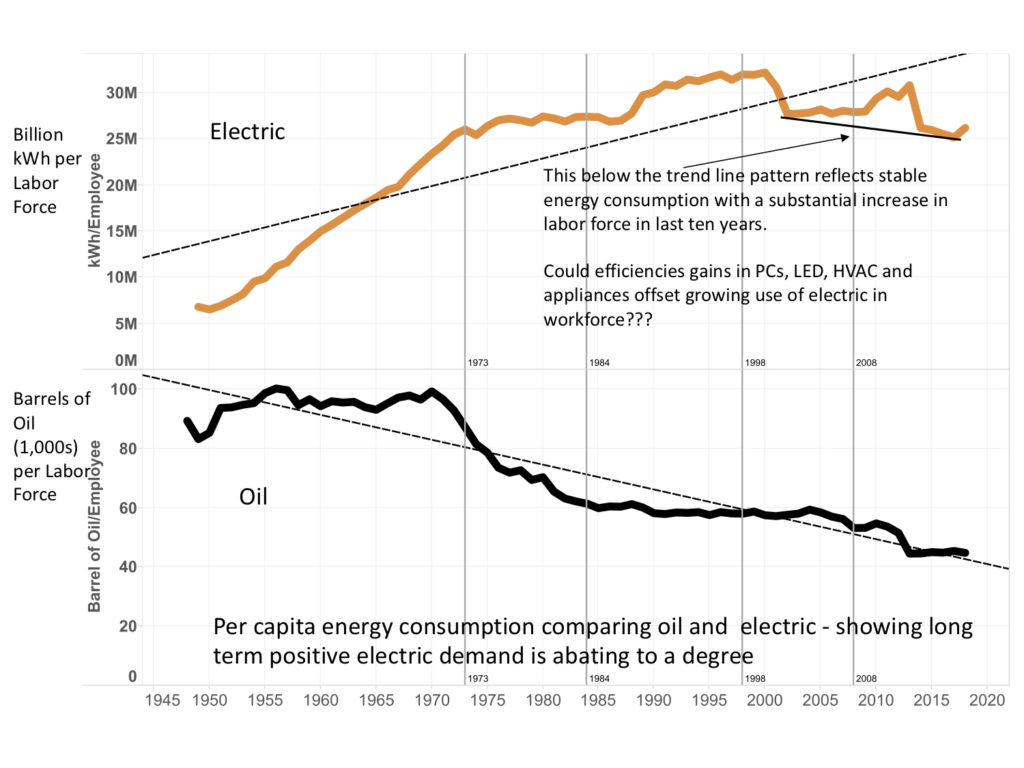
While electric energy efficient appliances and PCs may mitigate the growing demand for electricity, the digital transformation continues to drive demand for electric power. In fact, as we shall see, data centers have the highest energy consumption per square foot of virtually all other buildings. The growth in eCommerce and the digital economy further exacerbates the demand for electric energy.
The electric energy market is complex. From fuel source to electric generation and transmission to renewables such as wind and solar to understanding and managing energy costs to continuity of serve as the utility grid itself. Let’s begin with fuel sources for power. Fossil fuels provide power for transportation, heating our homes and building and the generation of electricity. Growing concern over climate change due to carbon emissions from these fossil fuels has become a global imperative.
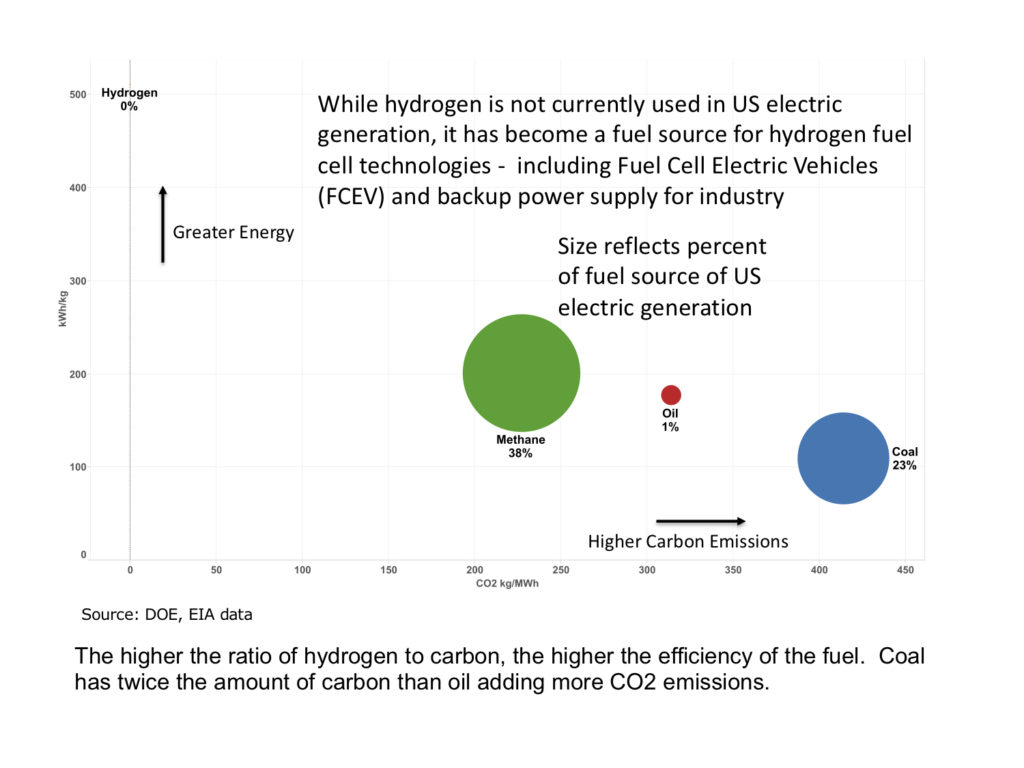
Most of the US electric generation is based on fossil fuels. There is a substantial difference in carbon and greenhouse gas (GHG) emissions depending on fuel source. There has been a consistent trend in the last decade of migrating away from coal and oil fuels to methane which has less GHG and carbon emission. In addition, renewables such as solar and wind continue to increase their share of electric generation. However, the introduction of renewable energy into the utility grid adds another layer of complexity in maintaining grid resilience. The takeaway is that fuels sources with lower carbon to hydrogen ratio offer greater energy efficiency and lower emissions. With investment interest in ESG funds, closer review of energy consumption and composition remain as the most significant in terms of climate and carbon emissions.
Figure 3 Carbon and GHG Emissions for Fuel
The question for ESG investing becomes how do we get closer to net zero carbon emissions. While investment in solar and wind appear an easy decision, there are caveats that require a more technical discussion of the electric grid and in particular, how to improve grid resiliency. The recent disaster in Texas and the familiar blackout in the Northeast in 2003 and the 2019 blackout in New York can prove to be costly in several dimensions.
The Electric Grid
According to S&P Global Market Intelligence, US utility capital investment in grid infrastructure in 2020 was over $140 billion. To provide some color on the electric grid and the impact arising from renewable energy, we need to dive into a couple of technical topics. We need to understand two aspects of the electric grid to appreciate the market potential for energy storage technologies. The first is grid frequency and the other is reactive power. Both of these are critical in maintaining grid resiliency.
Electric power travels from the source generation to the load, the equipment requiring power. While alternating current (AC) is used for electric transmission, the electricity only travels in one direction from the source to the load. Steam and gas turbines produce the rotation for generators to produce power. The rotating motion of the generator is synchronous with a stable rotation speed of 3,600 RPMs to adhere to the 60 hertz (Hz) frequency of the US electric grid. The steady spin of turbines provides inertia that keep the frequency stable. When abrupt changes in energy demand ensue, the increase in demand causes the frequency of the electric power to fall. To stabilize the electric grid, outages are invoked by the utility to stabilize grid frequency. Small changes to grid frequency can cause damage to equipment and grid infrastructure. So, what happens when renewable energy is introduced into the grid?
Matching supply with demand is a complicated task in the utility grid. Renewable energy produces direct current (DC) and therefore needs to be converted and conditioned to interface with the electric grid. Also, there is no inertia with renewables to maintain frequency balance like the generators that spin at 60Hz. Changes in supply and demand can impact grid frequency and can be compounded by the introduction of solar and wind. Devices such as energy storage can ameliorate frequency imbalance. Tesla offers Megapack a utility scale energy storage with compensation for frequency and reactive power control.
Reactive power is rather complex to understand but just as important as frequency. Reactive power is part of the magnetic field that surrounds electric current flow. Without adequate reactive power motors can’t start, voltage drops causing overheating of equipment and grid transmission lines. Real power is the power that is consumed to run equipment and lighting and is measured in kilowatts (kW). Reactive power is the by-product of the phase displacement between current and amp and is measured as kilo-volt-amperes reactive (kVAr). Total or apparent power is the sum of both real and reactive power and measured as kilo-volt-amperes (kVA).
Reactive power is just as important to the grid as it is for the consumer of electricity. Long utility electric transmission lines facing increasing power loads will consume reactive power which can lead to overheating of cables and falling voltage.
Electric current is composed of real power, apparent power and reactive power. Real power is the actual power consumed in the running of equipment while apparent power is the total energy supplied by utility. Reactive power is important because high power equipment requires the magnetic field associated with reactive power to start the motor. If reactive power is NOT used effectively, it can reduce energy efficiency. Essentially, high reactive power can diminish power efficiency and cause harm to equipment.
Also, power factor is important to properly run equipment and motors. Power Factor (PF) is defined as the ratio of real power kW divided by apparent power kVA (kW/kVA). Apparent power is the sum of real and reactive power. To understand the difference between real, reactive and apparent, think of a glass of beer as apparent power, the beer itself as real and the foam on top as reactive power. One buys the beer by the glass and the foam can tell if the beer is flat but too much foam is not what you want.
The importance of PF is that energy efficiency is measured by PF. A PF of 0.95 is considered adequate while PF below 0.80 is poor. Poor PF can result in damage to equipment and motors. Similarly, the utility company could be billing for wasted power when PF falls below 0.85.
Energy storage devices play a key role in stabilizing the grid and protecting equipment when equipped with reactive power compensators as well as inverters with power factor control. This is why energy storage is a critical technology that not only supports the utility grid and renewable energy sources, but also for eclectic vehicles and for power backup for homes and business.
The Utility Grid and the Customer
As a consumer of electric power what can I do to conserve energy and improve the environment? For one energy efficiency can reduce operating costs, provide longer life to equipment, and reduce carbon and GHG emissions. Understanding when, where and how energy is consumed is paramount to improving energy efficiency. Strategies to improve energy efficiency and mitigate risk include energy storage with intelligent control of frequency, voltage and reactive power.
Energy cost for commercial accounts often fall into two main buckets: demand changes and consumption changes. Time of use billing is also important but variations from geographic and grid activity limit generalizations. The difference between peak demand measures in kW is that its defined as the highest 15-minute usage of energy during the month. Consumption billing is the total kWh of usage over the month, in essence, kW times hours of use. During peak season, such as summer cooling months, the kW charge might be larger than the usage charge.
Demand Response is one way of avoiding peak demand charges. Demand response entails curtailing usage to reduce electric demand. One report from Rocky Mountain Institute suggest a four percent reduction in consumption can reduce demand charges by 40%
Managed control of power factor efficiency can extend equipment and motor life, improve energy efficiency, reduce GHG and save money. Sounds great but some utilities regulate the amount of energy storage to the size of the renewable system being introduced into the grid and may limit how the energy storage system is recharged.
Renewables are great but intermittent in their energy production. Therefore, planning and analysis as well as coordination with utility and municipality sometimes limit growth of industry. Perhaps with new initiatives from Washington, a new chapter can begin.
For some vertical markets, continuity of business could be more important than reducing energy costs. The resiliency of backup power comes into play. The point is that while most of the attention around energy storage relates to EVs, a substantial economic imperative and significant cost reductions are possible using intelligent energy storage devices.
Intelligent Energy Storage
The Department of Energy (DOE) lists several energy storage technologies applicable to EVs and grid interface. Commercially available and scalable are Lithium-ion and hydrogen fuel cells. Advances in both technologies have given rise to several companies traded in public markets. Our technology analysis begins with energy storage technologies, specifically fuel cells, most notably PEM and lithium-ion batteries found in everything from cell phones to electric vehicles. One company in particular, QuantumScape provides a roadmap to a solid-state lithium battery offering faster charge time, longer drive duration and less costly battery system.
To recap, energy storage is helpful for the grid specifically in maintaining frequency and reactive power, enables faster deployment of renewable energy such as sol.ar and wind, extends the life of the grid infrastructure and attached equipment, and reduces energy costs for the customer. Energy storage is a crucial component in electric vehicles. So, then perhaps the calculated performance metrics associated with energy storage could help identify what companies offer the most compelling user benefit.
EV Market
The electric vehicle market may emerge as a structural change to electric transmission architecture in extending capacity for EV charging stations while opening a tremendous opportunity for energy storage in EVs. According to the International Energy Agency, the global base vehicles is over 1.2 billion with EVs representing 7.2 million or less than 1% of the market. The global EV market offers a potential $30 trillion market opportunity.
The following represent some performance metrics regarding EVs:
- Vehicle Driving Range
- Charge Time
- Battery Lifetime Cycles (how many charges)
- Specific Energy – Wh/kg
- Costs: Operating and Capital
- Cold Weather Performance
- Safety and Remediation
Figure 4 Battery Energy Storage Timeline
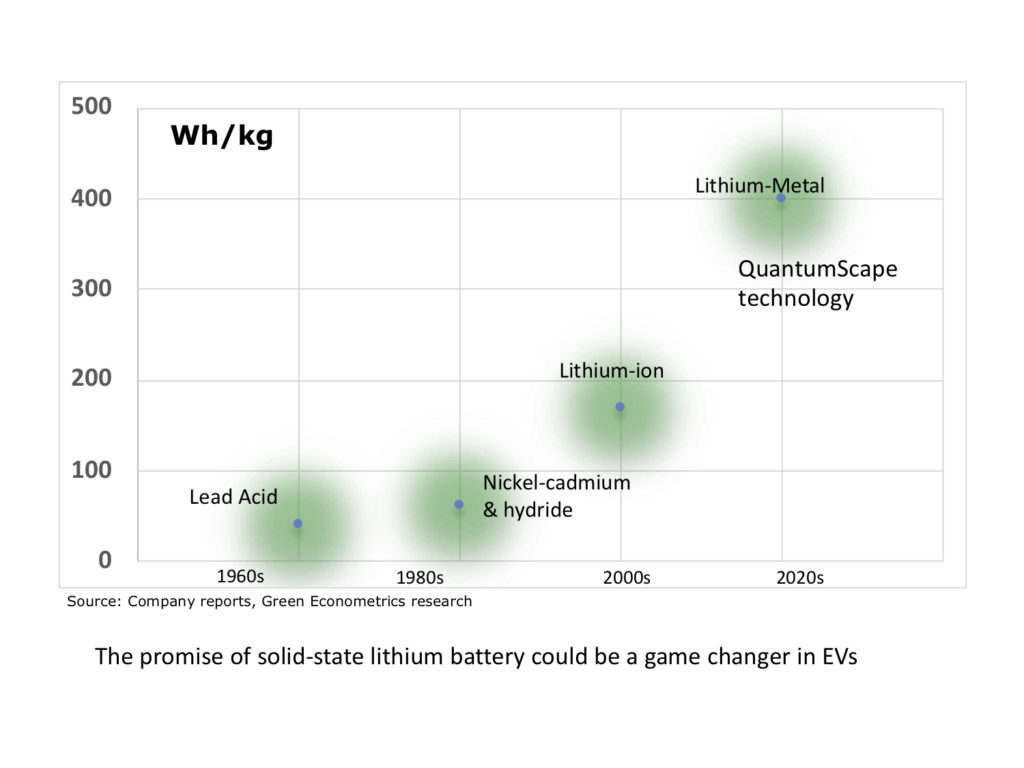
The performance metric is Wh/kg (watt hours per kilogram) essentially duration of power to weight of battery. The improvement in battery technology has only recently seen a significant improvement in performance and subsequently a price/performance metric that offers compelling user value. QuantumScape (QS) with a recent public listing in 2020 could be a potential game changer in battery performance. QS documents indicate battery charging time to reach 80% capacity in 15 minutes versus 40 minutes for commercial lithium-ion batteries.
So why the fascination with EVs and batteries. EVs are the tip of the iceberg. There are 1.2 billion vehicles globally according to Ward’s Auto and 7.2 million EVs. So EVs represent less than 1% of the total vehicle market. At an average EV price of $35K, the market could reach $40 trillion. The lead variable in demonstrating compelling customer value is the energy storage device. The following chart illustrates the EV economics in comparison to an internal combustion engine.
Figure 5 EV Disruptive Energy Economics
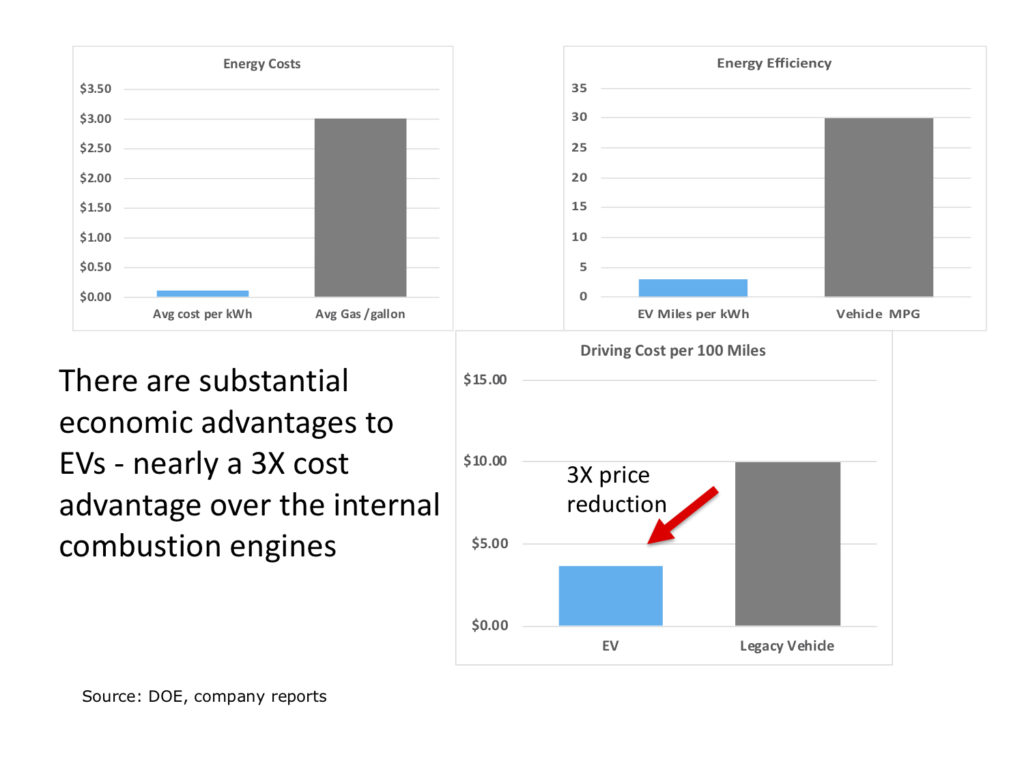
With electric rates at an industry average of $0.11 per kWh and the price of gasoline at $3.00 per gallon, even with fuel efficiency of 30 MPG, the EV at 3 miles per kWh, the cost of driving 100 miles is three times lower for EVs. In other words, it costs $10.00 to drive a car 100 miles and less than $4.00 in an EV.
Energy storage requires scale. What other approach can deliver duration, cost effectiveness, and scale? Fuel cells might be the answer. Fuel cell technology has been around for a long time but only recently have the economics been able to achieve commercial viability. We have analyzed four public fuel cell companies that offer solutions for EV, emergency backup and smart grid applications.
Figure 6 EV Driving Range to Weight BEV and FCEV
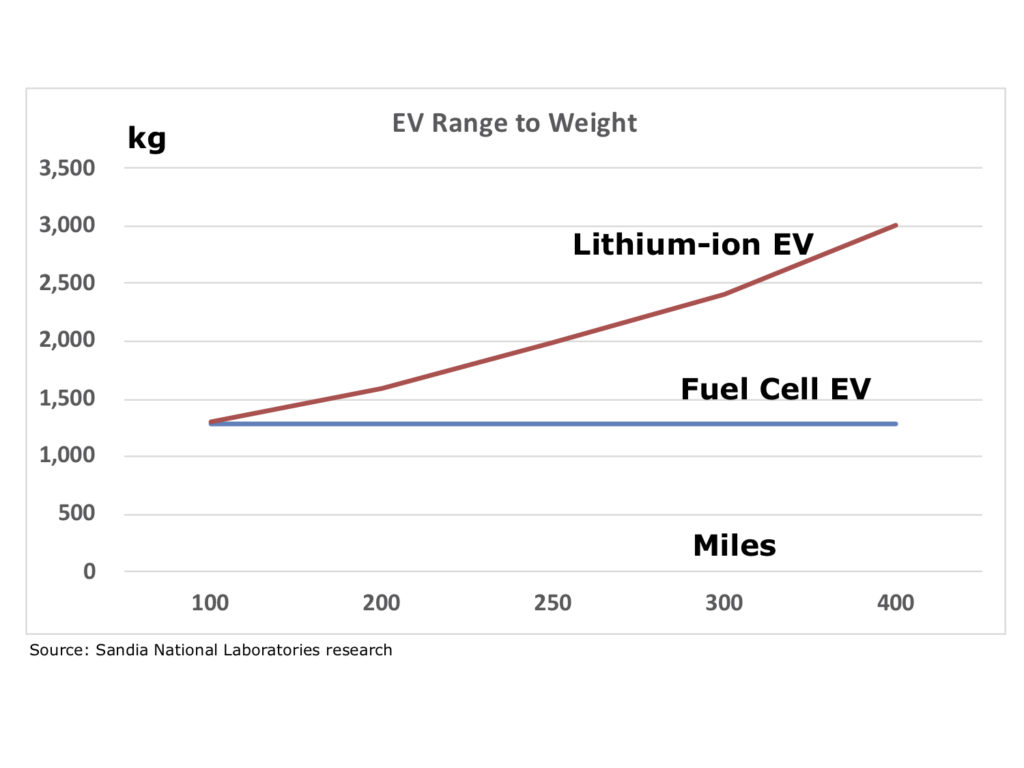
As seen in Figure 6 fuel cell energy storage technologies appear to offer extended driving range in comparison to lithium-ion batteries without adding additional weight to the vehicle. So how does QuantumScape’s solid-state lithium battery compare to FCEV approaches?
Figure 7 Fuel Cells vs Battery Specific Energy
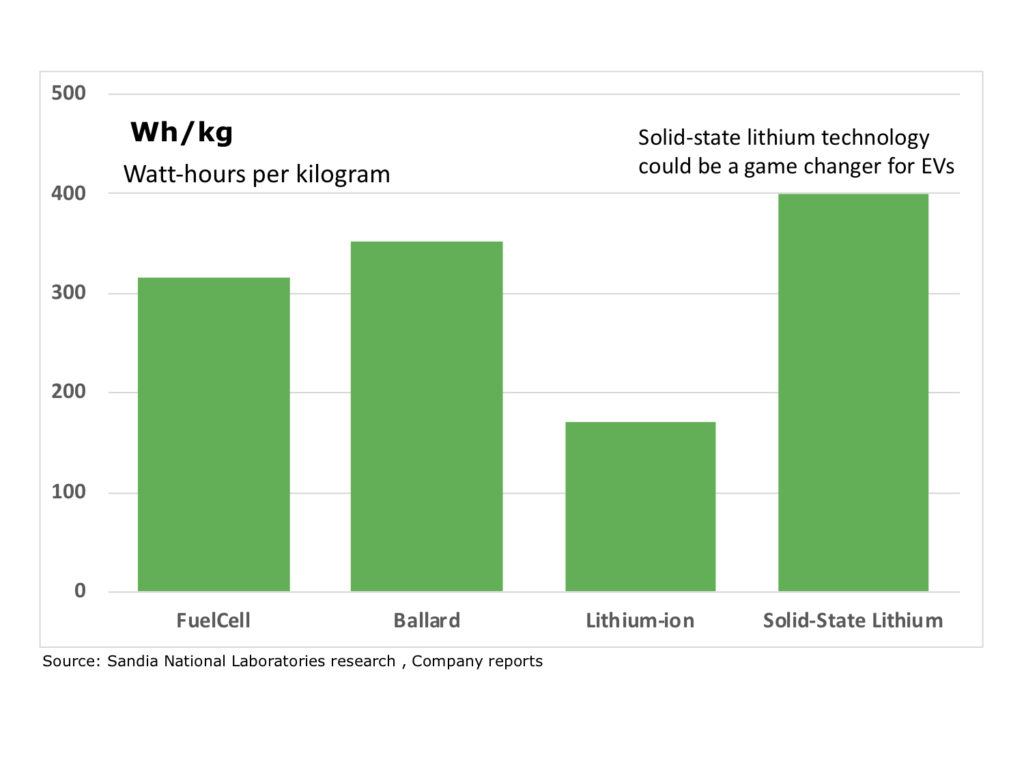
QuantumScape may indeed have a game changing battery but the underlying thesis is that as more EV take to the roads, our electric grid will need to expand to accommodate greater electric demand. According to the US Department of Transportation there are 268 million cars and light trucks in the US with an average annual travel per vehicle of 13,000 miles. The US electric demand is approximately 4 trillion kWh per year. So 129 million EV traveling 13,000 per year at 3 kWh per mile amounts to roughly 580 billion kWh per year. If half of the US vehicles were EVs in the next ten years grid capacity would need to increase 20%.
Energy Storage
Bottom line is that energy storage is an extremely important technology to address energy efficiency, carbon emissions and the environment, grid resiliency, EV and substantial benefits for energy markets industrial, commercial, public, and households, from cost reduction, business continuity and equipment protection. What’s more is that energy storage is rather sticky. Switching costs for energy storage are elevated. Yet there are still questions regarding remediation and removal and certainly developments on the horizon with innovative technologies and approaches to energy storage.
There are caveats with batteries because of the mining of metals for production. These metals include lithium, graphite, cobalt and nickel. Tesla’s Powerwall cathode section consists of cobalt, nickel and manganese.
Energy storage players:
Plug Power Ballard FuelCell Bloom Energy QuantumScape
PLUG BLDP FCEL BE QS
Figure 8 Energy Storage Financial Overview
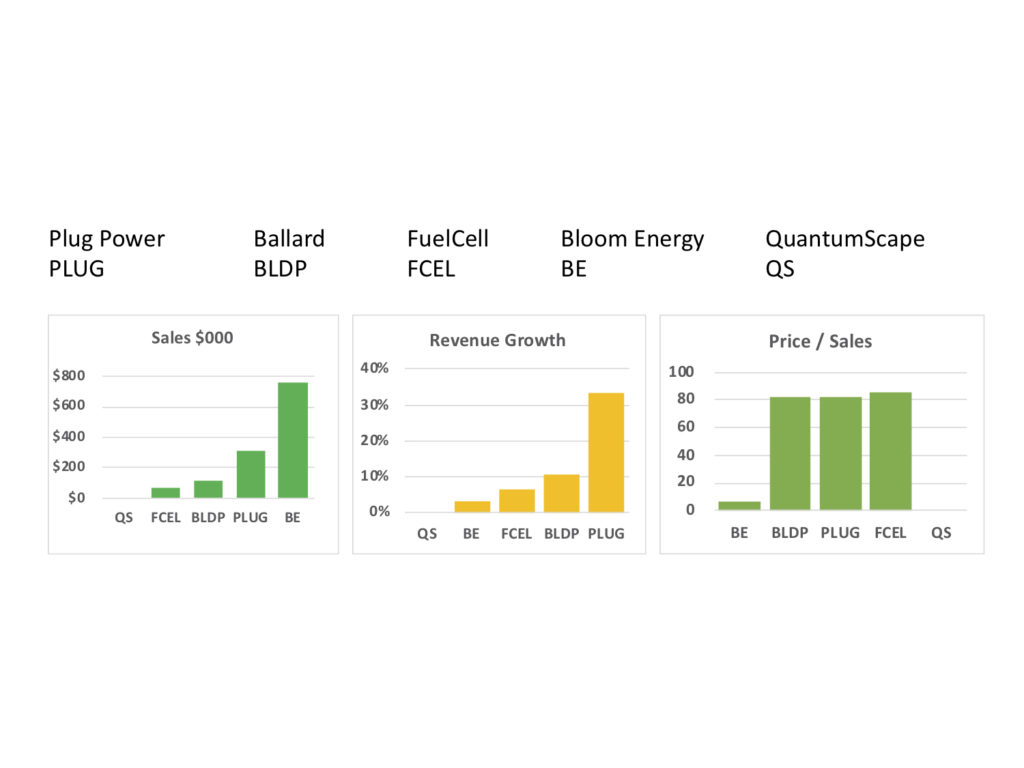
Figure 9 Lithium Production and Resources by Country
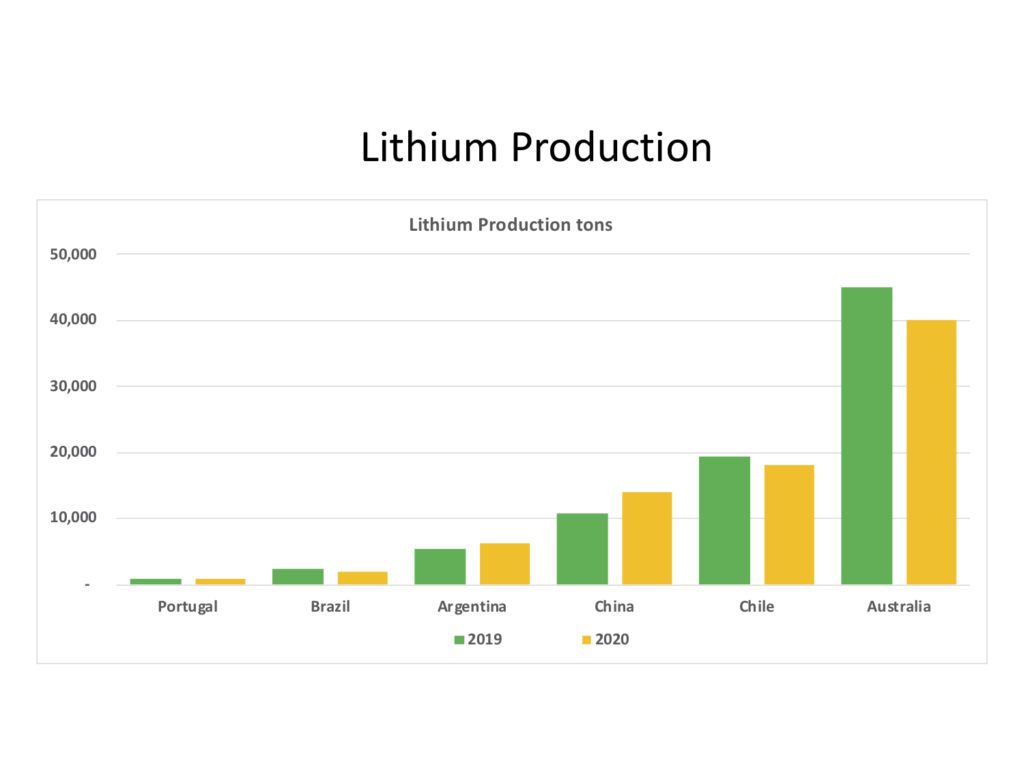
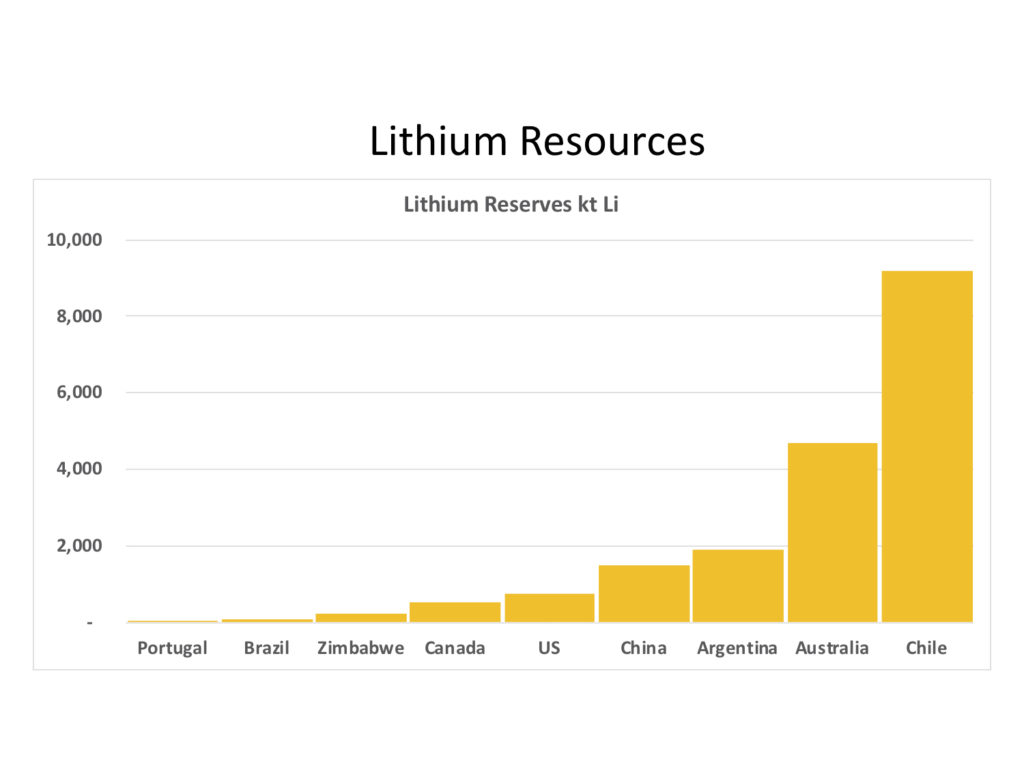
Lithium product in the US was relegated to an operation in Nevada to extract lithium from brine solution according to the US Geological Survey. In terms of resources, Chile, and Australia are the large players followed by Argentina, China and the US.
Financial Analysis Framework
Figure 1 Return on Invested Capital to Invested Capital
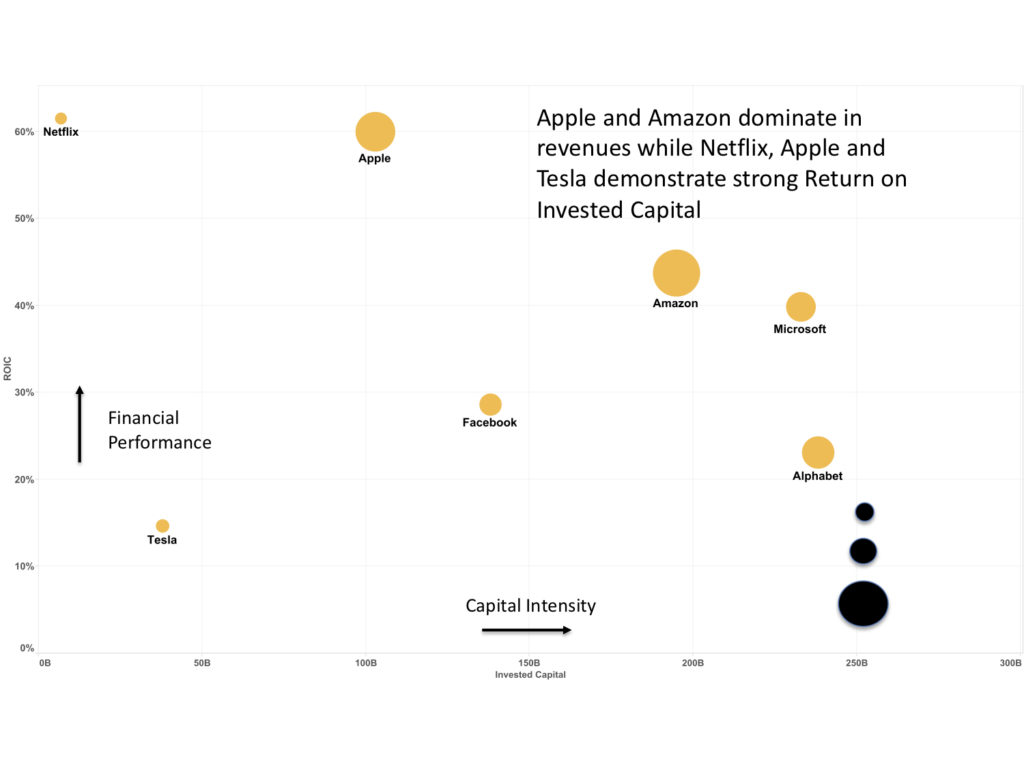
Theses seven companies account for 27% of the value of the S&P 500 with over $8 trillion in market value. The chart tracks ROIC to capital deployed and the size of the circle corresponds to the size of LTM revenues.
Figure 2 Price to Sales to Revenue Growth
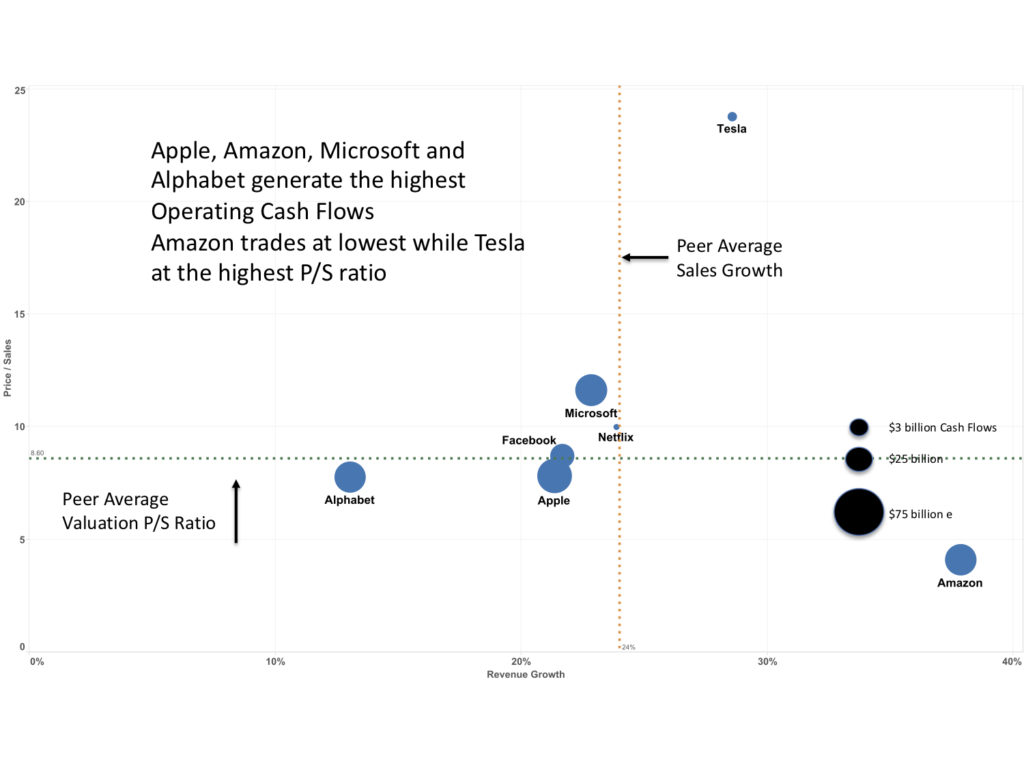
This chart depicts market valuation measured by price to sales and year over year revenue growth. The size of the circle reflects their associated operating cash flows.
Figure 3 Sector Focus ROIC to Invested Capital
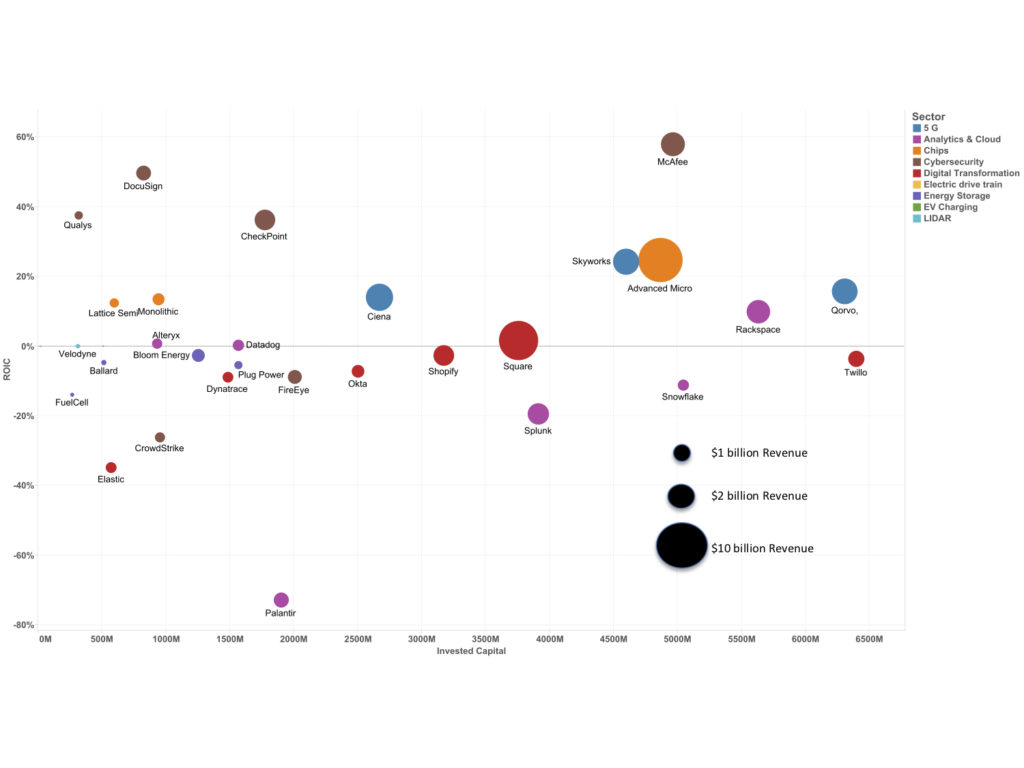
With negative earnings and cash flows for a significant portion of the technology companies, new metrics and ratios are used to evaluate potential upside.
Figure 4 Sector Focus P/S to Revenue Growth
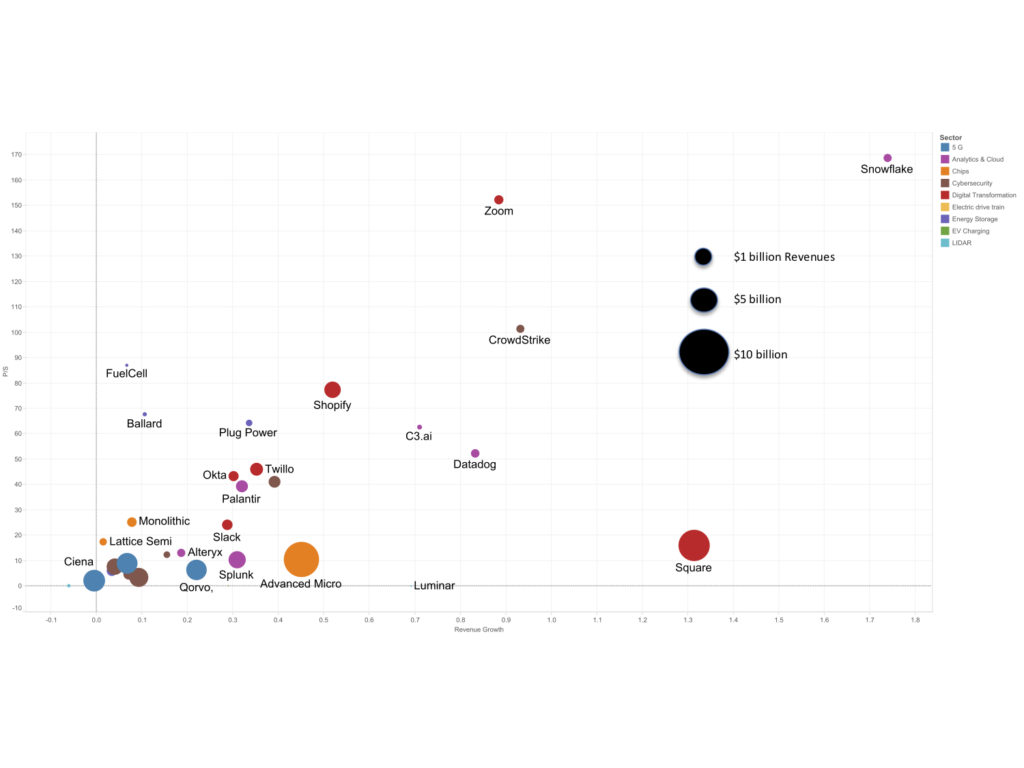
With negative earnings and cash flows for a significant portion of the technology companies’ new metrics and ratios are used to evaluate potential upside.
Related Posts