Category Behavioral Analytics

Green Econometrics: Important Trends To Watch In 2021

Digital Transformation Becomes The Top Priority

by Charlie McHenry, COO, Co-Founder

The pandemic, and to a lesser extent, global climate change are accelerating digital transformation in business, industry, agencies and non-governmental organizations. This transformation is also a transition – to a new way of doing business on all levels; to a new way of looking at the impact and footprint of our business and personal activities; and to a new normal, that is not likely to look a lot like what we’re used to. This coming year will see a number of existing trends accelerate, and new developments which will underlie and drive major changes in business and operational models. 

This report will look at a number of industry sectors, as well as the impact of digital transformation on the public sector. In depth reports on each of these sectors are available by yearly subscription for $950 by request. 

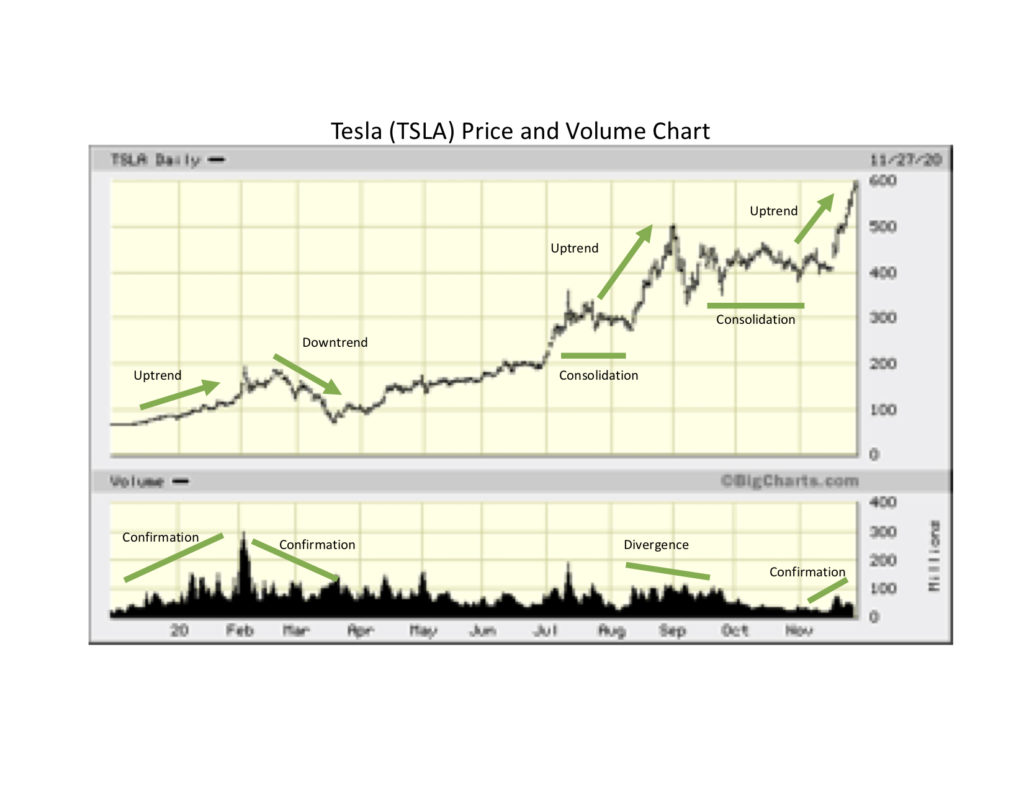
We have to start somewhere, so let’s take a look at the rather dramatic and emblematic transformation now taking place in the automobile/truck manufacturing sector. 

Read More

Why Visual Data Analytics: Discovery, Innovation and Opportunities

A data analytics framework is applicable to insight discovery; provides a roadmap towards innovation; and enables capabilities that can optimize approaches to new business models and opportunities. The following paper provides examples revealing how and why to apply visual analytics for discovery, innovation and evaluating new opportunities. 

Discover how waveforms and patterns are applied to science and finance, and how customer usage patterns can reveal new approaches to market micro-segmentation and persona classifications.  Lastly we’ll reveal how the deployment of IoT devices across the enterprise fuels data flow in the physical world regarding the performance and conditions of business assets.

Introduction

Our theme is applying visual data analytics as a tool for discovery, innovation and evaluating market opportunities. We show how two metrics, price and volume, are able to convey insight and establish price targets for technical analysis. Why energy consumption patterns and waveforms lend themselves to understanding science and classifying human behavior.  How proxy metrics can serve as measures for physical events. Why linking granular visibility into processes and the monitoring of conditions and operating performance help build an advantage in the digital economy.  

Green Econometrics relies on visual analytics as a core fabric in our data analytics frameworks because visual analytics are integral to discovery, innovation and new opportunity development. Visual insights are easy to understand – allowing business objective and performance metrics to seamlessly transfer across business units. So how do we do it?

Read More