Why Analytics and Business Intelligence
Analytics and Business Intelligence provide a framework for process improvement that drives operating efficiencies and enhances business value. Most business owners and managers want to increase business value to benefit shareholders, stakeholders, and investors. Individual investors and investment professionals direct capital towards companies that can demonstrate sustainable value. Changes to performance in revenues, margins, and risks can become a catalyst to invest or divest. Business value is often measured by three performance criteria – revenues, operating margins, and risks. Therefore, factors that contribute to revenue growth, margin expansion, and risk mitigation become the overarching goals to improve business value. We add that sustainable value includes resource conservation and efficiency.
Just how does analytics and business intelligence address revenues, costs, and risks in improving business value? To understand the integration of analytics and business intelligence in improving business value, let’s look at two initiatives in formulating business strategy.
In his book Measure What Matters, John Doer describes how establishing goals and objectives along with the corresponding performance criteria provide a better method to assure that key metrics are aligned to goals and business objectives. This process of mapping performance metrics to business objectives defined as Objectives and Key Results (OKRs) determine what is relevant to measure and track. Adding to OKRs is the balanced scorecard approach which pulls reporting data from each business unit and department and explained by Robert Kaplan and David Norton in their Harvard Business Review article “Using the Balanced Scorecard as a Strategic Management System” to provide an assessment of conditions and performance.
OKRs and Balanced Scorecard
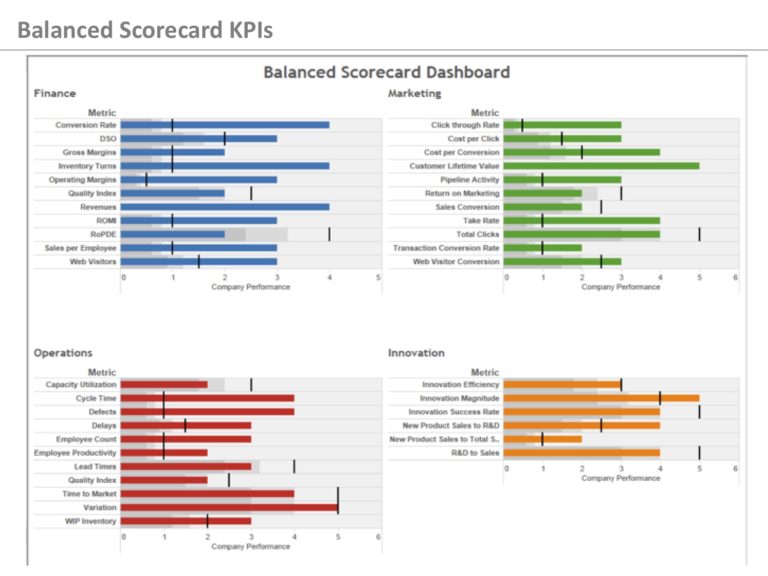
The balanced scorecard consolidates data from marketing, sales, operations, finance, and engineering and other activities to evaluate performance. Performance metrics are arranged into a dashboard to provide fast visual insight into conditions and achievement of goals. Silos of data residing in different departments must be curated for secure and agile access under a single pane of glass. This aggregation of OKR metrics into a visual report card provides clarity and visibility into business activities that create business value. Today with modular analytics and cost-effective secure cloud architecture, all companies can take advantage of data-driven strategies.
Figure 1 Balanced Scorecard
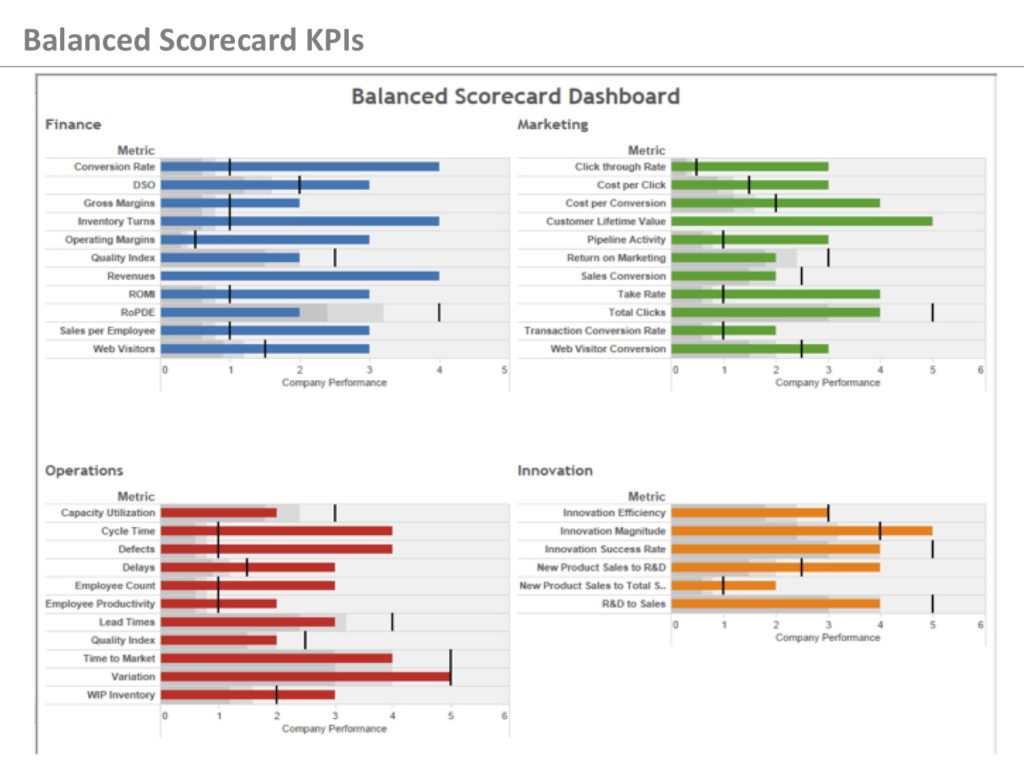
To zero in on performance metrics, those metrics that benchmark performance and operating conditions aligned with business objectives are the most relevant. They also help determine what OKRs should be included in a balanced scorecard. Clearly those metrics that directly enhance business value are relevant, in addition, proxy measures and coincident identifications of inflection points that may change the competitive landscape are also important. The idea is to develop a roadmap to link relevant performance metrics to business strategy and tactics. The process and methods of identifying and measuring performance metrics relevant to improving business value, engenders a culture that values the process itself as a competitive advantage.
Revenue Growth
The use of metrics tied to revenue growth is somewhat obvious, but analytics plays a crucial role to evaluate performance from such activities as digital marketing, call center customer engagement, purchasing propensity and behavioral modeling to channel development, positioning, price elasticity, product attributes, and advertising effectiveness. From simple A/B testing to Google Analytics and SEMrush keyword analysis to behavioral signature and anomaly detection. Perhaps more importantly, analytics can be used to measure and test product innovation, market segment initiatives and new business models that may offer an option on future business growth.
Margin Expansion
While a fast way to improve margins is to cut costs, but what if those cost cuts negatively impact revenue growth because product quality or functionality declines? Is it better to provide higher value and charge a higher price or cut costs? To assess margin expansion questions, accurate and timely customer and financial data is required. To explore unknowns an integrated analytics and business intelligence platform with feedback loops can deliver insight to optimize business value with a prescribed level of confidence.
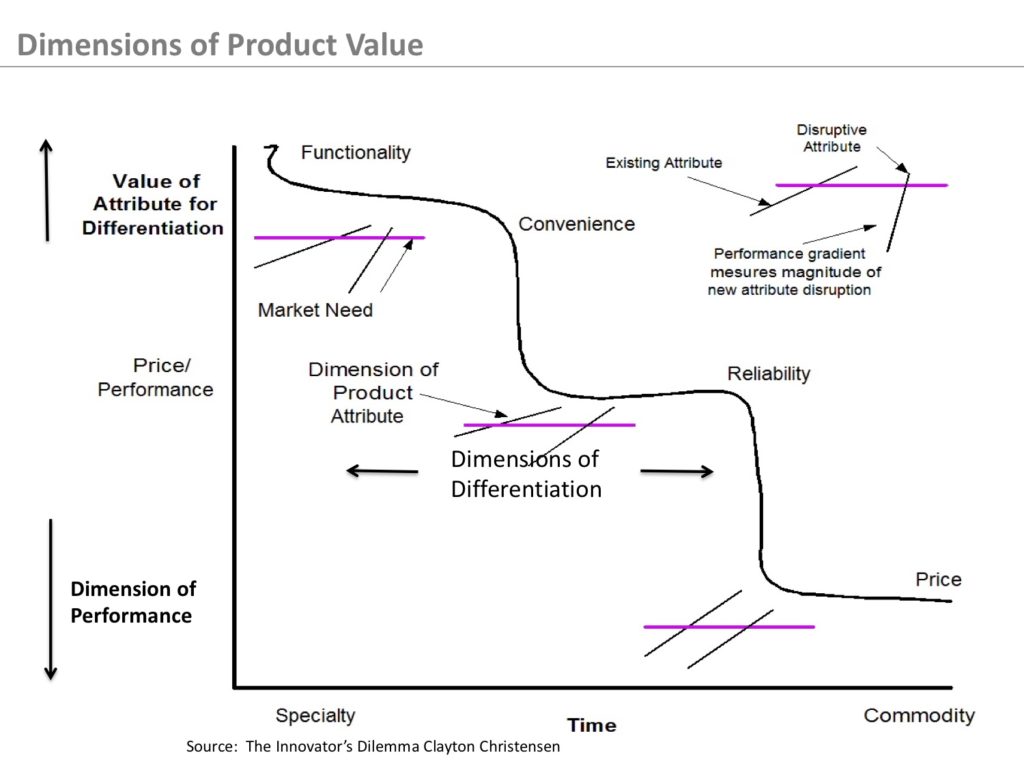
Reporting and analytics in a data-driven platform enables insight and the ability to drill down into business processes thereby linking performance metrics to busines objectives. One of the most important concepts in value creation can be found in the book The Innovator’s Dilemma by Clayton Christensen which examines the dimensions of product value and what product attributes are most important in delivering value to the consumer. Understanding product attribute value in conjunction with pricing, demand elasticity, and purchasing propensity provide a strategy to expand operating margins and increase business value.
Figure 2 Dimension of Product value
Risk Mitigation
One of the largest investment themes is Environmental and Social Governance (ESG), where environmental focus is the paradigm and within the environmental segment and energy plays the leading role. In fact, energy, climate and resource utilization are key in managing risk. Climate change has become a major risk factor for investors. Resource utilization and efficiency have become crucial quantifiable metrics for ESG investing. In fact, energy efficiency is directly tied to greenhouse gas emissions where the ratio of carbon to hydrogen in the fuel composition can be calculated to derive CO2 emissions.
Energy efficiency is quantifiable with a measurable ROI. Leading organizations such as the CFA Institute with emphasis on ESG investing and the Efficiency Valuation Organization sponsors the International Performance Measurement and Verification Protocol (IPMVP) that provides a framework to construct an energy consumption baseline and to quantify energy savings where sampling procedures may be employed to create insight into energy usage patterns.
Our focus at Green Econometrics is research, consulting and the application of analytics and technologies that address operating efficiencies and resource utilization. Using statistical models, measurement tools and device monitoring, quantifiable productivity measures, energy savings and carbon offset can be ascertained within desirable confidence levels. Evan small sample sizes can help reduce uncertainty with a defined level of confidence.
Summary
The analytics and business intelligence framework provide a recipe to drive business value as well as a construct to navigate uncertainty. Monitoring, measuring and analyzing key metrics provide the tools and at what level of confidence, to benchmark performance around metrics directly aligned to business objectives. The implementation of our framework is cost effective, agile, scalable, and secure as well as providing business value enhancements and the ability better navigate uncertainty.
Related Posts