The Possible Achilles’ Heel of EVs and Energy Storage

  • Battery technology is progressing slowly and advances in lithium-metal are not yet commercially available
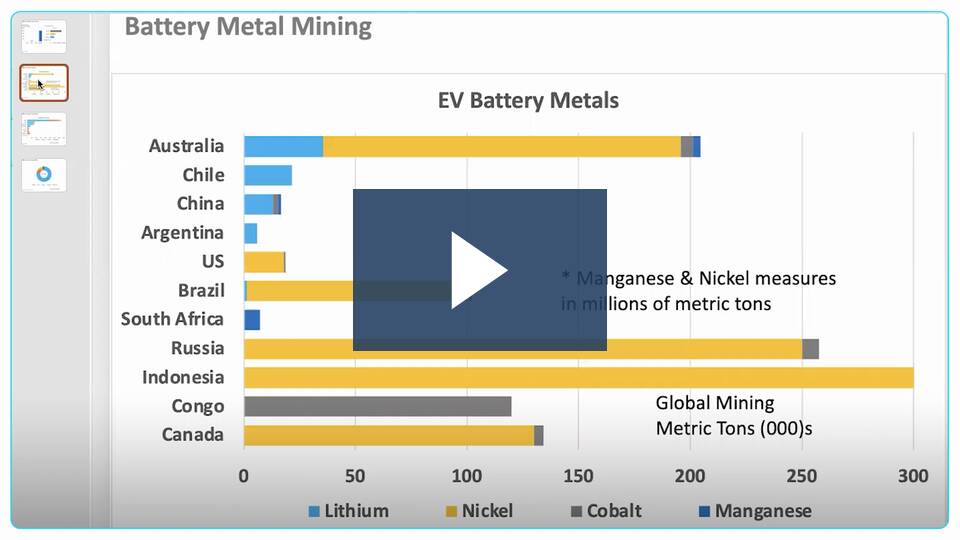
  • Federal EV battery incentives pertain to countries with US free trade agreements: Australia, Canada, and Chile
  • Battery supply is constrained by metal mining and production is limited by complex and costly process technologies
  • More research and product production methods are imminently needed

Battery production for electric vehicles should be a concern. For one, the US has neither the resources nor the production capacity to meet the demand of EV manufacturers. Second, as a national security concern, not having the requisite production infrastructure to support energy transformation leaves the US vulnerable to economic decline and energy price increases. Third, to navigate energy transformation it’s imperative to establish battery production for grid stability and resiliency, particularly when introducing renewable energies.

Currently, lithium-ion batteries are the core foundation for EVs and most vehicle manufacturers are planning to transition to all elective vehicles in the near future. California might ban the sale of new cars running only on gasoline by 2035. The issue is the production of EVs is inextricably linked to the availability of batteries that are limited by supply constraints in both battery metals and production capacity. Our focus is on battery supply chains and production.

Battery Supply Chains

The big issue around EV batteries is assuring an adequate supply of materials at a reasonable price.  To better understand the EV supply chain let’s look at the common raw materials namely metals and their associated costs. The four primary metals in a lithium-ion battery commonly used in most EVs are lithium, nickel, cobalt, and manganese. EV batteries use nickel-manganese-cobalt cathodes, with 60% nickel and 20% of cobalt and manganese.

The Possible Achilles’ Heel of EVs and Energy Storage – MarketScale

Energy Transformation Why EVs will Impact the Utility Grid

Energy Transformation: Why EVs will Impact the Utility Grid – MarketScale

With the bipartisan National Electric Vehicle Infrastructure (NEVI) funding fast approaching, what are the implications on energy demand and the utility grid and why is EV charging compounding the complexities of grid transmission and distribution?

Currently EVs account for about 1% of the global vehicle market and according to EV Adoption, there are approximately 2 million EV on the road in the US. According to the Department of Transportation’s Federal Highway Administration, the average vehicle travels approximately 13,500 miles annually and EV efficiency is roughly 3.5 miles per kWh suggesting annual energy consumption of 3,870 kWh. According to the DOE Energy Information Administration, the average US home consumes roughly 10,900 kWh a year. Therefore, an EV would potentially account for the 35% of the average US home’s electric usage.  Most homes can be equipped with a Level 2 EV chargers (240 volts / 50 amps) mitigating any grid impact

EV Charging Grid Impact

Read More

Are Electric Vehicles Worth the Investment?

MarketScale podcast

https://marketscale.com/industries/transportation/are-electric-vehicles-worth-the-investment/

EV Economics

So, what does this EV energy transformation mean to consumers?  Let’s look at a few key factors in evaluating EVs:  economics, driving range, charging time and charging network. For one, it is the understanding of EV economics such as the difference between MPG to miles per kilowatt hour (kWh). Essentially, how far can you drive with a gallon of gas to kWh of energy. According the EPA, the average vehicle fuel efficiency in 2020 was 25.7 MPG. The U.S. Department of Transportation’s Federal Highway Administration states the average person drives around 13,500 milesevery year suggesting an annual fuel cost of over $2,300 at $4.50 per gallon.

The average EV range is approximately 3.5 miles per kWh. One way to assess the economics between MPG and kWh efficiency is to compare the driving costs of traveling 100 miles. With the average fuel cost of $4.50 in the US and 25.7 MPG equates to $17.50.  With an EV achieving 3.5 miles per kWh, the 100-mile traveling cost will depend on whether the EV was charged at home or on a charging network station. According to the Energy Information Administration, the average at home cost is roughly $0.14 per kWh. So, the 100-mile EV travel cost equates to $3.91.

However, if the EV requires charging on a public charging network, the cost is significantly higher. The average kWh cost on public charging networks is approximately $0.42 per kWh ranging from $0.25 from Tesla to $0.33-to-$0.60 on other charging networks. At $0.42 per kWh, the 100-miles travel would cost $12.00 in an EV which is still a 30% savings over conventional vehicles.

Figure 1: 100-Mile Driving Costs

Source: EPA, EIA, Green Econometrics

Read More

Why EVs, Digital Transformation and Crypto will Impact Utility Grid

The US utility grid, comprised of electric generation, transmission (high voltage long distance transport) and distribution (last mile connection to end user) consumes approximately 3.8 trillion kilowatt hours (kWh) with 1.28 trillion kWh in commercial use or roughly 34% of the grid.

In 2021, Electric Vehicles (EV) represented approximately 3% of the registered vehicles in the US. The U.S. Department of Transportation’s Federal Highway Administration states the average person drives around 13,500 miles every year. The average electric car consumes 34.5 kWh per 100 miles. This works out as 0.346 kWh per mile. https://ecocostsavings.com/electric-car-cost-per-mile/ That amounts to 36 billion kWh or 1% of the electric grid.

Vehicle manufacturers are projecting substantial migration to EVs which will increase the impact on the grid. When EVs account for 25% of total vehicles, an additional 7% of grid capacity will be required. 

The required grid buildout will be complicated further by the adding huge numbers of physical EV charging locations. The Federal Government has just allotted $5 billion to assist states that have aggressive charging station construction plans. Bottom line: the EV transformation will have a trillion-dollar impact on the economy — driven by the 30%-to-60%  energy efficiency gain of EVs over internal combustion engines.

Currently, there are over 160,000 fueling locations around the country such as gas stations and convenience stores. EV charging units, not individual locations, just a power connector, are estimated to be at around 36,000. What is important to note is that the majority of these legacy EV charging systems are Level 1 and Level 2 type requiring charge times of an hour to go 100 miles. These legacy EV charging systems are not conducive for vehicle commuting behavior. Who can wait an hour to charge their vehicle?

The trend is for next generation fast charge (FC) and extreme fast charge (EFC) EV charging systems that are capable of extending range and providing faster charge times more indicative of the average gas refueling time.  The limitation is that the number of FC and EFC charging locations is minute. Tesla operates over 20,000 Supercharger connections globally but only 908 physical US locations

The bottom line is that the buildout to support fast charging EVs will require extensive capital investment and generation capacity that is further complicated by managing distributed energy resources such as DC power conversion, energy storage and renewable energy.

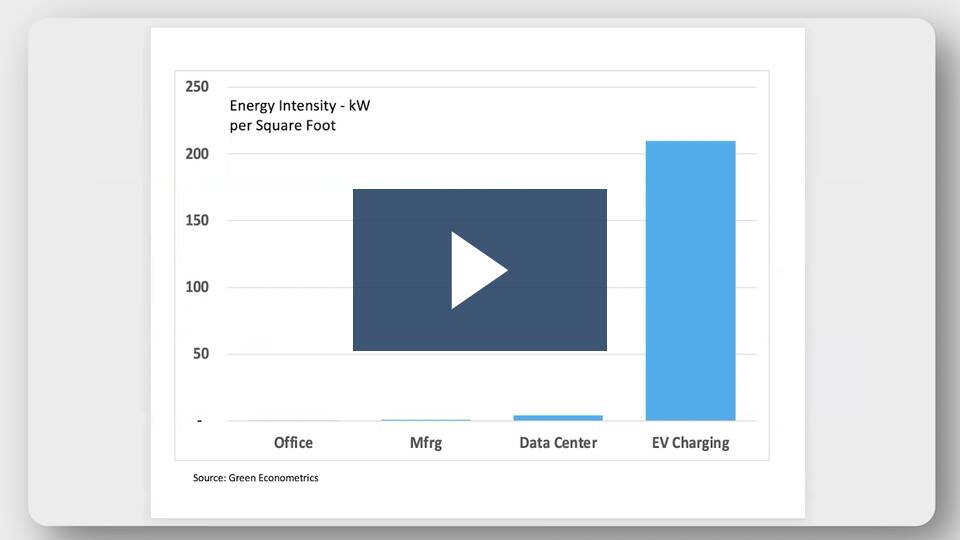
While EVs are changing the utility landscape, digital transformation – where greater reliance is required by expanding data centers that consume substantially more energy than manufacturing facilities – is consuming energy at an even faster rate.  The economics of cloud computing, machine learning, AI chips, and analytics-driven business models are only accelerating this digital transformation and dependence on data centers. When one adds crypto currency mining to the mix, the utility grid will predictably undergo substantial change.  At current growth projections, Green Econometrics forecasts that EVs, data centers and crypto mining will require an additional 11% energy generation and grid capacity by 2027.

Cloud Analytics Disruptive Innovation

Why Cloud Computing and Data Analytics Enable Digital Transformation

From the inception of the Industrial Revolution several core ingredients enabled the transformation and growth of industry.  Among these core building blocks of the Industrial Revolution namely: access to risk capital, visionary entrepreneurs, available labor, technology, resources and energy.  Technology and energy play a crucial role in not only growing industry but enable scale.   Technology can open new markets and provide advantage through product differentiation and economies of scale.  Energy is literally the fuel that scales operations.

Today technology, built from knowledge and data, is how companies compete. Energy now emerges as even more integral in scaling operations. Just as James Watt developed the first steam powered engine in 1606 commencing the Industrial Revolution, it was the access to available coal with the use of the steam powered pump, invented by Thomas Savery in 1698, that allowed greater access to coal that gave scale to industry.

Most recently, the pending transaction of Salesforce’s (CRM) acquisition of Slack (WORK) after acquiring Tableau last year serves as a reference in valuing the importance of technology is to sustaining market value.  The market value of seven companies accounts for 27% of the approximately $31.6 trillion for the S&P 500.  Evaluating the industry and market impact of innovative technologies can be viewed through the lens of stock valuations, particularly as it applies to mergers and acquisitions.  This article reviews the companies and the technologies from the perspective of market sales opportunity and the economic impact of the technologies based on the price/performance disruption to the industry.

So why are we focusing on energy and data today?  Energy, predominantly hydrocarbon fuels such as oil, natural gas and even coal is how people heat their homes and buildings, facilitate transportation, and generate electricity to run lights, computers, machines and equipment. In addition, there is substantial investment focus on the digital economy, Environmental and Social Governance (ESG), and innovative technologies. A common thread among these themes is energy and data.

Data and Energy are the pillars of the digital economy. Energy efficiency can reduce carbon emissions, thereby improve ESG sustainability initiatives. Innovative technologies around energy and data are opening new markets and processes from formulating new business models to structuring and operating businesses.

The climate imperative and investing in energy infrastructure and environmental ESGs are predicted on energy efficiency and relevant performance metrics to evaluate investment allocation decisions. Therefore, our initial emphasis begins with a background on energy consumption with focus on electric consumption trends, carbon footprint, Green House Gas (GHG) emissions, sustainability, electric grid resilience, and technologies that impact energy including Electric Vehicles (EV), energy storage, and Autonomous Driving (AD).  Data technologies encompass cloud architecture, Software as a Service (SaaS), Machine Learning (ML) analytics, and the importance of data as the digital transformation gives rise to the digital economy. 

Digital Economy Performance Metrics

Before we dive into the financial and competitive analysis, let’s review business models that are disruptive to the status quo. That is are innovative technologies capable of rapid scale and efficiency gains that change the economics of the market and business profitability.  In addition, disruptive events, driven primarily by technology, often appear as waves as the adoption of innovative technologies expands through the market.

Read More

Mega Trends Thematic Research and Analysis

As digital transformation grows, underlying technology platforms become a core differentiator for key players. Our research reveals that current market leaders need to identify and embrace important new technologies now and adapt to the continuous emergence of new innovative platforms — often through M&A activities. In our full report, we take a look at significant technology disrupters and identify key players to watch.

Two overarching themes, data and energy, inform our approach; and our core premise that drives our innovative technology analysis is that as more commerce commences over digital platforms, more energy is consumed and more data is generated. This lens enables us to identify important emerging trends as well as obstacles to progress; while sorting out the technologies and firms most likely to emerge as winners going forward.

Importantly, our ongoing research reveals that there is also a confluence of interactivity between classes of technology that results in cross dependencies, correlation, cross pollination and scale that creates nuances within each segment. It is our implementation of data collection and analysis between segments, comprehensively addressed in our full report, which adds the insight required for confident decision making. Order your copy now.

In our full report, we identify some of the sectoral trends fueling the new digital economy and the innovative technology companies creating value in our research. Let’s break it down by sector:

 Energy Storage – is the key differentiator for electric vehicles (EVs) and the end-to-end mobility solutions of the future. It also plays a vital role in energy efficiency and resiliency. Energy storage is a core technology to address energy efficiency; critical to controlling carbon emissions, grid resiliency, and providing EV charging solutions. Energy storage systems have substantial benefits for energy consumers, including: industrial, commercial, public, and households. From cost reduction to business continuity and equipment protection, proper energy management delivers significant business efficiencies. There are, however, associated high switching costs for energy storage to be considered. Our focus in our full, in-depth report includes thorough analyses of Plug Power (PLUG), Ballard (BLDP), FuelCell (FCEL), Bloom Energy (BE) and QuantumScape (QS)

Cloud Architecture – another key sector we examine, provides a very cost-effective means of providing separate layers of data storage, computing and transactional services to enterprises and agencies where reliability, scalability and availability are critical to performance and the maintenance of a competitive edge. Virtualization services enable separation of hardware and software as well as method for separating data from control planes. Innovative tools including Databricks and recent IPO Snowflake provide scale and data integration to manage cloud services and data analytics. Our focus in this niche includes Alteryx (AYX), Datadog (DDOG) Palantir (PLTR) Splunk (SPLK) C3.ai (AI) and Snowflake (SNOW).

Read More

Green Econometrics: Important Trends To Watch In 2021

Digital Transformation Becomes The Top Priority

by Charlie McHenry, COO, Co-Founder

The pandemic, and to a lesser extent, global climate change are accelerating digital transformation in business, industry, agencies and non-governmental organizations. This transformation is also a transition – to a new way of doing business on all levels; to a new way of looking at the impact and footprint of our business and personal activities; and to a new normal, that is not likely to look a lot like what we’re used to. This coming year will see a number of existing trends accelerate, and new developments which will underlie and drive major changes in business and operational models. 

This report will look at a number of industry sectors, as well as the impact of digital transformation on the public sector. In depth reports on each of these sectors are available by yearly subscription for $950 by request. 

We have to start somewhere, so let’s take a look at the rather dramatic and emblematic transformation now taking place in the automobile/truck manufacturing sector. 

Read More

Why Data Analytics Process Blueprints Mitigate Productivity J-Curve and Create Value

Analytics platforms transform technology adoption

Engendering a data analytics framework culture to optimize process innovation will lead to improving productivity. The adoption of new technologies is often challenging with lagging productivity gains. Investments into business processes contribute to faster adoption of new technologies and higher market valuations. For example, workflow processes provide a framework to better leverage new technologies by shortening the time to productivity gains. In addition, investments into business processes, intangible assets, contribute to higher equity valuations and are often reflected in growing levels of goodwill generated with technology company acquisitions.

As a core process we suggest a data analytics framework using feedback loops to optimize outcomes and deliver a better approach to leveraging technology adoption. This approach ensures that technology adoption strategies and implementations are based on data and driven by process optimization. In addition, employing an analytics roadmap to manage disruptive technology adoption with defined feedback loops set to optimize successful outcomes further improves value.

Technology and the Productivity J-Curve Paradox

As mega trends unfold; such as cloud architecture, 5G cellular, big data, IoT sensors along with machine learning, a successful structural framework for embracing these new technologies needs to embrace and address the disruption while engaging with processes that optimize desired outcomes. 

In 1987, Robert Solow, a Nobel Laureate and MIT professor, quibbled about the preponderance of computers and lack of productivity. So this is not a new issue. The economics of business process and the Productivity J-Curve concept was framed by Erik Brynjolfsson, Daniel Rock, and Chad Syverson – who examined the often slow and bumpy productivity gains arising from the adoption of new technologies. Their collective studies from the National Bureau of Economic Analysis offer a compelling rationale for developing business processes that enhance the adoption of innovative technologies. In essence, because training, experience curves, changes to business operations and services lag productivity gains. Their findings suggest “the more transformative the new technology, the more likely its productivity effects will initially be underestimated.” A recent article in The Economist, Reasons to be Cheerful, highlighted how education and training that speed the adoption of new innovation could raise productivity. 

Figure 1 Productivity J-Curve

Read More

Indoor Air Quality is Crucial for Safety and Productivity

The risks of viruses are now starkly apparent, and it’s only going to get worse with climate change according to researchers. This begs the question: How do we better protect building and office occupants from the risks of contagion? This post will explore how we can better prepare for future pandemics, reduce the risks of contagion, and navigate the uncertainty of these challenging times. 

The most important element in any interior air and environmental assay is accessing data regarding environmental conditions and operations within a defined space. Applying data analytics and machine learning algorithms can help create a comprehensive roadmap to improve operating efficiencies and understand conditions pertaining to emergent risks and exposure.

A process improvement framework is constructed by transforming data and analytics into metrics that are aligned to desired outcomes such as sustainability and energy efficiency. Green Econometrics has developed a framework to monitor, measure and curate data pertaining to process and sustainability performance.  This is extremely important.

Read More

Economics of Oil

Advances in technology such as seismic imaging with Dawson Geophysical and horizontal drilling with Schlumberger have dramatically changed the economics of oil and gas extraction. The change in oil economics is so profound that the cost structure of hydrocarbon fuels will reverberate through the global energy market and impact pricing of renewables energies and investment decisions. So profound are these changes that the US has surpassed Saudi Arabia and emerged as the world’s largest oil producer.

With the price of oil falling as a result of large production gains in US oil production. The price of oil is may fall below $40 per barrel according to an article in Barron’s The Case for $35 a barrel Oil suggesting further oil price declines are possible.

Read More

2010 Update on Oil Consumption and CO2 Levels?

The worst global economic recession in since the Great Depression seems to be abating. Given the severity of the financial crisis, it might serve to review what impact the recession has had on oil consumption. In addition, what impact did the decline in oil consumption have on atmospheric CO2 concentration levels?

Since 2006, global oil consumption declined by 1.1 million barrels per day (BPD) from 85.2 in 2006 to 84.0 in 2009. Oil consumption in the US declined 9% to 18.8 million from 20.7 million BPD in 2006. Europe experienced a decline of 7% over this same period with a drop of 16.5 million to 15.2 million BPD. However, over this same period, oil consumption in China and India increased 16% and 13%, respectively. This data was complied from the US Department of Energy Information Administration (EIA) and is displayed in the following charts.

To measure how significant the impact has been, the following charts provide some insights in evaluating how deteriorating world economies may have impacted oil consumption and secondly, whether reduced oil consumption has mitigated heightened CO2 levels.

Figure 1 Global Oil Consumption Global Oil
Source: EIA

From Figure 1, the impact of the global financial crisis is depicted with the decline in global oil consumption. When a comparison is applied to oil consumption between the US China, and India, the relative drop in oil consumption is less discernable.

Figure 2 US, China, and India US China & India
Source: EIA

Figure 2 provides a summary of oil consumption of the US, China, and India. A measurable decline in oil consumption can be seen, but only in the US market.

Figure 3 China and India China and India
Source: EIA

Figure 3 demonstrates the steady and pronounced growth in oil consumption for China and India. Despite the global financial crisis, oil consumption significantly expands in China and India due to secular growth from rapid industrialization in both countries. When measured with respect to the European market, China and India have grown from 15% of the oil consumption rate of Europe in 1980 to over 74% of the consumption level in 2010.

Figure 4 CO2 Levels CO2
Source: NOAA

With the decline in global oil consumption, perhaps a positive benefit would be a fall in CO2 levels. The atmospheric CO2 readings in part per million (PPM) where taken from the National Oceanic and Atmospheric Administration (NOAA) from the Mauna Loa CO2 Levels monthly measurements. Figure 4 illustrates the average annual atmospheric CO2 concentration readings in Mauna Loa, Hawaii from 1980 through 2010.

The bottom line is even while global oil consumption declined during the recession, growth in China and India remained unabated and subsequently, CO2 concentrations in the atmosphere continue at elevated levels.

In memory of Jamie Kotula – loved by family, friends, teammates, and school.

Heating and Cooling – Does Insulation Pay?

Insulation is one of the most important factors in improving building energy efficiency. Heating, ventilation and cooling (HVAC) often accounts for more than half the energy expense of a building. Insulation helps to improve the energy efficiency of heating and cooling. Depending on the selected insulating material, the economic impact on heating costs can be quite dramatic.

To understand how insulation helps improve building heating and cooling, it’s helpful to review the dynamics of building heat loss as it applies to building materials and outside actual air temperatures.

To calculate the heating requirements for a building, the overall heat loss from a building can be derived as a function of the combined heat loss of transmission through the roof, walls, windows, doors, and floors, as well as heat loss caused by ventilation and air infiltration. In general, without getting too scientific, the heat loss from transmission through roof, walls, doors, and windows represents the largest impact and is primarily a function of the temperature difference between the inside and outside air and thermal conductance of he building material. For a more detailed review of building heat loss see Heat Loss.

The difference between inside and outside temperature plays a critical role in building heat loss. The first step is to understand heating and cooling requirements from weather data. Heating degree day (HDD) are a measure of energy demand required to heat a building. HDD is derived from the difference between the daily outside temperature observations and the ideal indoor air temperature, say 65 degrees Fahrenheit (18.30 Celsius). The heating requirements for a building in a specific location can be derived from the HDD data in conjunction with building factors such as insulation, windows, solar heat gain, and use. Air conditioning also has a similar metric and is defined as cooling degree day (CDD) and measures the amount of energy used to cool a building.

From the historical data on outside air temperature, an average heating and cooling degree day can be assigned to a specific region. To calculate degree days for both heating and cooling Daily Temperatures can be assessed by zip code to capture historical data on specific climate zones.

When it comes to selecting building materials and insulation, material suppliers often supply two measures – the R-value and C-value. A material’s R-value (thermal resistance) is the measure of its resistance to heat flow. The C-value (thermal conductance) is the reciprocal of thermal resistance and measures the ability of a piece of material to transfer heat per unit time or more specifically, specifies the rate of energy loss through a piece of material.

The US Department of Energy (DOE) has provided revised R-value recommendations based on climate zones. To understand the energy impact of selecting the right R-value insulation material for your building, an on-line heating calculator will help illustrate the heating requirements and associated energy costs for different insulating materials. Building heating requirements are often expressed in BTU (British Thermal Units) per cubic foot.

The Heater Shop BTU Calculator Heating Calculator provides some useful insight into managing energy expenses. The calculations were based on an average of 25 HDD for New York City.

Figure 1 illustrates the heating requirements as measured by BTU per square foot of building space for corresponding insulating materials across ceiling heights from 10 to 40 feet to capture cubic feet. As seen from Figure 1, the heating requirements show significant variance depending on insulation assumptions.

Figure 1 BTUs per Square Foot BTU
Source: Heater Shop BTU Calculator

Taking the building heating requirements one-step further, different insulating assumptions (no insulation, average, and good) translate into wide dispersion in operating costs. The on-line heating calculator was used to estimate the building heating requirements based on the following assumptions: 10,000 square foot facility with ceiling height of 10 feet for 25 HDD for no-insulation average insulation, and good insulation. To derive fuel costs, the BTU per square foot for each insulation category was applied to a heating system operating for five heating months with approximately 1,400 hour of operations to coincide with a gas furnace at 90% efficiency and 20-minute on-cycle and 30-minute off-cycle. Gas pricing for heating are based on $17.00 per million BTU.

Figure 2 Heating Energy Cost  Heating
Source: Green Econometrics research

Figure 2 demonstrates that heating cost per square foot for good insulation saves approximately $2.90 per square foot in comparison to no-insulation at all. If we compare the heating costs savings to the cost of insulation, the payback period for insulation can be achieved in a year under most circumstances.

Figure 3 Insulation Cost  insulation
Source: Green Econometrics research

To assess the C-value and R-Value of various building materials, there are some useful charts available on the web. Insulation and Building Materials R-Values

The bottom line is that insulation is one of the most important building components materials to improve energy efficiency and lower utility costs.
Should we be Concerned over Elevated CO2 levels?

With the oppressive heat and appalling humidity along the Eastern Seaboard, one considers the possibility of climate change and the impact of that greenhouse gases may have on our environment. Without developing statistical regression models to gleam any semblance of understating of carbon dioxide’s impact on climate change, let’s just look at some charts that illustrate the changes of CO2 levels though history.

While industry experts and scientist debate whether elevated CO2 levels have an impact on climate change, the scientific data taken from ice core samples strongly suggests CO2 levels have remained in a range of 180-to-299 parts per million (PPM) for the last four-hounded thousand years. Scientists have developed models to suggest that rising CO2 levels contributes to global warning which are subsequently followed by dramatic climate changes that lead to periods of rapid cooling – the ice ages.

Scientific theories suggest that rising global temperatures melts the Polar ice which allows substantial amounts of fresh water to enter the oceans. The fresh water disrupts the ocean currents that are responsible for establishing a nation’s climate. As oceans warm near the equator, the warmer water travels towards each of the Polar areas. The cooler water near the Polar areas sinks and travels towards the equator. These ocean currents allows for stable climates. The issue is that fresh water is less dense because it is not salty like seawater. Therefore, the fresh water does not sink like the cold salinated seawater thereby disrupting the normal flow of the ocean currents.

Figure 1 CO2 Ice Core Data – illustrates the level of CO2 over the last four-hounded thousand years. The Vostok Ice Core CO2 data was compiled by Laboratoire de Glaciologie et de Geophysique de l’Environnement.
Ice Core Data

Figure 1 CO2 Levels – Vostok Ice Core CO2 Ice Core
Source: Laboratoire de Glaciologie et de Geophysique de l’Environnement

If this Ice Core CO2 data is correct, then the current data on atmospheric CO2 levels is quite profound. CO2 data is complied by the National Oceanic and Atmospheric Administration NOAA at the Mauna Loa Observatory in Hawaii. The latest trend indicates CO2 levels for June 2010 are at a mean of 392 ppm versus 339 in June 1980 and 317 in 1960. Clearly these CO2 levels are elevated. The question is what is the impact on our environment.

Aside from the catastrophe in the Gulf of Mexico and the dire need to find an alternative to our dependence on oil, should we not accelerate our efforts to find an alternative energy solution and as a way to mitigate the impact of CO2 on our environment? Maybe investment into alternative energy could help solve multiple problems.

Figure 2 Mauna Loa CO2 Readings  Mauna Loa
Source: Source data published by the National Oceanic and Atmospheric Administration (NOAA)

The bottom line is that we need to consider the possibility that elevated CO2 levels in our atmosphere could potentially have a detrimental impact on our climate. In any event, limiting our dependence on fossil fuels, the main contributor to CO2, should be paramount. Let us not forget oil is supply-constrained – there are no readily available substitutes aside from electric vehicles, and without a strategy to embrace renewable energy, supply disruptions will have a painful impact on our economy, national security, and environment.

University of Illinois Researchers Demonstrate Innovative Approaches to Lower Photovoltaic Panel Production Costs

Even if silicon is actually the industry common semiconductor in the majority of electric products, including the solar cells that photovoltaic panels employ to convert sunshine into electricity, it is not really the most effective material readily available. For instance, the semiconductor gallium arsenide and related compound semiconductors offer practically two times the performance as silicon in solar units, however they are rarely utilized in utility-scale applications because of their high production value.

University. of Illinois. teachers J. Rogers and X. Li discovered lower-cost ways to produce thin films of gallium arsenide which also granted usefulness in the types of units they might be incorporated into.

If you can minimize substantially the cost of gallium arsenide and other compound semiconductors, then you could increase their variety of applications.

Typically, gallium arsenide is deposited in a single thin layer on a little wafer. Either the desired device is produced directly on the wafer, or the semiconductor-coated wafer is cut up into chips of the preferred dimension. The Illinois group chose to put in multiple levels of the material on a one wafer, making a layered, “pancake” stack of gallium arsenide thin films.

Figure 1 Thin Film Solar Thin Film
Source: University of Illinois

If you increase ten levels in one growth, you only have to load the wafer once saving substantially on production costs. Current production processes may require ten separate growths loading and unloading with heat range ramp-up and ramp-down adds to time and costs. If you take into account what is necessary for each growth – the machine, the procedure, the time, the people – the overhead saving derived though the new innovative multi-layer approach, a substantial cost reduction is achieved.

Next the scientists independently peel off the levels and transport them. To complete this, the stacks alternate levels of aluminum arsenide with the gallium arsenide. Bathing the stacks in a solution of acid and an oxidizing agent dissolves the layers of aluminum arsenide, freeing the single thin sheets of gallium arsenide. A soft stamp-like device picks up the levels, one at a time from the top down, for shift to one other substrate – glass, plastic-type or silicon, based on the application. Next the wafer could be used again for an additional growth.

By doing this it’s possible to create considerably more material much more rapidly and much more cost effectively. This process could make mass quantities of material, as compared to simply the thin single-layer way in which it is usually grown.

Freeing the material from the wafer additionally starts the chance of flexible, thin-film electronics produced with gallium arsenide or many other high-speed semiconductors. To make products which can conform but still retain higher performance, which is considerable.

In a document published online May 20 in the magazine Nature the group explains its procedures and shows three types of units making use of gallium arsenide chips made in multilayer stacks: light products, high-speed transistors and solar cells. The creators additionally provide a comprehensive cost comparability.

Another benefit of the multilayer method is the release from area constraints, specifically important for photo voltaic cells. As the levels are removed from the stack, they could be laid out side-by-side on another substrate to create a significantly greater surface area, whereas the typical single-layer process confines area to the size of the wafer.

Figure 2 Solar Arsenium Arsenium
Source: University of Illinois

For solar panels, you want large area coverage to catch as much sunshine as achievable. In an extreme situation we could grow adequate levels to have ten times the area of the traditional.

After that, the team programs to explore more potential product applications and additional semiconductor resources that might adapt to multilayer growth.

About the Source – Shannon Combs publishes articles for the residential solar power savings web log, her personal hobby weblog focused on recommendations to aid home owners to save energy with solar power.

Energy Perspective

After reviewing oil data from the Energy Information Administration (EIA), Global Petroleum Consumption , it may be helpful to put energy consumption into perspective. Most of us are quite familiar with alternative energy such as solar and wind, but the reality is, even if solar and wind could supply all of electric energy needs, the majority of our energy needs is still predicated on access to oil.

While industry experts and scientist debate whether more drilling will ameliorate the energy challenge we face, let’s look at a couple of data points. Figure 1 US Oil Field Oil Production and Drilling Rigs – illustrates that higher drilling activity as measured by Baker Hughes Rig Count data does not necessarily correlate to more oil production as measured by US Oil Field Production by the EIA. Higher drilling activity does not produce more oil.

Figure 1 US Oil Field Production and Drilling Rigs US Oil Demand
Source: Energy Information Administration and Baker Hughes research

Despite the large investment in drilling rigs that more than doubled from 1,475 in 1974 to over 3,100 in 1982, US oil production remained relatively flat. Moreover, even the most recent drilling expansion activity that again more than doubled from 1,032 rigs in 2003 to over 2,300 rigs in 2009, resulted in relatively flat oil production, suggesting that on the margin unit oil production per drilling rig was declining. Perhaps even more disturbing is that the most recent drilling activity in the US was accomplished through extensive use of technology. Seismic imaging technology is being used to better locate oil deposits and horizontal drilling technologies are employed to more efficiently extract the oil, yet oil production still lags historic levels. While on the margin, newly announced offshore drilling could add to domestic oil production, extraction costs of oil will continue to rise adding to further oil price increases.

However, what is most profound is our dependence on oil for most of our energy needs similar to how wood was used for fuel construction material during the 1300’s and 1600’s. If we translate energy consumption into equivalent measuring units such as kilowatt-hours, we can compare and rank energy consumption. Although electricity is captured through consumption of several fuels most notably coal, a comparison of energy usage between oil and electric provides an interesting perspective.

Figure 2 Energy Perspective – provides a simple comparison of the consumption of oil and electricity measured in gigawatt-hours (one million kilowatt hours). A barrel of oil is equivalent to approximately 5.79 million BTUs or 1,699 KWH and the US consumed approximately 19.5 million barrels per day equating to 12 million gigawatt-hours a year. The US uses 4 million gigawatt-hours of electric energy annually. The critical point is that even if solar and wind supplied all of our electric energy needs, it would still only comprise 30% of our total energy needs. Therefore, without an energy strategy that facilitates migration towards a substitute for oil, particularly for transportation, we are missing the boat.

Figure 2 Energy Perspective Oil
Source: Energy Information Administration and Green Econometrics research

It’s not all doom and gloom. Technologies are advancing, economies of scale are driving costs lower, and the economics for new approaches to transportation are improving. From hybrids and electric vehicles benefiting from advances lithium-ion batteries to hydrogen fuel cell vehicles getting 600 miles on a tank of fuel. These advanced technologies could mitigate our addiction to oil, however, without formulating an energy strategy directing investments towards optimizing the economics, energy efficiency, environment, and technology, we may miss the opportunity.

The bottom line is that oil is supply-constrained as there are no readily available substitutes, and therefore, without a means to rapidly expand production; supply disruptions could have a pernicious and painful impact on our economy, national security, and welfare.