Cloud Analytics Disruptive Innovation
Why Cloud Computing and Data Analytics Enable Digital Transformation
From the inception of the Industrial Revolution several core ingredients enabled the transformation and growth of industry. Among these core building blocks of the Industrial Revolution namely: access to risk capital, visionary entrepreneurs, available labor, technology, resources and energy. Technology and energy play a crucial role in not only growing industry but enable scale. Technology can open new markets and provide advantage through product differentiation and economies of scale. Energy is literally the fuel that scales operations.
Today technology, built from knowledge and data, is how companies compete. Energy now emerges as even more integral in scaling operations. Just as James Watt developed the first steam powered engine in 1606 commencing the Industrial Revolution, it was the access to available coal with the use of the steam powered pump, invented by Thomas Savery in 1698, that allowed greater access to coal that gave scale to industry.
Most recently, the pending transaction of Salesforce’s (CRM) acquisition of Slack (WORK) after acquiring Tableau last year serves as a reference in valuing the importance of technology is to sustaining market value. The market value of seven companies accounts for 27% of the approximately $31.6 trillion for the S&P 500. Evaluating the industry and market impact of innovative technologies can be viewed through the lens of stock valuations, particularly as it applies to mergers and acquisitions. This article reviews the companies and the technologies from the perspective of market sales opportunity and the economic impact of the technologies based on the price/performance disruption to the industry.
So why are we focusing on energy and data today? Energy, predominantly hydrocarbon fuels such as oil, natural gas and even coal is how people heat their homes and buildings, facilitate transportation, and generate electricity to run lights, computers, machines and equipment. In addition, there is substantial investment focus on the digital economy, Environmental and Social Governance (ESG), and innovative technologies. A common thread among these themes is energy and data.
Data and Energy are the pillars of the digital economy. Energy efficiency can reduce carbon emissions, thereby improve ESG sustainability initiatives. Innovative technologies around energy and data are opening new markets and processes from formulating new business models to structuring and operating businesses.
The climate imperative and investing in energy infrastructure and environmental ESGs are predicted on energy efficiency and relevant performance metrics to evaluate investment allocation decisions. Therefore, our initial emphasis begins with a background on energy consumption with focus on electric consumption trends, carbon footprint, Green House Gas (GHG) emissions, sustainability, electric grid resilience, and technologies that impact energy including Electric Vehicles (EV), energy storage, and Autonomous Driving (AD). Data technologies encompass cloud architecture, Software as a Service (SaaS), Machine Learning (ML) analytics, and the importance of data as the digital transformation gives rise to the digital economy.
Digital Economy Performance Metrics
Before we dive into the financial and competitive analysis, let’s review business models that are disruptive to the status quo. That is are innovative technologies capable of rapid scale and efficiency gains that change the economics of the market and business profitability. In addition, disruptive events, driven primarily by technology, often appear as waves as the adoption of innovative technologies expands through the market.
Prominent technological waves such as the personal computer (PC), followed by the internet and smartphones and most recently social media and cloud computer all manifested themselves in engendering new business models and creating new market opportunities that dramatically changed the status quo among leading companies at the time. We will use the internet and mobile technology waves to explain how the introduction of innovative technologies offering vastly improved means of commerce enabled the development of new services that changed the business landscape.
Most recent advances in technology appear as waves and give rise to new business models and markets. The internet is one example. The internet enables the connection and process of communication over a new channel. The internet allowed one-to-one and one to many communications and the ability to engage, transact and scale using a digital platform that tremendously lowered the cost of engagement. Scale is among the most important attributes of the internet because the cost of digital replication is close to zero.
Mobile and smartphones began a new era in the digital world. The smartphone allowed a large portion of the world to interact with the internet for the first time on a mobile device. The mobile wave provided platform that enabled the introduction of a host of new business models. The introduction of the Apple iPhone gave way to several new services and industries all from your cell phone.
Let’s review the business model impact of innovative technologies as it applies to cost structure.
Cost Structure and Disruptive Innovation
As explained by ARK Investment Management’s Catherine Wood, the rate of cost decline can be used as a proxy for evaluating the disruptive impact of innovative technology. Cost structure improves as unit production expands. As first postulated by Theodore Wright, an aerospace engineer, who postulated that “for every accumulated doubling of aircraft production, costs fell by about 20 percent”. Wright’s Law as it is now known is also called the Learning Curve or Experience Curve and it is found across industries that experience different rates of declining costs.
What is important from the perspective of investment firms such as Ark is that the magnitude of disruptive impact can be gleaned from these declining cost curves. Revenue growth can then be correlated from these declining cost curves. Essentially, demand elasticity and future sales can be derived from the rate of product cost declines.
This is why price/performance and scientific metrics play an important role in evaluating products, services and company competitive positions. For example, the average cellular price per gigabyte (GB) of data is approximately $12.37 in 2020 according to Small business trends. Another example in science, is the physical performance of an LED light assessed by lumens the light output to the amount of energy consumed in watts such as lumens/watt (Lm/W). These metrics are points in time. For more context, the changes over time and magnitude of change provide insight into inflection points, trends, patterns and relationships.
As devices become complex, encompassing separate processors for communications, computing, power, video and various sensors, it is the integration and orchestration of the overall device performance that becomes of greater value to the user. So, price/performance, scientific understanding and economics become more attuned to relationships among these varied and interdependent components.
TAM Expansion Attribute
Product attributes play a significant role in expanding the addressable market. Total Addressable Market expansion attribute applies to value features that enable the product or service to address a larger market opportunity. For example, offering an EV battery that supports longer vehicle driving range and shorter charge time provides a broader solution to allow more consumers to benefit from the battery feature and therefore capture a larger portion of the market. Quantifying the value proposition so that the market easily understands the benefits can help drive revenues and create a competitive advantage for the supplier
Transaction Costs
Transaction costs are an interesting and often overlooked economic impact on business operations. Transaction costs involve monitoring, measuring, and managing business activities. Transaction costs were defined by Ronald Coase, the 1991 Nobel Prize laureate in Economics with “The Nature of the Firm,” published in 1937. By reducing transaction costs, advances in technology and innovation can translate into higher productivity.
For instance, to facilitate exchange of goods and services, agreements and specifications as to weight, size, volume, ingredients, and performance need to be established. The verification and monitoring of these values involve transaction costs. Minimizing activities associated with managing, monitoring, and measuring reduce transaction costs.
In general, the more goods and services are standardized, the lower the transaction costs. Data and in particular, analytics play key roles facilitating information flow and enhancing decision making.
Scale
The internet has removed geography as a limitation for commerce. The internet enables the ability to communicate and conduct the sales in the same transaction. A standardized approach to transporting data reduced transaction costs associated with monitoring and managing transactions helping to improve productivity. Data over the internet from PC and cellular phones continues to escalate measuring data traffic in the billions of terabytes. The ability to leverage the scalability of internet data transport virtually eliminates transaction costs. The ability to scale substantially improves productivity and thus enables the creation of new business models that disrupt the status quo and open new markets.
Another way to look at scale is Moore’s Law. Gordon Moore, CEO and co-founder of Intel, in 1965 postulated that the number of transistors per silicon chip doubles every year. Moore observed that the number of transistors on a computer chip was doubling about every 18–24 months giving rise to unprecedented improvements in computer processing.
A better understanding of the value of scale is to review Bob Metcalfe who proposed that a network’s value is proportional to the square of the number of nodes in the network. Bob Metcalfe co-invented Ethernet, co-founded 3COM. One way to look at this is to ask what is the value of a cell phone if no one else had a phone or what would be the value of Facebook (FB) if you were the only one on the platform.
Cloud computing lends itself to both scale and lowering transaction costs. Cloud architecture supporting compute, storage and cloud service offerings such as SaaS and platform-based services orchestrated by an array of companies including Apple (AAPL), Amazon (AMZN), Alphabet (GOOG), Facebook, Netflix (NFLX) and many others, demonstrates the formamide disruption of the cloud scale achieves.
Ease of Use
Often overlooked, but ease of use is essential in driving market acceptance on and revenue growth. Just as web browsers allowed more people to experience the internet, enabling a broader audience is key to opening new markets. The iPhone might serve as a prime example of how ease of use can act as a transformative method to enable innovative technologies to bridge the chasm to reach the main street market.
Uncertainty
Decision making facing uncertainty elevates risks and costs in the decision process. Data and analytics help to mitigate uncertainty and risks. Increasing uncertainty increases the costs of decisions. Greater access to data and analytics helps to manage costs by offering perspective, context and insight.
Productivity and Process
When the workflow process incorporates an analytics framework that aligns performance metrics to desired outcomes through feedback loops, time to productivity payback is reduced. From our post on Why Analytics Process Blueprints Mitigate Productivity J-Curve and Create Value engendering a data analytics framework culture to optimize process innovation will lead to improving productivity. The emphasis is that the adoption of new technologies is often challenging with lagging productivity gains and therefore companies that embrace a technology process adopt productivity gains faster. Technology process adoption begins with curating performance metrics that align with business objectives. Data and analytics help to define the process by identifying performance metrics that optimize outcomes through monitoring and measuring data flow.
Standardization
Standardization assists in reducing transaction costs which often translate into higher productivity. To facilitate the exchange of goods and services, specifications as to weight, size, volume, ingredients, and performance are established.
For example, world trade accelerated after the advent of containerized shipping. with the introduction of containerized shipping. Adoption of containerized shipping with standardization and uniformity in packaging, logistics, and operations dramatically reduced costs and improved productivity of global trade. Alphabet introduced Google Cloud services in 2014 using containerized applications and workloads facilitated over the cloud giving rise to Kubernetes. Kubernetes are now an open-source system to deploy, scale, and manage containerized workloads and applications over the cloud. They make it easier, faster and cheaper to manage cloud services.
Better, faster, cheaper has been the mantra product innovation and an attribute to define the magnitude of disruption. We will use the disruptive economic framework and financial analysis to better illustrate what technologies are game changers.
Financial Analysis Approach
This article will explore how data and energy are linked and metrics used to analyze the disruptive impact of new technologies. We will explore two approaches to evaluate financial performance and the economic impact of disruptive technologies. The financial lens from which we view innovative energy and data-oriented companies will focus on several metrics including:
- Return on Invested Capital (ROIC)
- Capital Intensity – Invested Capital
- Revenues and Revenue Growth Rate
- Market Valuation Price-to-Sales (P/S) Ratio
- Operating Cash Flows
To assess the impact of disruptive technologies, our framework will engage performance metrics to quantify the magnitude of the economic impact. Specifically, price/performance metrics geared toward measuring the economic impact on the industry and relative competitive dynamics resulting from the introduction of innovative technologies around energy and data. An understanding of both the level of technological improvement and how investors view technology companies provides the framework to assess trends and inflection points.
Technology – Competitive Economic Analysis
Where direct measurement can be applied some technological advancements can be illustrated using a price/performance framework. In some instances, the measurement might be more elusive to quantify. In those circumstances, a qualitative assessment is useful in understanding the merits of the technology. Geoffrey Moore has several books including Crossing the Chasm and The Gorilla Game providing a vivid description of approaches to understanding market adoption of technology and tools to evaluate performance. The important point is what enables a company to sustain its position of leadership.
Compelling User Benefits -Zoom (ZM)with easy-to-use video conferencing and Twilio (TWLO) multi-channel marketing communications.
Proprietary Technology – Tesla (TSLA) autonomous driving and Velodyne (VLDR) with LIDAR -light detection and ranging technology. Innovation is the battleground.
Market Position – Apple (AAPL) with consumer perception and Amazon (AMZN) dominate in eCommerce and cloud services. Position is powerful. The positioning of Apple products goes a long way in capturing mindshare and appetite.
Economies of Scale – In terms of reach, production, and users. Microsoft (MSFT) desktop business software Facebook (FB) in global user base and Amazon with its cloud server network can expand services rapidly without significantly increasing costs.
Switching Costs – these costs incur when one standardizes on a particular platform such as Microsoft Windows or Apple OS where the cost changing compatible software applications inhibit your desire to switch. Not everything is cast in stone. Ethernet cabling such as CAT 5 or 6 wiring for computer networking started with high switching costs but WIFI and wireless communication rooted those barriers.
These completive economic and industry lenses provide a roadmap to assess how long a company could maintain its market position giving rise to its Competitive Advantage Timeframe. We would be remiss if Michael Porter’s Competitive Advantage five-forces model was not incorporated into the competitive analysis – substitutes, new entrants, supplier and buyer bargaining power and rivalry among existing players.
Digital Transformation
As more companies begin to address the digital economy and recognize the importance of processes to leverage new technologies and augment business models, analytics and machine learning will take center stage. Two overarching themes and core premise to this analysis of innovative technologies is that as more commerce commences over digital platforms, more energy is consumed and more data is generated. Secondly, a core tenant of this discussion is predicated on acquisitions of innovative technologies by incumbent players to sustain their respective growth and competitive advantage period. Thus valuation of new entrants with innovative technologies depends on equity capital tied to the market capitalizations of large tech companies.
Figure 1 Tech Company Market Capitalization
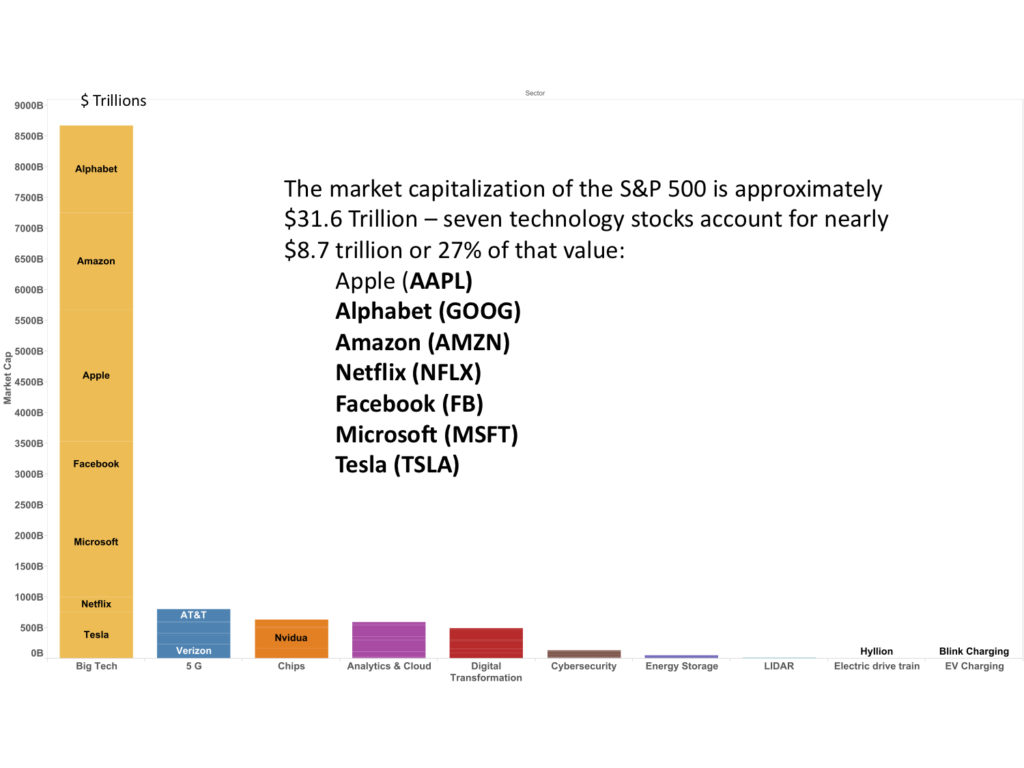
Source: Yahoo Finance, Bloomberg
Seven major technology companies command 27% of the market value of the S&P 500. The market capitalization of Apple, Alphabet, Amazon, Netflix, Facebook, Microsoft and Tesla is over eight trillion in comparison to $31.6 for the entire S&P 500. With large valuations affords the incumbent players to acquire companies with innovative and synergistic technologies and paying up to keep the technology from going into the hands of direct competitors.
Introduction to Big Data, Cloud Computing and Machine Learning
Figure 2 Market Capitalization by Innovation Themes
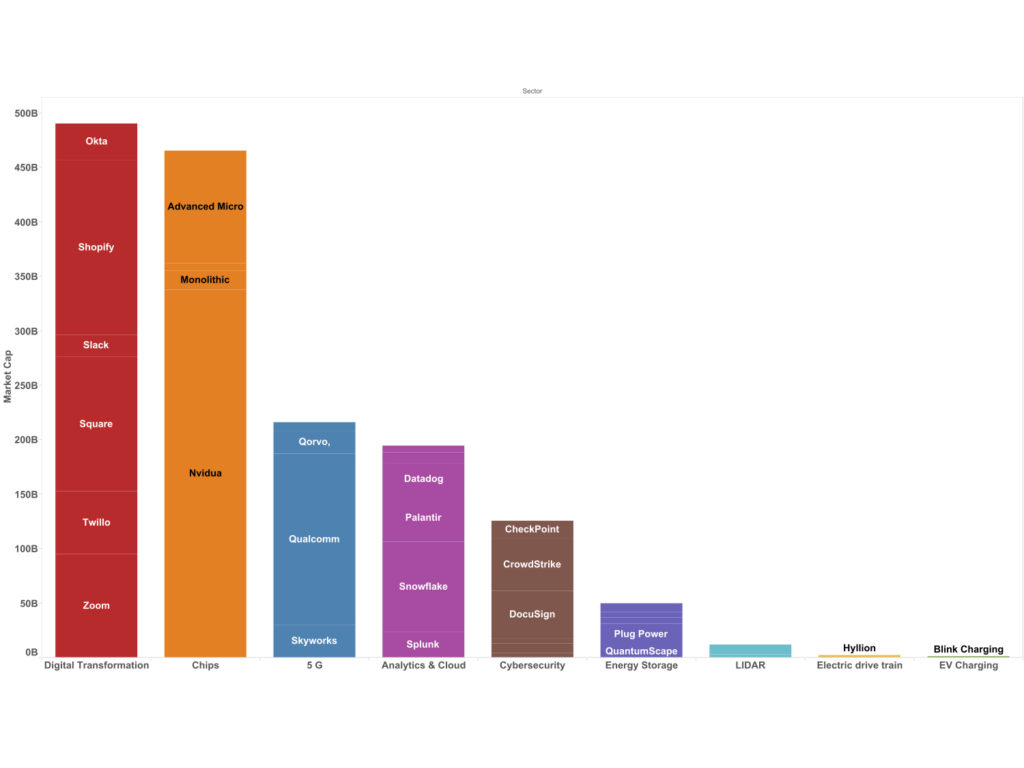
Source: Yahoo Finance, Bloomberg
Data is exploding driven by digital transformation and now the theme is analytics and machine learning over the cloud. Cloud computing was introduced over a decade ago. What’s different now is ease of use, falling costs, instant scale, and microservices that democratize access to cloud computing and data analytics.
On the data portion of our analysis the focus begins with cloud computing, software as a service (SaaS) and data analytics from cloud performance monitoring to machine learning services. Data is what is used to create information that in turn cab engender technology. In fact, today data has become the new fuel for digital transformation. Energy and data are inextricably linked as electrical energy is required to run data centers from PCs and smartphones to cloud servers and the internet. In essence, bits and bytes travel over energy transport infrastructure from electrons in wiring to electro-magnetic waves for cellular and broadcast networks.
To gain a better perspective on the digital economy and in particular, the enabling technologies related to data and digital transformation, a financial lens using price-to-sales ratio for valuation along the vertical axis and revue growth across the horizontal axis, provide a roadmap to valuation and market performance.
Figure 3 Price /Sales Ratio to Revenue Growth
Digital Transformation and Data Sectors
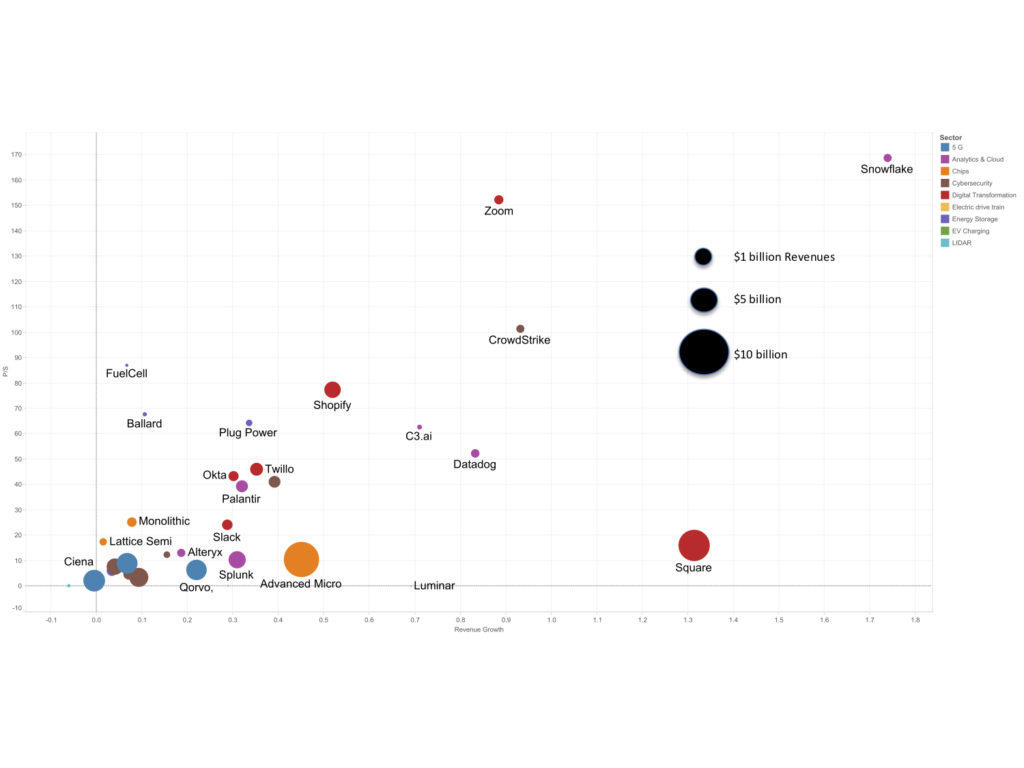
Source: Company reports
Big Data
One of the largest explosions in traffic is data traffic over the internet for searches, ecommerce, social interactions, IoT connected devices and much more. According to protections by Cisco Systems and Ericsson, internet traffic amounted to 113 zettabytes growing at 28% annually. For some perspective, a zettabyte is equal to a trillion gigabytes. With the increase in connected devices including mobile phones and IoT sensors, together with increasing broadband capacity and user interaction, demand for data bandwidth follows.
Figure 4 Data Volume Growth
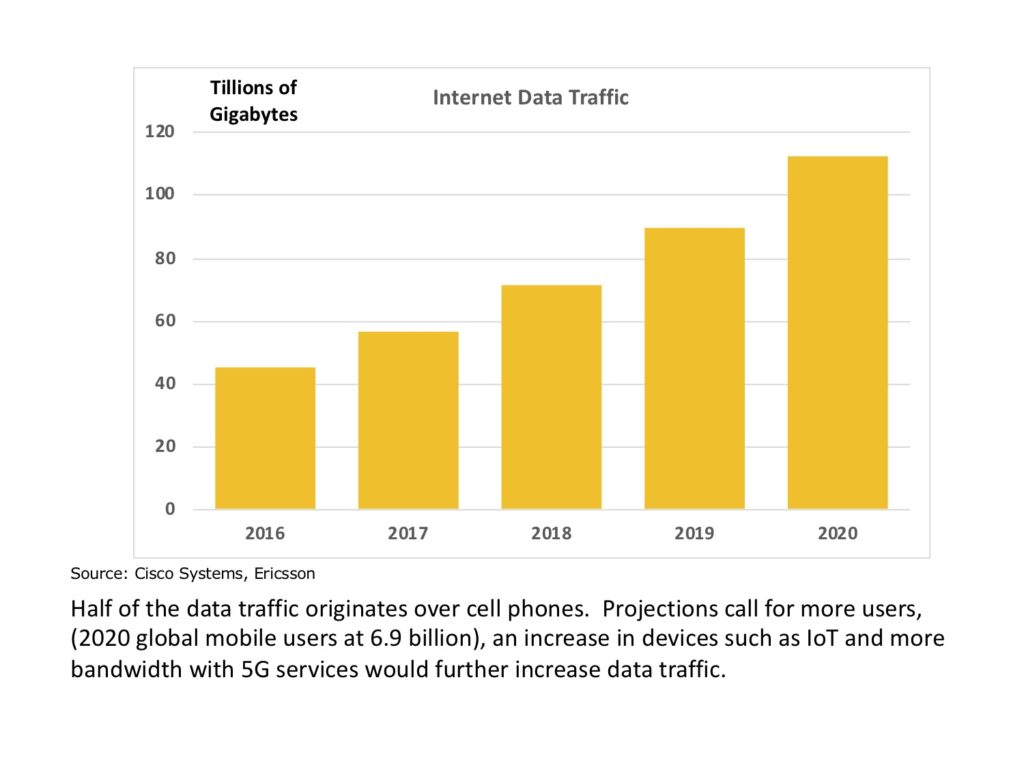
Source: Cisco Systems, Ericsson
Volume, Variety and Velocity
Data traffic volume is dramatically growing as half of the data traffic originates over cell phones. Projections call for more users, (2020 global mobile users at 6.9 billion essentially more cell phones than people). There is also increasing use of more devices such as IoT connected to the internet and other types of sensors. As cellular carriers build infrastructure to support 5G services capable of substantially higher bandwidth, 5G services could further increase data traffic.
Not only is the volume of data growing rapidly so is the variety of different types of data. The digital transformation is generating unique and varied datasets from log files capturing the interaction of ecommerce and internet traffic to an array of unstructured data such as video, pictures, text messages, and social expressions. The composition of data traffic requires new approaches to monitor, measure and curate the diverse datasets from ingestion and pipeline mapping to cloud analytics to generate actionable insight to optimize business performance. .
So, the volume of data traffic is undergoing a radicle change arising from acceleration of digital customer engagement and IT services migrating to scalable and cost-effective cloud architecture. The variety of data is also accelerating with diverse arrays of social, entertainment, ecommerce, financial and millions of apps. And with more connected devices including billions of mobile phones and IoT devices, the velocity of data flow adds to the complexity of securely managing data. According to the GSM Association (GSMA), an industry research group focusing on cellular networks, there are 5.22 billion unique mobile phone users in the world today, according to the latest data from GSMA More importantly, it is the ability to access, ingest and gain actionable insight that acts to improve business performance in a quantifiable manner, that creates economic value.
Data Analytics
Metadata and the integration of various datasets requires a network architecture that is extremely scalable. Data preparations including extraction, transformation and loading (ETL) into a high-capacity data pipelines where data curation and blending can be served to machine learning computational processing is complex. Often the data and analytics processing serve a business functional requirement such as marketing, product innovation or operations. Key performance metrics (KPIs) are identified along with data requirements. The IT department will locate and acquire related data where a business analyst will create a performance dashboard to illustrate progress.
A composable and agile business model using a data and analytics framework enables product innovation, improving customer experience and operating efficiencies, thereby creating business value. In addition, the data and analytics framework can be applied to sustainability improvements., where a large portion of climate impact results from energy consumption. Significant energy efficiency gains can be achieved through monitoring and measuring energy consumption and environmental conditions.
However, as scalable cloud architecture and cost-effective ML algorithms democratize data analytics, the value resides in applying data and analytics to optimize business performance including product innovation, better user experience or higher productivity, a secure and cost-effective scalable network architecture dramatically changes the landscape. Cloud computing is the quintessential game changing technology.
Cloud Computing – Migration to Stampede
Cloud Architecture network services bundled to reduce complexity and costs while improving security and scalability. The ability of off premise cloud services to provide scale and elasticity, is the key differentiator in defining cloud service benefits. Essentially, the ability to ramp up and scale down instantly based on current demands reduces capital and operating expenses while reducing the complexity and management of IT network services.
Figure 5 Cloud Architecture
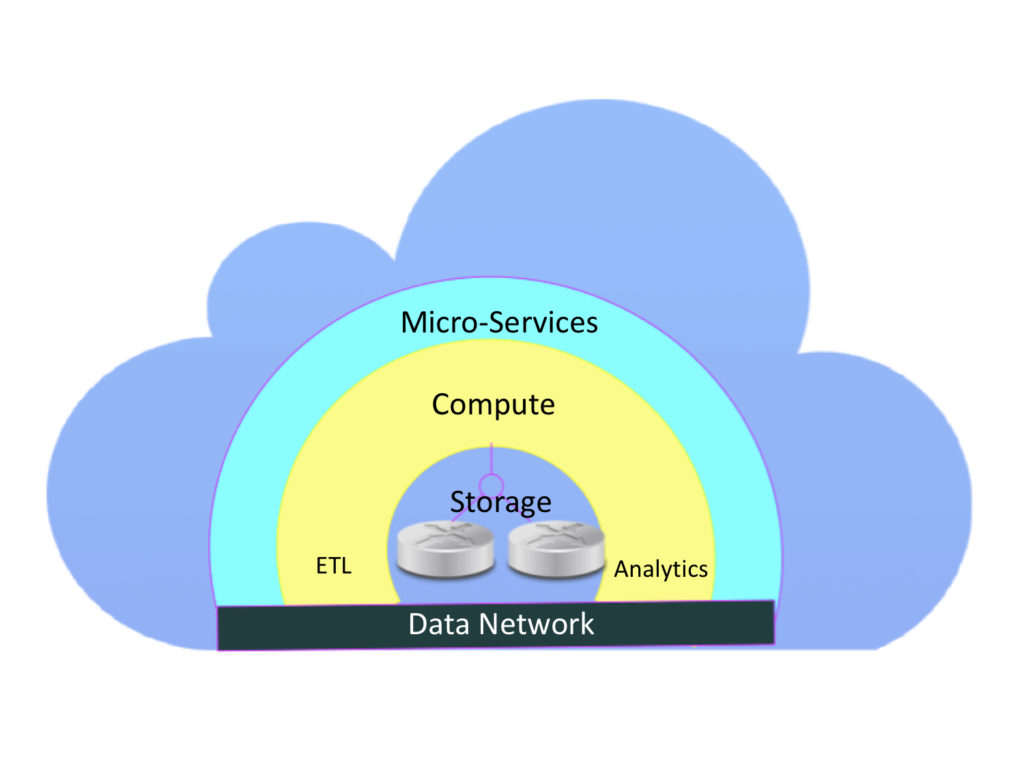
Source: Snowflake
The cloud architecture is a paradigm change to using the network layer control data flow and service delivery with a significant characteristic being the separation of compute (usually CPU processing) and data storage. The network layer plays an ever-expanding role as once on-premise equipment such as routers, firewalls, threat detection and prevention, load balancing are managed from the cloud or even multi-cloud environments. The separation of store and compute plays the same role as using virtualization to manage workflows across multiple servers.
By extending network control functionality to include data extraction transformation and loading (ETL) functions, (also ELT which improves data flow by eliminating data staging by enabling destination to perform the transformation process), micro-services such as containerized apps, and embedded algorithms for machine learning analytics, reduces the cost and complexity of operating data networks. Cloud network services provide scalable and secure infrastructure functionality to enhance the digital transformation undertaking the global economies.
A separate service layer enables the delivery of micro-services including containerized applications, support fort real time APIs (application programing interface) that automate data access and processing, and performance monitoring to manage user experience, threat detection and analytics.
Software Defined Networks (SDN) benefitted from advances in improvements in multiprotocol label switching (MPLS) is used by leading vendors in wide area networking market such as Cisco Systems, Juniper Networks, F5 Networks and Palo Alto Networks. SND sets the stage for cloud computing by enhancing control and performance monitoring in a secure and scalable cloud network infrastructure.
Figure 6 Software Defined Network and Digital Transformation
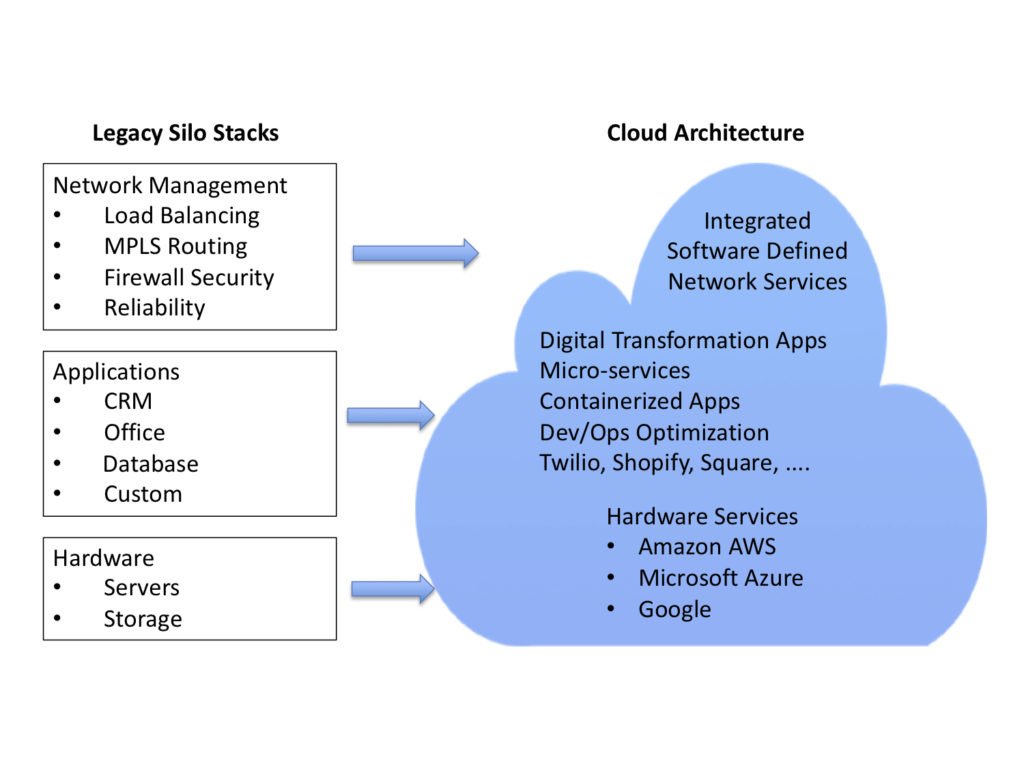
Source: Snowflake, Cloudflare
Kubernetes
According to Wikipedia, Kubernetes is an open-source container-orchestration system for automating computer application deployment, scaling, and management. It was originally designed by Google and is now maintained by the Cloud Native Computing Foundation. Kubernetes, containerized applications and microservices build upon virtualized deployment where a single server can be partitioned to run multiple applications. Virtualization enabled improved hardware resource allocation with scale at a lower cost.
Containerized app deployment, employing Kubernetes approach extends benefits to new applications in the digital transformation world. Some of the benefits of Kubernetes is consistent application operating look and feel across operating devices, better detail into app operating performance, shorter Dev/Ops lead time, and lower costs.
Micro-services, particularly applications providing threat detection and machine learning algorithms drive a new paradigm in product innovation. The ability to ingest high-fidelity diverse data sources with intelligent and scalable processing at the edge of the network, meaning bring computing closer to the source of data. For example, by reducing latency of transforming sensor generated data into actionable insight, faster response time is achieved in the physical and digital world.
Edge Computing is one approach in processing power to the edge of the network and may play a substantial role as 5G cellular networks evolve. Edge computing serves to capture data from IoT devices. IoT devices, ranging from energy and environmental monitoring sensors combined with a wireless communication uplink to a cellular or Wi-Fi network are capable of measuring and monitoring physical conditions such as temperature, volts, particulate matter in the air, and transmit the data for analytics. If this data is processed closer to where data is generated, latency and network capacity requirements are reduced. Pushing processing closer to the network edge, that is embedding processing power and software at point of origin, reduces latency or processing delay.
Latency is vital for transaction processing time where reducing risks and assuring secure financial transactions are important. Many IoT sensors provide linkage to data analytics platforms where fault and anomaly detection, measuring, pattern recognition can provide invaluable services to reduce risk exposure, conserve resources such as energy and water and improve financial performance which often depend on reducing latency.
Semi-structured Data found in legacy enterprise data storage systems has largely been composed of structured data. Structured data, such as what appears as rows and columns in a spreadsheet is the typical format. With digital transformation, data has evolved to include text, graphics, video and voice that is typically unstructured and does not fit easily into rows and columns. The processing of unstructured and semi-structured data is more complex and challenging. As more data originates as unstructured enhanced search and analytics are required.
Availability and Reliability are core aspects of enabling cloud-based services. Latency is also an important metric to consider in evaluating cloud services. Without reliable and available network services, digital transformation hits a roadblock along with UX and ecommerce. Therefore, the starting line for digital engagement begins with reliable and available network services.
Infrastructure and Application Monitoring are some of the service offerings. Some of the business use cases include: Application Performance Monitoring (APM), Application with Infrastructure Monitoring (AIM), Digital Experience Management (DEM) and Digital Business Analytics (DBA) which follows along with User Experience (UX).
Data Centers
While this digital transformation can help drive business productivity, it comes at a cost, and that is energy consumption. According to the Department of Energy, US commercial buildings consumed 1.2 trillion kWh. There are approximately 84.8 billion square feet of US commercial building space. US commercial building consume an average of 34 kWh per square foot. The growth in cloud computing and data centers have energy intensity levels substantially higher. With an average energy intensity of 34 kWh per square foot for commercial buildings, a useful proxy to benchmark energy efficiency, data centers typically operate 24/7 and therefore consume substantially momore energy reaching 500 kWh per square foot and more.
As Digital Transformation ensues, data traffic expands dramatically creating greater demand for energy. The following figure Energy Intensity shows data centers in comparison to commercial buildings measured in kWh/ square foot.
Figure 7 Energy Intensity
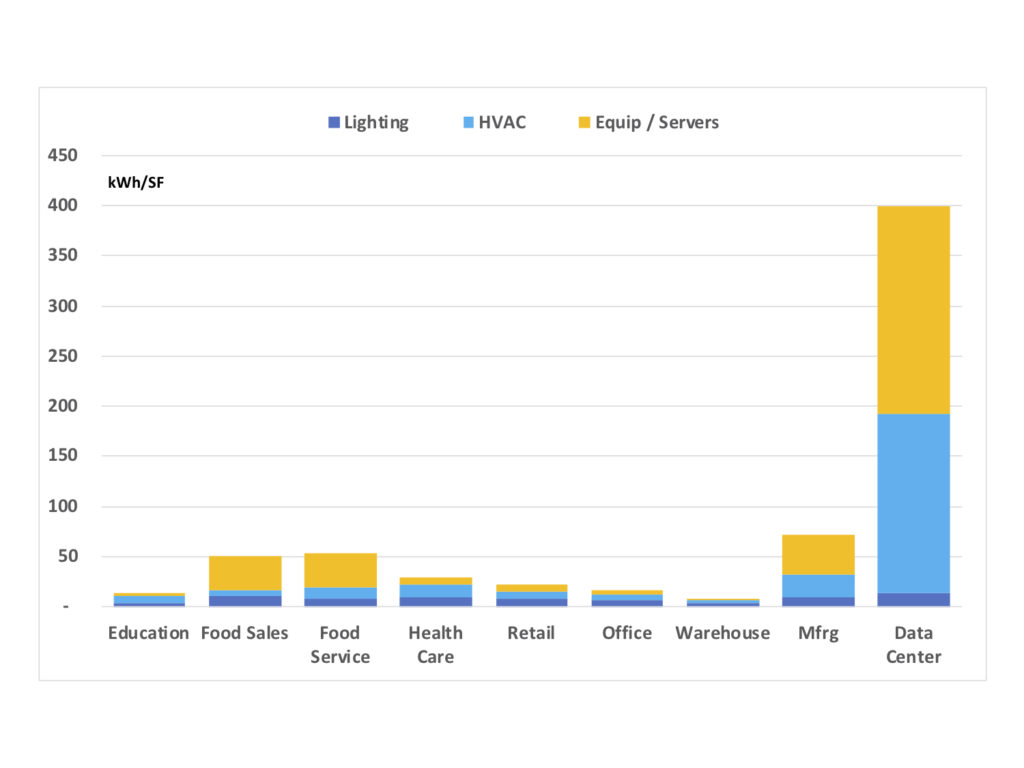
Source: US DOE EIA, Green Econometrics research
Data centers operate at roughly 50W/per square foot running 24/7 equates to approximately 430 kWh/SF. In comparison to the average commercial building, it consumes several orders of magnitude more energy. Most of the energy goes into cooling the chips and servers to operate the facility. What emerges is an important cycle as data is inextricably linked to energy.
Analytics, Machine Learning and Artificial Intelligence
There are two basic approaches to developing machine learning models: supervised and unsupervised. Supervised learning uses data labels to infer patterns that map data inputs to predicted outcomes. In unsupervised machine learning no labels are applied to data inputs and algorithms seek to discover patterns and structure within the data itself.
Data Blending
Significant insight is gained through understanding the relationships among variables or inputs. The ability to aggregate diverse and various datasets is core to creating analytics capabilities. Therefore, network infrastructure that is able to ingest big data as well as instantly scale volume is crucial to implementing analytics and machine learning capabilities. While scale, elasticity and the blending of disparate data sources are prerequisites for analytics and machine learning, also important are data transformation functionality from ETL to the integration of APIs to broaden the data extraction process.
Context and Perspective
Context deals with making the data meaningful. Context provides the framework through which one can examine the data and quickly grasp the significance. Perspective provides the view. In this manner, perspective provides the dimensional understanding or relationship pertaining to size, proportionality and magnitude. Think of perspective as a reference to illustrate importance relative to size. For example, it is easier to gauge the size of an object in a photo if it is displayed with a known reference such as holding the object in someone’s hand or a person standing next to the object.
Uncertainty
Most statistical models deal with levels of uncertainty. Reducing uncertainty improves confidence in the model. Often samples are used to extrapolate potential outcomes based on the findings of the sample. As described by Douglas Hubbard in his book, How to Measure Anything – Finding the Value of Intangibles in Business, when uncertainty is large, a small sample can dramatically reduce uncertainty. On the other hand, if greater precision is required to narrow the range of estimates, then a large sample size is needed. With big data, better capturing all relevant data, minimizes the need for statistical extrapolation because you’re measuring the entire population.
Figure 8 Uncertainty and Confidence
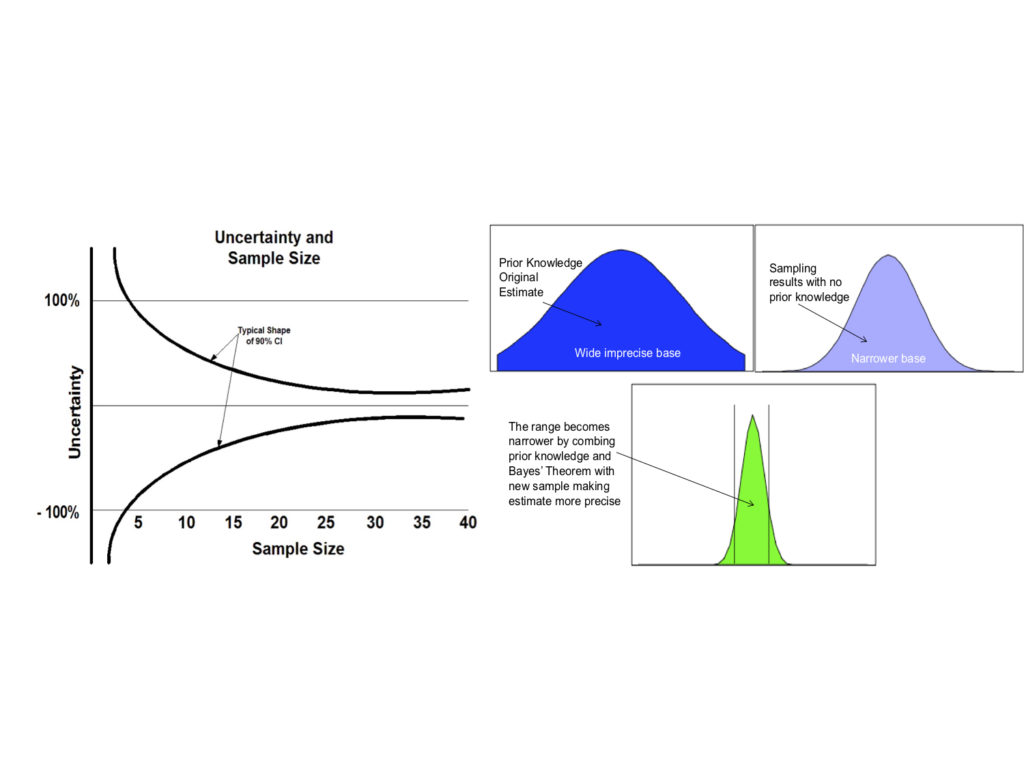
Source: How to Measure Anything, Douglas Hubbard
In addition, statistical models are being incorporated into analytics software and platforms. For example, Bayes Theorem allows us to improve confidence by referencing prior estimates to narrow dispersion of outcomes. The Bayesian approach improves the performance of small sample sizes enabling a more cost-effective approach to statistical modeling and a higher level of confidence.
Precision and Accuracy
While sample size reduces uncertainty, clear attention to errors is important particularly when precision is required In statistical analysis, errors are classified as Type I errors where a result is interpreted as True, when in fact it is False. That is called a False Positive. When a statistical model is created the confidence interval (CI) is established to accept a certain level of wrong interpretations. A 95 percent CI suggests 5% of the responses could be wrong. A Type 2 II Error is a false negative such as a person with COVID-19 and testing negative for the infection.
The question is the costs and tradeoffs between false positives and false negatives. Precision and accuracy as well as other measures to rate the statistical mode.
Analytic Platforms and Off the Shelf Algorithms
There are numerous off the shelf algorithms that can be applied to managing analytics and machine learning approaches. In essence, there are three widely applied statistical models used to gain insight from data: Classification – Regression – Clustering These algorithms are modules that can be packaged and oriented towards optimization of process and resource allocation.
Leading players include DataRobot and RapidMiner that provide an array of visual and machine learning algorithms. There are three steps in creating a machine learning model including the Training sample, Validation set, and Test set. Algorithms need to retain explanatory structure as new data is introduced and is referred to a Generalized model. A valid model must generalize beyond training data. In other words, assuring that the statistical model can be applied to the real world, not just the training data. Failure to generalize can result from overfitting the model meaning the model works great with training data but no valid application in the real world. Factors such as noise, extraneous data with no meaningful insight and model complexity, adding algorithms that make the model work with training data, but limit its functionality.
Ensemble Learning and Random Forest
Ensemble learning employs multiple algorithms or models to optimize predictive performance. Random Forests employ classification algorithms, such as Decision Trees, to variables with non-linear relationships Some approaches include: the use of averaging of several algorithms or models to reduce noise and increase prediction performance.
Combine predictions from a collection of models
- Aggregation of heterogeneous algorithms using different algorithms or
- Aggregation of homogenous algorithms using different training sets
There are limitations to ensemble and random forest approaches such as lack of visibility into models. Corrective measures including using hyperparameters to tune the model for accuracy, classification by majority vote and oversampling by increasing the proportion of target variables in the training set help to improve model performance.
Feedback Optimization
Increasing access to data in a timely manner can drive performance through the use of feedback loops. The feedback process sets the stage to establish the approach to meeting the business objective. Crucial the analytics and machine learning process is to define the objective to achieve or problem to solve such as generating more revenue or reducing costs and resources. With the objectives defined, priorities such as resource constraints, line of business requirements as well as risk tolerance and actions to take, need to be established to manage the analytics process.
Cloud Analytics and Digital Transformation Performance Metrics
There are also important performance metrics that Wall Street uses to gauge financial performance related to cloud services. Among these metrics are:
Net Retention Rate (NRR) or Net Revenue Retention Rate which measures expansion of existing customer usage, also a similar metric Net Expansion Rate (NER) measures existing customer expansion;
Remaining Performance Obligation (RPO) combines deferred revenues, that is revenue received but not recognized under Generally Accepted Accounting Procedures (GAAP) plus backlog which suggests additional revenues are booked but services not completed;
Annual Recurring Revenues (ARR) which is applicable to companies transitioning to subscription-based business models
Actionable Insight the larger the array of available data provides confidence in extracting the right intel. Large data sets provide insight into relationships with greater confidence than regression models that infer correlation among variables.
Sector Theme Cloud Analytics
Snowflake (SNOW) May 25, 2021
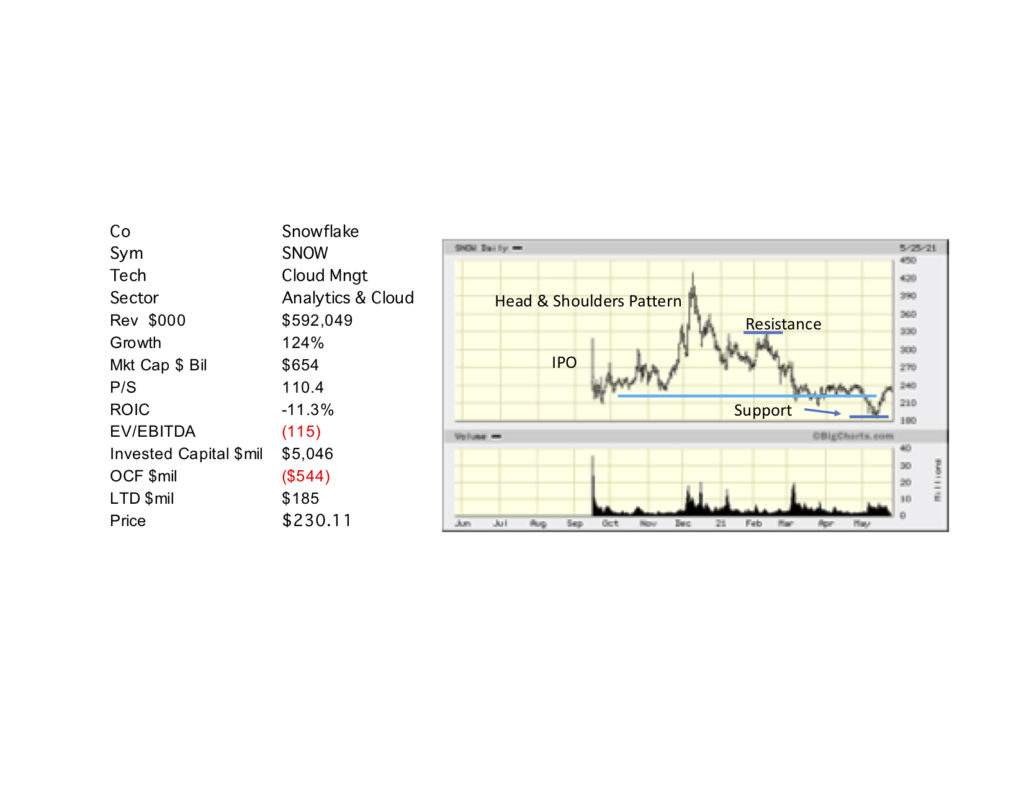
Snowflake
Snowflake provides a cloud data platform that enables elastic scalability of data storage, computing, and dedicated cloud services. The key capability is the cloud platform simplifies data access including extraction transformation and loading along with the capability of consolidating disparate data silos into a single access point to translate data into actionable insight.
Investment Thesis
Snowflake democratizes the cloud through simplifying management and reducing costs. Snowflake Inc. provides a cloud-based data platform that simplifies data management in the US and globally. The company’s platform offers Data Cloud, an ecosystem that enables customers to consolidate data into a single source of truth to drive meaningful business insights, build data-driven applications, and share data. The Snowflake platform is cost effective and is used by various organizations of all sizes across many industries. Snowflake trades at a high valuation of 110x on a price-to-sales ratio with revenue growth projected at 124%.
KEY INVESTMENT POINTS
- Democratizes the cloud by reducing costs and network complexity
- Leverage scale and elasticity of cloud data architecture
- Simplifies data access, extraction, transformation
- Dramatically lowers operating cost and complexity of data cloud architecture
- Reduces complexity of data engineering, data science and business intelligence analytics
- Enables the provisioning of new and varied data applications
- Leading technology that leverages data cloud architecture to consolidate separate data repositories
- Accelerates the migration to digital transformation
- Key industry drivers
- Data volume, velocity, and variation
- Drive to gain actionable insight
- Transforms digital data into valuable assets
- High growth company with inimitable technology
Sector Theme Cloud Analytics
Cloudflare (NET) May 25, 2021
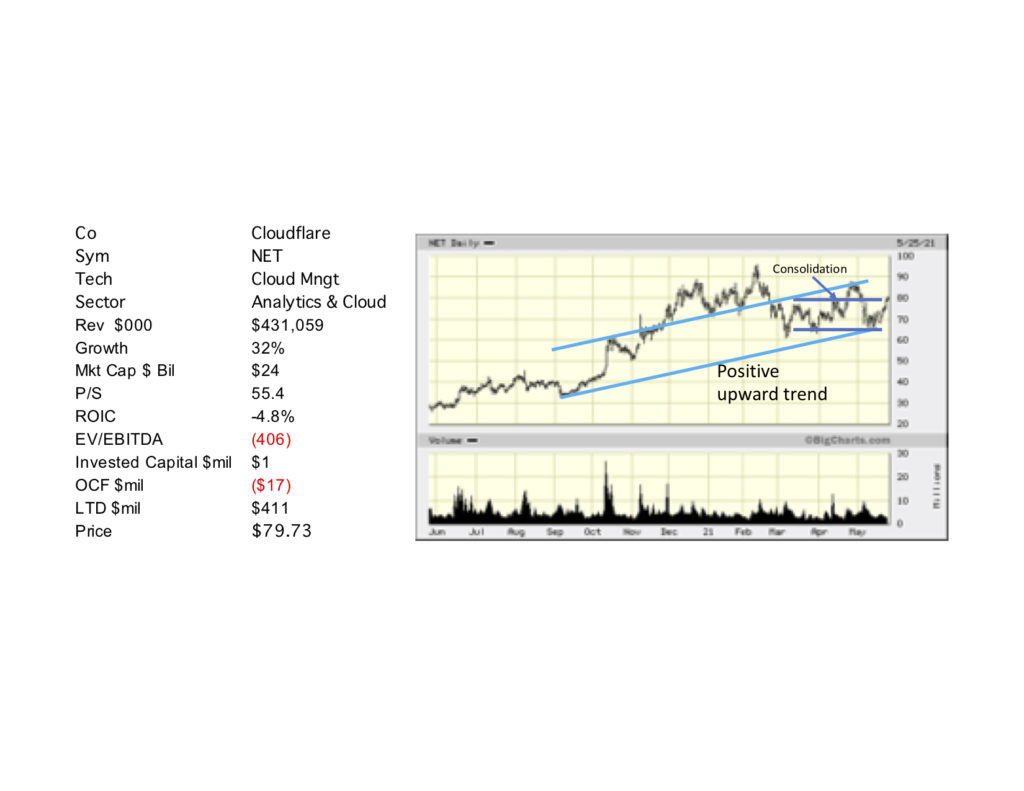
Cloudflare
Cloudflare provides a cloud platform with a unified control plane for apps and analytics processing. Key feature is security with 100 millisecond response time to manage reliability and scalability. Cloudflare offers cloud platform services for code prioritization and execution. Additional web services include network routing for traffic optimization and load balancing as well as firewall security consisting of intrusion detection and adverse threat prevention.
Investment Thesis
Cloudflare, Inc. operates a cloud platform that delivers a range of network services. The company provides an integrated cloud-based security solution to secure a range of data including public cloud, private cloud, on-premise, software-as-a-service applications, and Internet of Things (IoT) devices. The company also offers performance solutions, which include content delivery, intelligent routing, and mobile software development kit, as well as content, mobile, and image optimization solutions. Cloudflare provides service reliability including load balancing, virtual networking, and security services to enhances Internet experience and efficient network management
KEY INVESTMENT POINTS
- On premise to cloud architecture data management and security
- Unified control plane management
- 100 millisecond response time
- Code prioritization and traffic optimization
- Network routing, load balancing and firewall protection
- Strong revenue growth and expanding customer base
- Network security from intrusion detection and threat prevention to traffic optimization
- Key industry drivers
- Acceleration of premise to cloud data transition
- Ease of use for network management expands market adoption
- High growth company covering security, scale and performance enhancement
Sector Theme Cloud Analytics
Splunk (SPLK) May 26, 2021
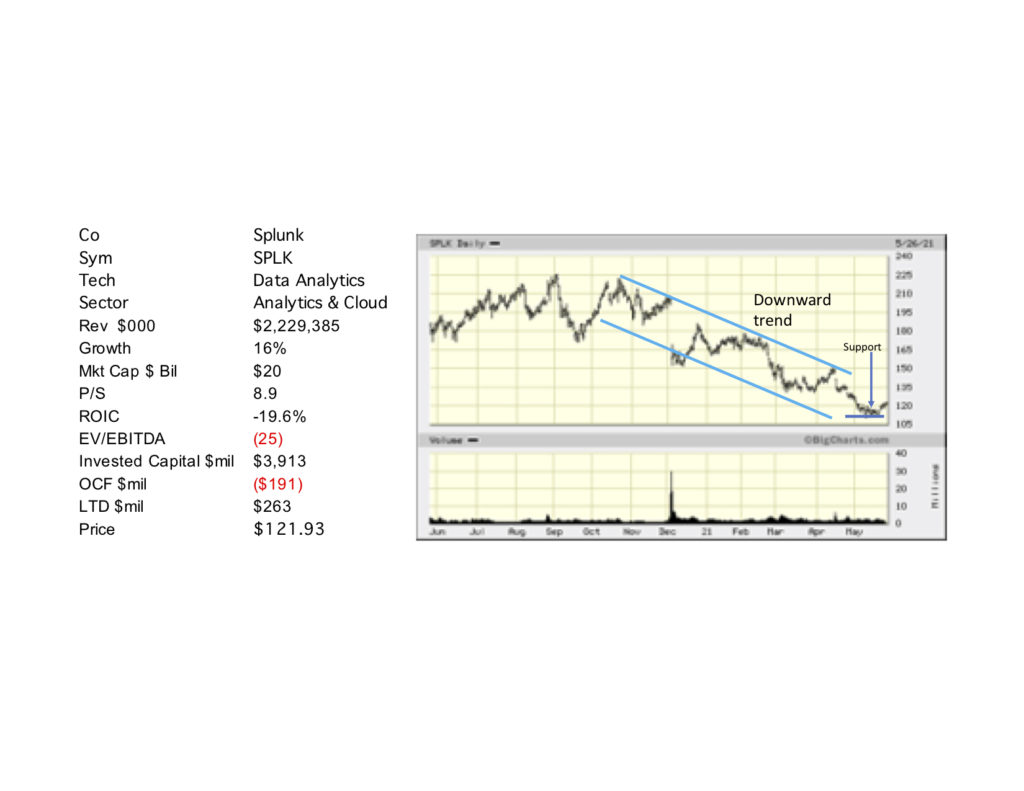
Splunk
Splunk Inc. provides software and cloud solutions that deliver insight from the data generated by systems and servers. The Splunk Platform collects real-time data across digital interactions including collection, streaming, indexing, search, and reporting. Splunk’s platform provides analytics using machine learning and performance monitoring from the enterprise and across the cloud. Performance monitoring provides real time detection and alerts from inputs such as IoT devices SCADA, mobile and IT infrastructure. Splunk Security solutions enable cybersecurity teams streamline the security operations workflow, accelerate threat detection and response, Splunk IT Solutions that provide visibility and control across cloud and on-premises environments.
Investment Thesis
Splunk has over $2 billion in annual revenues with gross margins of 77%. Operating margins while still negative are improving. Revenue growth is projected at 16% and trading at a price-to-sales ratio of 8.9x. Splunk provides granular detail into server logs and digital interaction with end users.
KEY INVESTMENT POINTS
- Cloud and enterprise performance monitoring and analytics
- Diverse array of data ingestion inputs
- Parsing and extraction of APIs
- Real time monitoring and testing
- Performance monitoring of cloud and enterprise infrastructure
- Network security from intrusion detection
- Key industry drivers
- Acceleration of digital transformation
- Established player with leading sales in market
- Expanding presence from enterprise to cloud environments
Sector Theme Cloud Analytics
Datadog (DDOG) May 26, 2021
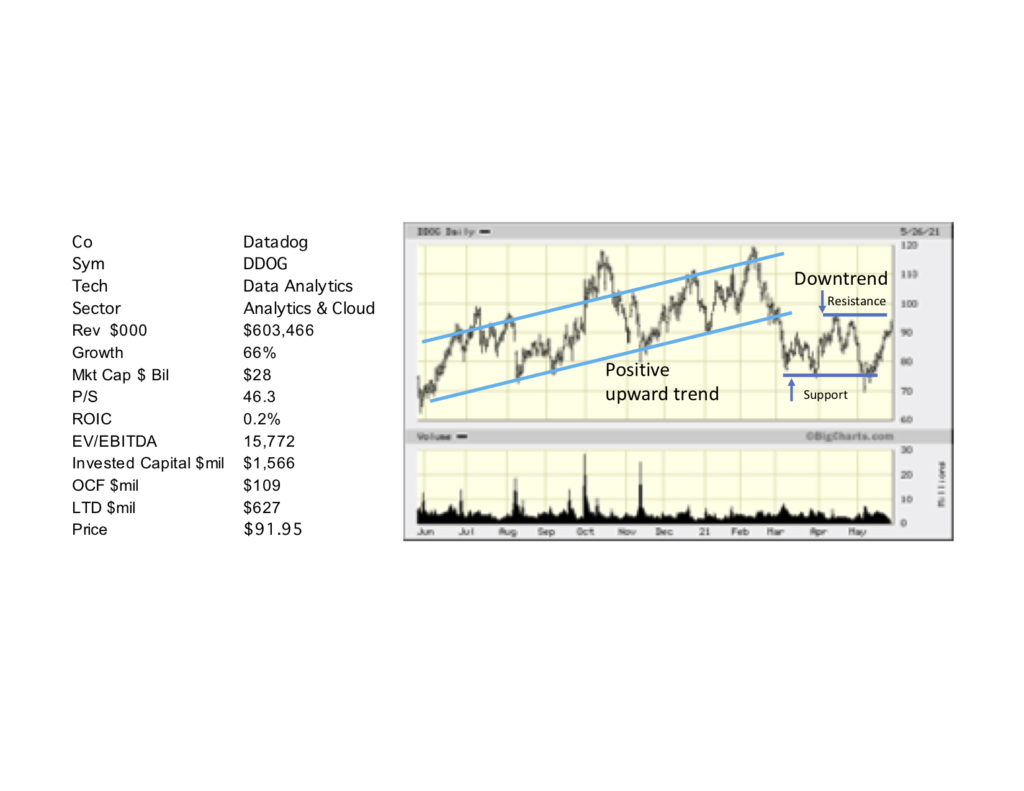
Datadog
Datadog, Inc. provides a cloud-based monitoring and analytics platform for developers, IT departments and business users. The company’s SaaS platform integrates and automates infrastructure monitoring, application performance monitoring, log management, and security. Datadog’s SaaS platform provides visibility into the customer user experience as well as network and infrastructure performance monitoring.
Investment Thesis
Datadog provides a SaaS platform for cloud performance monitoring and analytics to enhance developers, IT staff and business users better understand system performance across the cloud. Datadog has projected revenue growth of 66% and positive operating cash flows. Valuation is at a price-to-sales ratio of 46.
KEY INVESTMENT POINTS
- Real time visibility into infrastructure performance
- Unified and collaborative monitoring of application performance metrics
- Security and detailed log management analytics
- Cloud performance analysis for developers, IT operators and business users
- Integrates diverse data inputs and automates processes to reduce time and complexity
- Strong revenues and leading revenue growth player
- Key industry drivers
- Comprehensive solution for digital transformation
- Real time detail into application performance
- Detailed performance monitoring of IT and cloud infrastructure
- High growth company with inimitable technology
Sector Theme Cloud Analytics
C3.ai (SAI) May 26, 2021
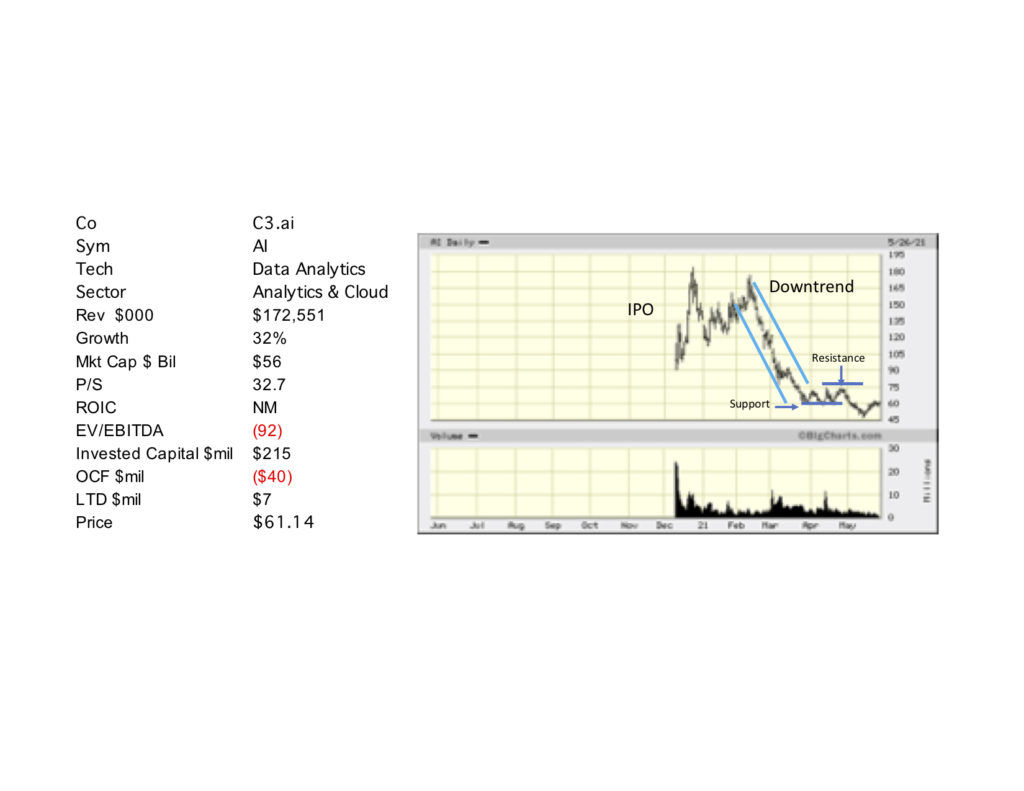
C3.ai
C3.ai, Inc. provides a model-driven cloud architecture for analytics and cloud microservices. C3.ai operates as a software company providing enterprise level artificial intelligence applications to vertical markets C3.ai offers SaaS applications for businesses for both app development from their platform and turnkey applications by industry. Its software solutions include: inventory optimization, CRM, supply chain management, predictive maintenance, product scheduling, energy management, IoT, among other apps.
Investment Thesis
C3.ai has developed a unique model-driven cloud architecture that enables cloud microservices, API syntax mapping to streamline data extraction as well as ETL pipeline management to better manage data access and control. The platform is designed to simplify coding, data management and machine learning. In essence it is a data integration platform for processing machine learning. C3.ai is led by Thomas Siebel, founder of Siebel Systems, with an excellent track record and founder of C3.ai. C3.ai trades at a valuation of 32.7x on a price-to-sales ratio with revenue growth projected at 32%.
KEY INVESTMENT POINTS
- Model-driven cloud architecture to enable cloud microservices
- Simplified coding, API data access, extraction,
- Integrates with leading software applications for data blending
- Microservices are targeted towards specific vertical markets and general business processes
- Combines data access, coding, machine learning and service management
- Initiated the AI Institute for developing and sharing best practice for analytics
- 10 years of product development and impressive management team
- Depth of learning includes 622 million sensor inputs and 48 million modules.
- Key industry drivers
- Leveraging data to optimize business objectives
- ML algorithms drive actionable insight
- Transforms digital data into valuable assets
- Large depth of industry specific data and ML algorithms
Sector Theme Cloud Analytics
Palantir (PLTR) May 26, 2021
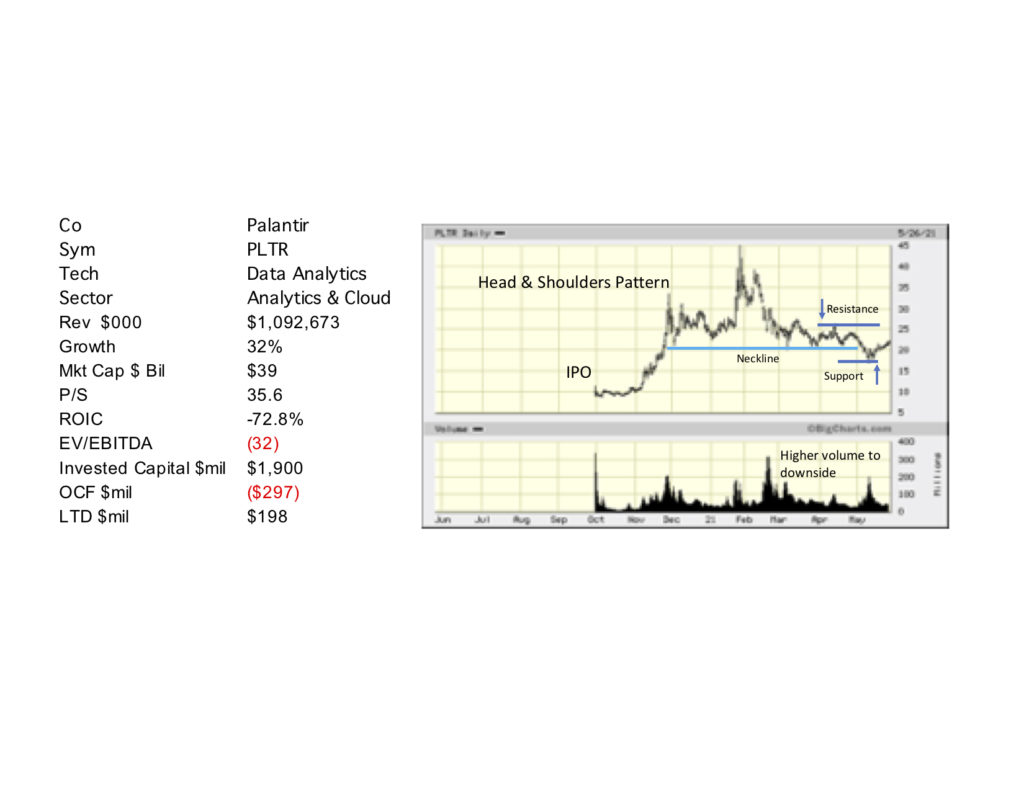
Palantir
Palantir Technologies Inc. offers Palantir Gotham, a software platform for the defense and intelligence community in the US. Using diverse and extensive datasets Palantir also provides commercial systems enabling users to detect and identify patterns hidden deep within datasets, helping operators plan and execute real-world responses to threats that have been identified within the platform.
Investment Thesis
Palantir has gained acumen with defense and intelligence market applications and large datasets. Palantir trades at a valuation of 35.6x on a price-to-sales ratio with revenue growth projected at 32%.
KEY INVESTMENT POINTS
- Model-driven cloud architecture to enable cloud microservices
- Simplifies coding, API data access, extraction,
- Integrates with leading software applications for data blending
- Microservices are targeted towards specific vertical markets and general business processes
- Combines data access, coding, machine learning and service management
- Initiated the AI Institute for developing and sharing best practice for analytics
- 10 years of product development and impressive management team
- Depth of learning includes 622 million sensor inputs and 48 million modules.
- Key industry drivers
- Leveraging data to optimize business objectives
- ML algorithms drive actionable insight
- Transforms digital data into valuable assets
- Large depth of industry specific data and ML algorithms
Sector Theme Cloud Analytics
Alteryx (AYX) May 26, 2021
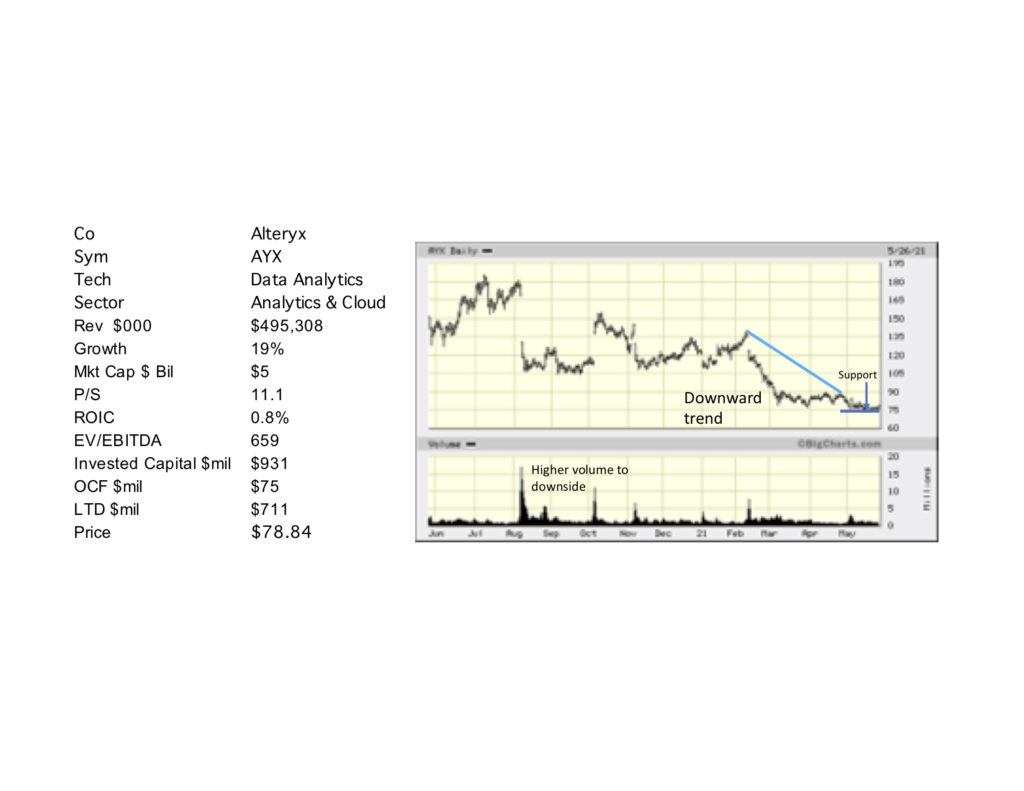
Alteryx
Alteryx, Inc. provides an analytics process automation platform for business analysts and data scientists globally. The Alteryx analytics platform consists of data access, preparation, and blending to create visual workflows or analytic processes. Alteryx also provides a server-based product for scheduling, sharing, and managing analytics applications. In addition, Alteryx offers collaborative data exploration and sharing recommendations across the enterprise; and analytics modeling apps to manage, monitor, and deploy predictive algorithms.
Investment Thesis
Alteryx provides a simplified analytics platform that automates the analytics process including access, aggregation and blending of data assets. The data engineering capabilities and automated analytics process platform acts to simplify data acquisition and actionable insight from the data. Alteryx trades at a valuation of 11x on a price-to-sales ratio with revenue growth projected at 19%.
KEY INVESTMENT POINTS
- Automating the analytics process with data access, cataloging and reporting
- Diverse array of data access connection
- Automated data prepping and blending
- Minimal coding expands use cases
- Reporting around business intelligence
- Comprehensive platform to prepare, catalog, analyze and predict data analytics
- Key industry drivers
- Platform automates the data analytics process from data access to analysis
- Simplifying data access, aggregation, blending and reporting
- Platform offers data access to apps, bots, (digital and Robotic Process Automation), cloud and enterprise files
Mega Trends Thematic Research and Analysis
As digital transformation grows, underlying technology platforms become a core differentiator for key players. The current market leaders need to identify and embrace important new technologies and adapt to the continuous emergence of new innovative platforms — often through M&A activities. Two overarching themes, data and energy, inform our approach; and our core premise in innovative technology analysis is that as more commerce commences over digital platforms, more energy is consumed and more data is generated. Importantly, there is also a confluence of interactivity between classes of technology that results in cross dependencies, correlation, cross pollination and scale that creates nuances within each segment. It is our exchange of data and analysis between segments that adds the insight required for confident decision making.
These are some of the sectoral trends fueling the new digital economy and the innovative technology companies creating value in our research. Let’s break it down by sector:
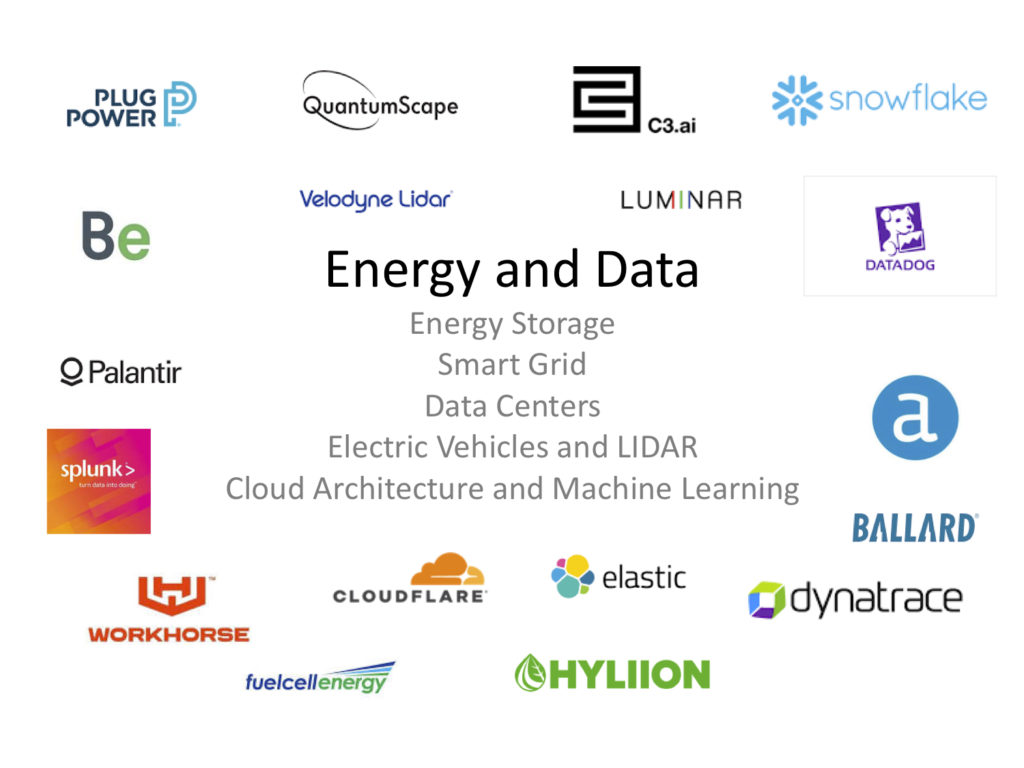
? Energy Storage – is the key differentiator for EVs and plays a vital role in energy efficiency and resiliency. Energy storage is an extremely important technology to address energy efficiency, carbon emissions, grid resiliency, and EV charging solutions. Energy storage systems have substantial benefits for energy consumers, including: industrial, commercial, public, and households. From cost reduction to business continuity and equipment protection, proper energy management delivers significant business efficiencies. There are, however, associated high switching costs for energy storage to be considered. Our focus in the following in-depth report includes Plug Power (PLUG), Ballard (BLDP), FuelCell (FCEL), Bloom Energy (BE) and QuantumScape (QS
? Cloud Architecture provides very cost-effective means of providing separate layers of data storage, computing and transactional services where reliability, scalability and availability are critical. Virtualization services enable separation of hardware and software as well as separating data from control planes. Innovative tools including Databricks and recent IPO Snowflake provide scale and data integration to manage cloud services and data analytics. Our focus in this niche includes Alteryx (AYX), Datadog (DDOG) Palantir (PLTR) Splunk (SPLK) C3.ai (AI) and Snowflake (SNOW).
? Autonomous Driving (AD) and LIDAR – are also key differentiators for EVs and play vital roles in extending the definition of personal mobility and enhancing the acceptance and comfort of employing autonomous driving and remote unmanned vehicles. Our focus includes Luminar (LAZR) and Velodyne (VLDR).
? Big Data – growth in digital and data captured from mobile devices is accelerating the volume, velocity and variety of available data. From server log files to sensor devices, growth will continue at pace as more commerce moves online. Snowflake (SNOW) democratizes data access, and provides scale and cloud management that enable broader access and lower costs. Datadog (DDOG) and Splunk (SPLK) provide applications for cloud service performance monitoring.
? Analytics and Machine Learning – with numerous approaches to statistical analysis and machine learning algorithms proliferating, coupled with advances in graphical processing units (GPUs) from Nvidia (NVDA) and AMD (AMD), the added computational power necessary to generate faster time to insight and navigate uncertainty is now available to most enterprises. Alteryx provides data integration tools to extract and transform data for machine learning. DataRobot and RapidMiner provide visual and machine learning algorithms to gain data insight. What will be interesting is how Palantir (PLTR) and C3.ai (AI) play as Snowflake (SNOW) democratizes further big data access, scale and cloud management.
? Digital Transformation– tools and applications that provide a scalable platform to coordinate onboarding and service delivery provide the next generation of financial services, shopping, engagement, learning, social and work processes for the digital transformation. Our focus includes Zoom (ZM), Twilio (TWLO) Shopify (SHOP) Okta(OKTA) Square (SQ) and Slack (WORK) pending acquisition by Salesforce (CRM).
? 5G Cellular Networks – As 5G network infrastructure is deployed, bandwidth capacity could improve by 20-fold. Some discussion indicates an 80-fold increase in bandwidth to carry various data sources. Software Defined Network (SDN) and Cloud Radio Access Networks (C-RAN) offer the promise of virtualized end-to-end services to address multiple vertical market applications. Because of signal attenuation of ultra-high 5G bandwidth capacity, the network infrastructure requires greater density of urban base stations along with backhaul. Qualcomm (QCOM) and Skyworks (SWKS) provide 5G chips for mobile and baseband while Qorvo (QRVO) provides RF and base station equipment. Ciena (CIEN) provides bandwidth scale with fiber optics for data backhaul have developed innovative voice and data network infrastructure approaches.
? IoT (Internet of Things) sensors – granular visibility into performance and conditions of assets, equipment and processes provide an explosive growth in the data collection and analysis space. IoT devices provide near real time details on energy, environmental and workflow processes. Senseware offers an array of energy and environmental monitoring sensors and a network communications system for IoT sensors while Monnit has developed a broad line of analog sensors.
? Cybersecurity – as commerce moves towards digital transactions, vulnerabilities must be managed. The proliferation of connected devices driven by cloud computing and workforce mobility is growing rapidly with projections by Cisco Systems (CSCO) predicting the number of connected Internet devices will grow from 18 billion in 2017 to 28 billion by 2022, suggesting more focus on endpoints and edge computing. Leading cybersecurity players such as FireEye (FEYE) are involved in the detection and prevention of major cyberattack and CrowdStrike (CRWD) in leveraging high fidelity endpoint device data to the cloud to scale analytics.
Summary
Our approach illustrated the transformative capabilities of how data and energy provide the foundation of digital transformation, this article will focus innovative technology companies that are leveraging technology to grow new markets, lower costs, and differentiate their products and services. In addition, the lens through which we analyzed public companies focused on key metrics including return on invested capital (ROIC), price to sales (P/S) ratio, invested capital, operating cash flows. (OCF), and sales growth. Our disruptive emphasis employed price/performance metrics to evaluate the magnitude of disruptive innovation. These metrics help to assess how industry dynamics change in response to the introduction of new technologies.
Green Econometrics Analytics Process Framework
Business processes are designed to link logical relationships of activities to create value. Building culture around analytics processes for innovation, workflow scale and automation of high margin business activities adds value. The analytics process roadmap uses machine learning algorithms to optimize performance to meet specifically defined business objectives. The combination of granular visibility into business process operations and performance metrics, machine learning and statistical algorithms will improve performance, and provide a feedback mechanism that enables navigation on a path to optimize key results.
A properly designed analytics process is a blueprint that employs a dynamic approach focusing on key metrics from which remotely monitored data is measured and cataloged in a format that provides insight as well as the ability to benchmark progress towards goals and objectives. The analytics process roadmap offers a visual framework to access data, measure performance, and guide the decision process with data-driven insight. The key is enabling a feedback mechanism with corrective approaches to deliver the desired outcome and business objectives as well as the analytics process culture to engage and empower employees.
These capabilities will expand market opportunities and enable efficient operating procedures to address these markets along with the agility to apply resources based on business objectives and expected outcomes. Learn more about how a data analytics culture can impact your business.
Green Econometrics provides research and consulting services regarding data analytics. Green Econometrics’ analytics approach is to identify and define relevant metrics that are aligned to business objectives, measure and benchmark performance, while optimizing outcomes based on machine learning algorithms. We help to benchmark performance with respect to business value creation such as process improvement and operating efficiencies. Part of the business strategy analytics framework may include sustainability metrics regarding environmental conditions such as quantifiable ESG metrics including Net Zero, indoor air quality and energy efficiency. Sustainability, operating conditions and performance are all in our wheelhouse.
Michael S. Davies, CFA, CMVP is a data science and business intelligence professional who specializes in helping businesses optimize efficiencies and productivity through analytics. He is the founder of Green Econometrics.
LinkedIn: https://www.linkedin.com/in/greenecon/
Green Econometrics: https://www.greeneconometrics.com
Related Posts