How vulnerable are we to energy shocks?
The second category 5 hurricane to hit Caribbean in two weeks leaves uncertainty in the energy market as oil prices head higher. While it is hard to draw the direct correlation between global warming and hurricanes strength, the fact is the oil production in the Gulf of Mexico accounts for 32% of our total oil production. In addition, the Gulf of Mexico is one the most productive oil and gas region as the U.S. faces declining petroleum product production despite significant increase in the number of oilrigs. The increasing likelihood of a weather related energy supply disruptions particularly from the Gulf area could dramatically increases to energy prices similar to Hurricane Katrina’s impact in 2005.
Higher oil prices have driven demand for energy exploration and investment into oil and gas drilling rigs. Since 1999, the number of drilling rigs has increased 112%. In the U.S., rig count is up 181% with 1,749 rigs in operation in 2007 from 622 in 1999 according to Baker Hughes. Worldwide Rig Count
According to RigZone there are 278 offshore drilling rigs in the Gulf of Mexico RigZone
Figure 1 Worldwide Rig Count
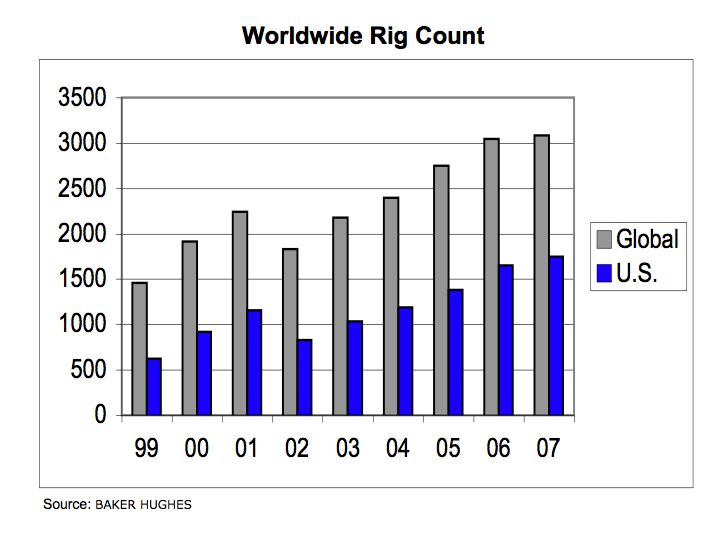
Figure 1 provides the rig count for the U.S. and the world. The U.S. accounts for over half the world oil drilling rigs yet our production is less than 10% of total global production. The Gulf of Mexico with 278 drilling rigs produces 32% of our oil with only 16% of the rigs. Hurricane Impacts on the U.S. Oil and Natural Gas Markets The rigs in the Gulf of Mexico are more productive and therefore any weather related disruption in the Gulf leaves us more vulnerable to energy shocks.
Figure 2 US Rig Count and Oil Production
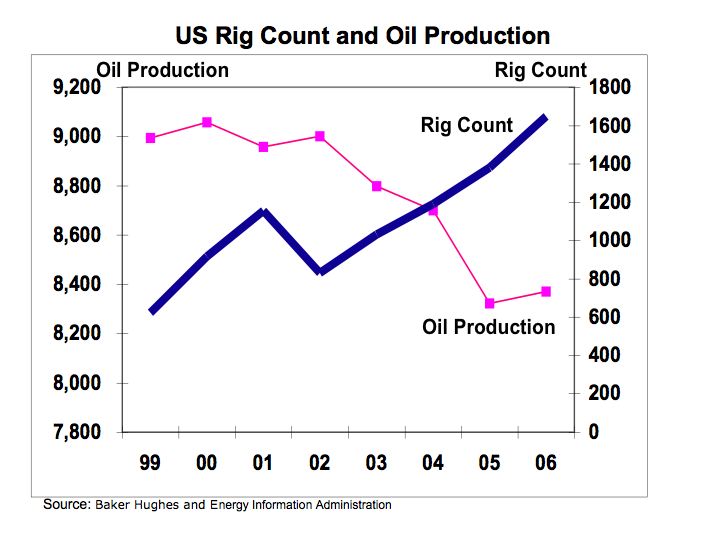
While the U.S. rig count is up 118% from 1999, petroleum production is actually down 7%. On a global basis, oil and petroleum product production increased 13% since 1999 and this includes a 60% increase in the number of drilling rigs excluding the U.S. The bottom line is the U.S. and the rest of the world is experience diminishing returns on investments in oil production.
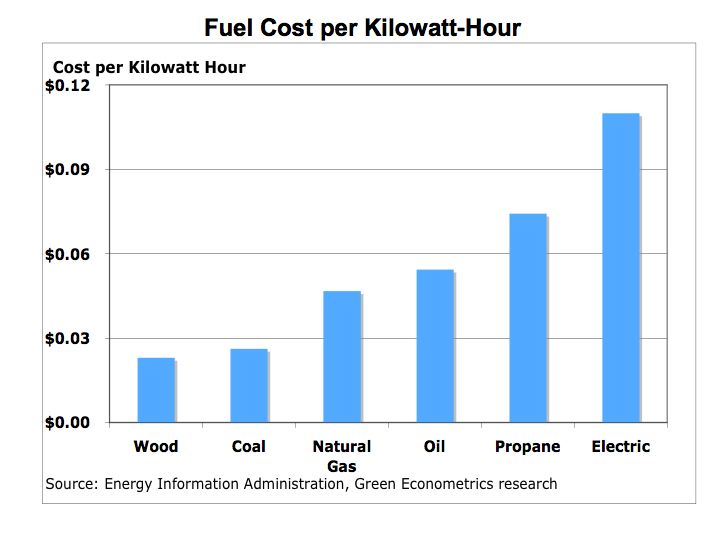
With diminishing returns on investment into oil, would it not be better to invest into alternative energy such as solar or wind. The truth is the cost of solar and wind are still dramatically higher than hydrocarbon fuels. The cost of solar on a kilowatt-hour (KWH) basis is approximately $0.38 per KWH in comparison to oil at $0.05 per KWH.
Figure 3 Cost per Kilowatt-Hours
Initiatives such as the trading of carbon credits leave little economic incentive to invest into alternative energy. A survey last year by TreeHugger found carbon credits trading for $5.50 to $13 per metric ton of carbon dioxide. Survey of Carbon offsets A metric ton of carbon dioxide equates to about 110 gallons of gasoline and at these prices, the carbon emission amounts to about $0.05-to-$0.12 to a gallon of gasoline. The carbon penalty does not even come close to bringing solar or wind energy on the same playing filed with hydrocarbon fuels. The Carbonfund organization offers a means to offset your carbon emissions with tax-deductible contributions
The cost of carbon emissions is not reflected in the market for energy. In addition, the market is unable to establish a fair price for carbon because there is no market force used to establish the value of carbon credits. We need a mechanism to bring solar energy at par with hydrocarbon fuels to limit our vulnerability to energy shocks and supply disruptions.
Related Posts