Archives 2020

Why Data Analytics Process Blueprints Mitigate Productivity J-Curve and Create Value

Analytics platforms transform technology adoption

Engendering a data analytics framework culture to optimize process innovation will lead to improving productivity. The adoption of new technologies is often challenging with lagging productivity gains. Investments into business processes contribute to faster adoption of new technologies and higher market valuations. For example, workflow processes provide a framework to better leverage new technologies by shortening the time to productivity gains. In addition, investments into business processes, intangible assets, contribute to higher equity valuations and are often reflected in growing levels of goodwill generated with technology company acquisitions.

As a core process we suggest a data analytics framework using feedback loops to optimize outcomes and deliver a better approach to leveraging technology adoption. This approach ensures that technology adoption strategies and implementations are based on data and driven by process optimization. In addition, employing an analytics roadmap to manage disruptive technology adoption with defined feedback loops set to optimize successful outcomes further improves value.

Technology and the Productivity J-Curve Paradox

As mega trends unfold; such as cloud architecture, 5G cellular, big data, IoT sensors along with machine learning, a successful structural framework for embracing these new technologies needs to embrace and address the disruption while engaging with processes that optimize desired outcomes. 

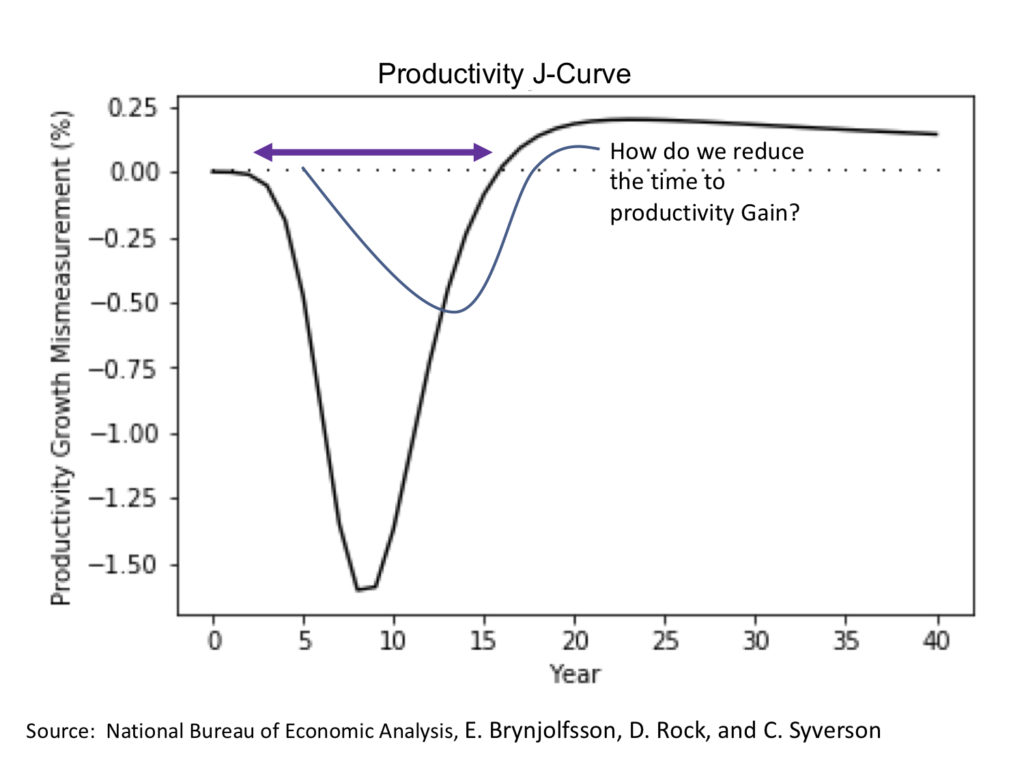
In 1987, Robert Solow, a Nobel Laureate and MIT professor, quibbled about the preponderance of computers and lack of productivity. So this is not a new issue. The economics of business process and the Productivity J-Curve concept was framed by Erik Brynjolfsson, Daniel Rock, and Chad Syverson – who examined the often slow and bumpy productivity gains arising from the adoption of new technologies. Their collective studies from the National Bureau of Economic Analysis offer a compelling rationale for developing business processes that enhance the adoption of innovative technologies. In essence, because training, experience curves, changes to business operations and services lag productivity gains. Their findings suggest “the more transformative the new technology, the more likely its productivity effects will initially be underestimated.” A recent article in The Economist, Reasons to be Cheerful, highlighted how education and training that speed the adoption of new innovation could raise productivity. 

Figure 1 Productivity J-Curve

Read More

Why Visual Data Analytics: Discovery, Innovation and Opportunities

A data analytics framework is applicable to insight discovery; provides a roadmap towards innovation; and enables capabilities that can optimize approaches to new business models and opportunities. The following paper provides examples revealing how and why to apply visual analytics for discovery, innovation and evaluating new opportunities. 

Discover how waveforms and patterns are applied to science and finance, and how customer usage patterns can reveal new approaches to market micro-segmentation and persona classifications.  Lastly we’ll reveal how the deployment of IoT devices across the enterprise fuels data flow in the physical world regarding the performance and conditions of business assets.

Introduction

Our theme is applying visual data analytics as a tool for discovery, innovation and evaluating market opportunities. We show how two metrics, price and volume, are able to convey insight and establish price targets for technical analysis. Why energy consumption patterns and waveforms lend themselves to understanding science and classifying human behavior.  How proxy metrics can serve as measures for physical events. Why linking granular visibility into processes and the monitoring of conditions and operating performance help build an advantage in the digital economy.  

Green Econometrics relies on visual analytics as a core fabric in our data analytics frameworks because visual analytics are integral to discovery, innovation and new opportunity development. Visual insights are easy to understand – allowing business objective and performance metrics to seamlessly transfer across business units. So how do we do it?

Read More

Why Composable and Agile Business Models Need Strategic Business Analytics

There are two overarching megatrends in today’s market: heightened uncertainty and the explosion of data as we migrate to the digital economy. In these circumstances, employing two crucial tactics in business strategy serves to create business value: 1) composability, the framework and interrelationships among component parts that can be reassembled to transform the business model; and, 2) business process agility, the ability to reconfigure resources and business processes for innovation and scale. Both of these tactics require highly granular visibility into business processes along with analytics to measure performance metrics aligned with business objectives. Given elevated levels of uncertainty around employee health and safety in the age of COVID, and the consequent economic and business uncertainty; a well thought out business strategy analytics framework provides a means of navigating uncertainty with greater confidence and lower risk exposure. To be successful in the face of volatility, the analytics framework employed must be structured to optimize outcomes that drive business value.

Disruption and Uncertainty

The pace of technological change and innovation is accelerating. Exogenous events unfold from numerous factors altering the competitive landscape that radically introduce new business models that in turn, redefine the means of competition. To gain a competitive advantage or even just maintain your advantage, new tools are required. These new tools such as cloud architecture, data engineering, secure data access, scale, analytics and machine learning, are integral in creating the capabilities required to remain competitive.

The rapid transition to the digital economy is only exacerbating uncertainty and the disruption to legacy business models. How can companies prepare and take advantage of new technologies to transform their business? For one, developing a business strategy analytics framework to navigate uncertainty and enhance your business model is a must. Essentially, a business strategy analytics framework is designed to measure performance metrics that are relevant to business objectives while optimizing the outcomes for success. One thing is clear, disruptive innovation and competitive landscape is changing fast, composability, agility and analytics are important.

Read More

3 Metrics to Guide Air Quality Health & Safety

What it Means to Your Business

Key Air Quality Metrics

This post explores how the use of three key air quality metrics can improve the health and safety of your business. Occupant health and safety are paramount in the current environment and sensors that detect harmful compounds can serve as front line of defense.  Given these uncertain times, efforts to reduce risks and improve environmental conditions, will help to better support employees and build customer trust.

Begin the process by establishing a goal such as sustainability or worker productivity.  From your goal or objective identify metrics that are aligned with the goal, and then measure your progress toward the goal. Deploying this process improvement framework will improve your business in measureable ways.  In this manner we are transforming metrics and data analytics into performance improvement aligned to desired outcomes including sustainability and energy efficiency. 

Our approach is to identify metrics aligned to your goals and objectives and provide an analytics framework to assess performance. This involves data curation, our proprietary data architecture and machine learning algorithm to provide context, perspective and visual insight.  Key is performance benchmarking for health, safety, sustainability and energy efficiency. These are core environmental metrics and process capabilities that will transform your business model.

To zero-in on important indoor air health metrics, cost effective sensors are required. Based on health and energy efficiency objectives, we found these core indoor environmental metrics, namely carbon compounds including: CO2 and methane, Volatile Organic Compounds (VOCs), and particles. In our previous post, Green Econometrics discussed Air Changes per Hour (ACH) as a measure of air filtration performance – how many times does the air in a room change in an hour?  In this manner, monitoring CO2 levels can serve as a proxy for determining acceptable ACHs.  It is more cost effective to monitor the number of room air changes per hour using air filtration than to deploy expensive sensors to detect pathogens and viruses.

Read More

Indoor Air Quality is Crucial for Safety and Productivity

The risks of viruses are now starkly apparent, and it’s only going to get worse with climate change according to researchers. This begs the question: How do we better protect building and office occupants from the risks of contagion? This post will explore how we can better prepare for future pandemics, reduce the risks of contagion, and navigate the uncertainty of these challenging times. 

The most important element in any interior air and environmental assay is accessing data regarding environmental conditions and operations within a defined space. Applying data analytics and machine learning algorithms can help create a comprehensive roadmap to improve operating efficiencies and understand conditions pertaining to emergent risks and exposure.

A process improvement framework is constructed by transforming data and analytics into metrics that are aligned to desired outcomes such as sustainability and energy efficiency. Green Econometrics has developed a framework to monitor, measure and curate data pertaining to process and sustainability performance.  This is extremely important.

Read More

Why Analytics and Business Intelligence

Analytics and Business Intelligence provide a framework for process improvement that drives operating efficiencies and enhances business value.  Most business owners and managers want to increase business value to benefit shareholders, stakeholders, and investors.  Individual investors and investment professionals direct capital towards companies that can demonstrate sustainable value.  Changes to performance in revenues, margins, and risks can become a catalyst to invest or divest. Business value is often measured by three performance criteria – revenues, operating margins, and risks.  Therefore, factors that contribute to revenue growth, margin expansion, and risk mitigation become the overarching goals to improve business value.  We add that sustainable value includes resource conservation and efficiency.

Just how does analytics and business intelligence address revenues, costs, and risks in improving business value?  To understand the integration of analytics and business intelligence in improving business value, let’s look at two initiatives in formulating business strategy. 

 In his book Measure What Matters, John Doer describes how establishing goals and objectives along with the corresponding performance criteria provide a better method to assure that key metrics are aligned to goals and business objectives. This process of mapping performance metrics to business objectives defined as Objectives and Key Results (OKRs) determine what is relevant to measure and track.  Adding to OKRs is the balanced scorecard approach which pulls reporting data from each business unit and department and explained by Robert Kaplan and David Norton in their Harvard Business Review article “Using the Balanced Scorecard as a Strategic Management System” to provide an assessment of conditions and performance.  

Read More

Analytics Framework for Sustainability

Why the analytics framework for process improvement can translate into substantial benefits around sustainability improvements and energy efficiency. The Coronavirus pandemic has upended social interaction – a new normal, with social distancing and protocols, and so why does sustainability play a crucial role in facilitating a smoother transition into the is new normal.  The reason is sustainability engenders confidence.  Knowing facilities are safe and that indoor air quality monitoring is vital for occupant health and safety builds confidence. Health and safety are also essential in generating the confidence that changes consumer behavior.  Therefore, the process by which you implement a sustainability plan plays an expanding role in orchestrating the activities that adhere to values and performance.

A sustainability framework provides the roadmap to monitor, measure and curate data thus enabling performance benchmarking of conditions and processes.  The analytics framework serves as a roadmap to utilize insight gained from data analysis.  Currently available tools such as data visual analysis, machine learning algorithms and cloud computing architecture enable cost effective approaches to achieve business and sustainability objectives.

A sustainability framework provides the foundation to drive business value across several dimensions and performance metrics.  The use of the sustainability process can drive business value, improve our environment, enhance customer loyalty, and better engage healthier and happier employees while rewarding shareholders and stakeholders with higher business valuations.

Read More