Insulation is one of the most important factors in improving building energy efficiency. Heating, ventilation and cooling (HVAC) often accounts for more than half the energy expense of a building. Insulation helps to improve the energy efficiency of heating and cooling. Depending on the selected insulating material, the economic impact on heating costs can be quite dramatic.
To understand how insulation helps improve building heating and cooling, it’s helpful to review the dynamics of building heat loss as it applies to building materials and outside actual air temperatures.
To calculate the heating requirements for a building, the overall heat loss from a building can be derived as a function of the combined heat loss of transmission through the roof, walls, windows, doors, and floors, as well as heat loss caused by ventilation and air infiltration. In general, without getting too scientific, the heat loss from transmission through roof, walls, doors, and windows represents the largest impact and is primarily a function of the temperature difference between the inside and outside air and thermal conductance of he building material. For a more detailed review of building heat loss see Heat Loss.
The difference between inside and outside temperature plays a critical role in building heat loss. The first step is to understand heating and cooling requirements from weather data. Heating degree day (HDD) are a measure of energy demand required to heat a building. HDD is derived from the difference between the daily outside temperature observations and the ideal indoor air temperature, say 65 degrees Fahrenheit (18.30 Celsius). The heating requirements for a building in a specific location can be derived from the HDD data in conjunction with building factors such as insulation, windows, solar heat gain, and use. Air conditioning also has a similar metric and is defined as cooling degree day (CDD) and measures the amount of energy used to cool a building.
From the historical data on outside air temperature, an average heating and cooling degree day can be assigned to a specific region. To calculate degree days for both heating and cooling Daily Temperatures can be assessed by zip code to capture historical data on specific climate zones.
When it comes to selecting building materials and insulation, material suppliers often supply two measures – the R-value and C-value. A material’s R-value (thermal resistance) is the measure of its resistance to heat flow. The C-value (thermal conductance) is the reciprocal of thermal resistance and measures the ability of a piece of material to transfer heat per unit time or more specifically, specifies the rate of energy loss through a piece of material.
The US Department of Energy (DOE) has provided revised R-value recommendations based on climate zones. To understand the energy impact of selecting the right R-value insulation material for your building, an on-line heating calculator will help illustrate the heating requirements and associated energy costs for different insulating materials. Building heating requirements are often expressed in BTU (British Thermal Units) per cubic foot.
The Heater Shop BTU Calculator Heating Calculator provides some useful insight into managing energy expenses. The calculations were based on an average of 25 HDD for New York City.
Figure 1 illustrates the heating requirements as measured by BTU per square foot of building space for corresponding insulating materials across ceiling heights from 10 to 40 feet to capture cubic feet. As seen from Figure 1, the heating requirements show significant variance depending on insulation assumptions.
Figure 1 BTUs per Square Foot 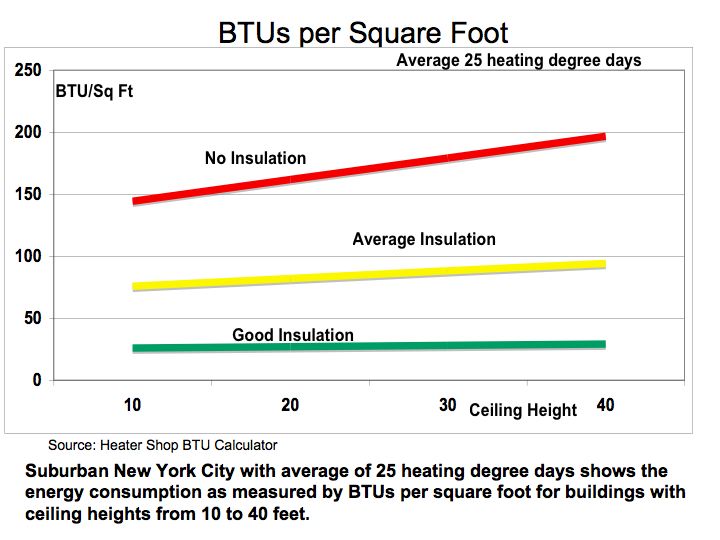
Source: Heater Shop BTU Calculator
Taking the building heating requirements one-step further, different insulating assumptions (no insulation, average, and good) translate into wide dispersion in operating costs. The on-line heating calculator was used to estimate the building heating requirements based on the following assumptions: 10,000 square foot facility with ceiling height of 10 feet for 25 HDD for no-insulation average insulation, and good insulation. To derive fuel costs, the BTU per square foot for each insulation category was applied to a heating system operating for five heating months with approximately 1,400 hour of operations to coincide with a gas furnace at 90% efficiency and 20-minute on-cycle and 30-minute off-cycle. Gas pricing for heating are based on $17.00 per million BTU.
Figure 2 Heating Energy Cost 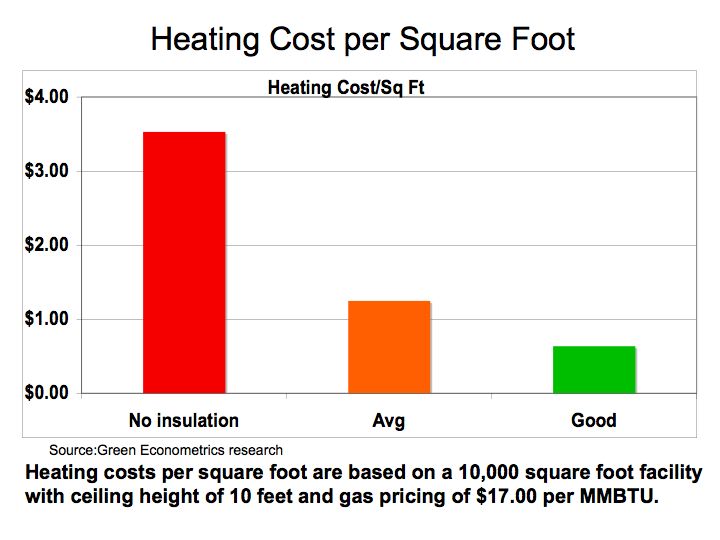
Source: Green Econometrics research
Figure 2 demonstrates that heating cost per square foot for good insulation saves approximately $2.90 per square foot in comparison to no-insulation at all. If we compare the heating costs savings to the cost of insulation, the payback period for insulation can be achieved in a year under most circumstances.
Figure 3 Insulation Cost 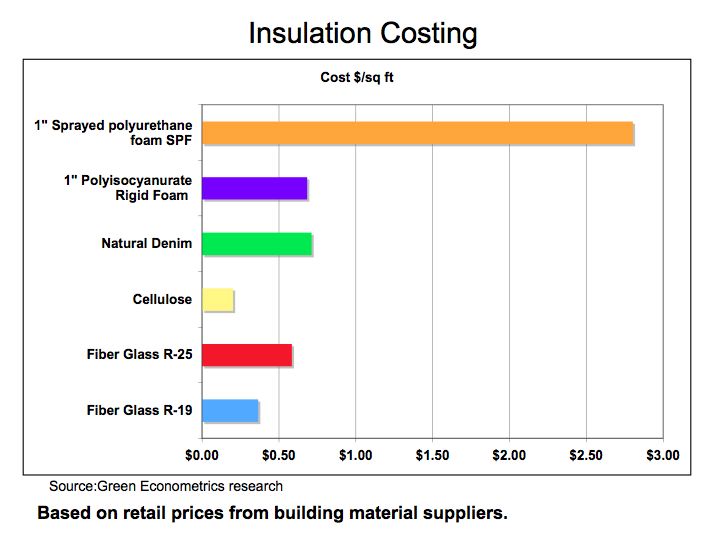
Source: Green Econometrics research
To assess the C-value and R-Value of various building materials, there are some useful charts available on the web. Insulation and Building Materials R-Values
The bottom line is that insulation is one of the most important building components materials to improve energy efficiency and lower utility costs.