The Possible Achilles’ Heel of EVs and Energy Storage

  • Battery technology is progressing slowly and advances in lithium-metal are not yet commercially available
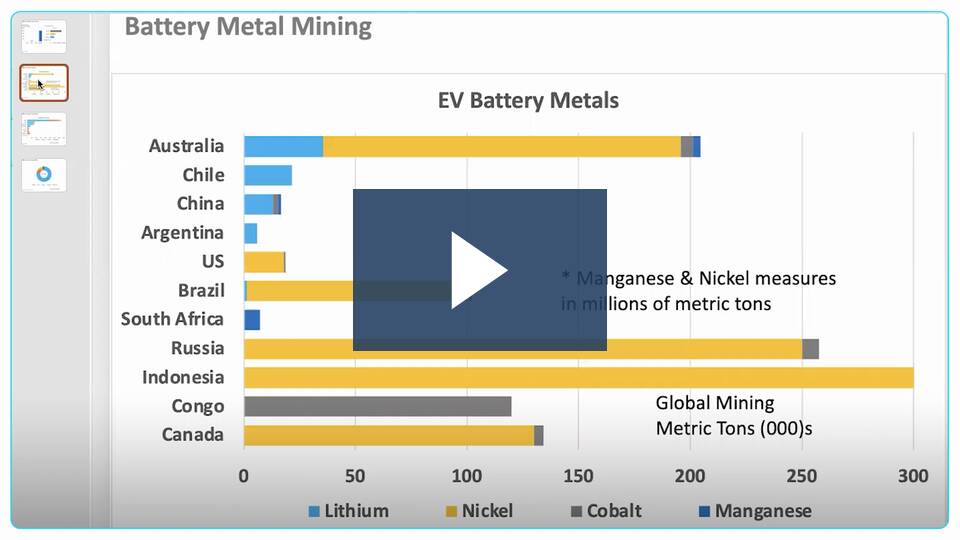
  • Federal EV battery incentives pertain to countries with US free trade agreements: Australia, Canada, and Chile
  • Battery supply is constrained by metal mining and production is limited by complex and costly process technologies
  • More research and product production methods are imminently needed

Battery production for electric vehicles should be a concern. For one, the US has neither the resources nor the production capacity to meet the demand of EV manufacturers. Second, as a national security concern, not having the requisite production infrastructure to support energy transformation leaves the US vulnerable to economic decline and energy price increases. Third, to navigate energy transformation it’s imperative to establish battery production for grid stability and resiliency, particularly when introducing renewable energies.

Currently, lithium-ion batteries are the core foundation for EVs and most vehicle manufacturers are planning to transition to all elective vehicles in the near future. California might ban the sale of new cars running only on gasoline by 2035. The issue is the production of EVs is inextricably linked to the availability of batteries that are limited by supply constraints in both battery metals and production capacity. Our focus is on battery supply chains and production.

Battery Supply Chains

The big issue around EV batteries is assuring an adequate supply of materials at a reasonable price.  To better understand the EV supply chain let’s look at the common raw materials namely metals and their associated costs. The four primary metals in a lithium-ion battery commonly used in most EVs are lithium, nickel, cobalt, and manganese. EV batteries use nickel-manganese-cobalt cathodes, with 60% nickel and 20% of cobalt and manganese.

The Possible Achilles’ Heel of EVs and Energy Storage – MarketScale

Energy Transformation Why EVs will Impact the Utility Grid

Energy Transformation: Why EVs will Impact the Utility Grid – MarketScale

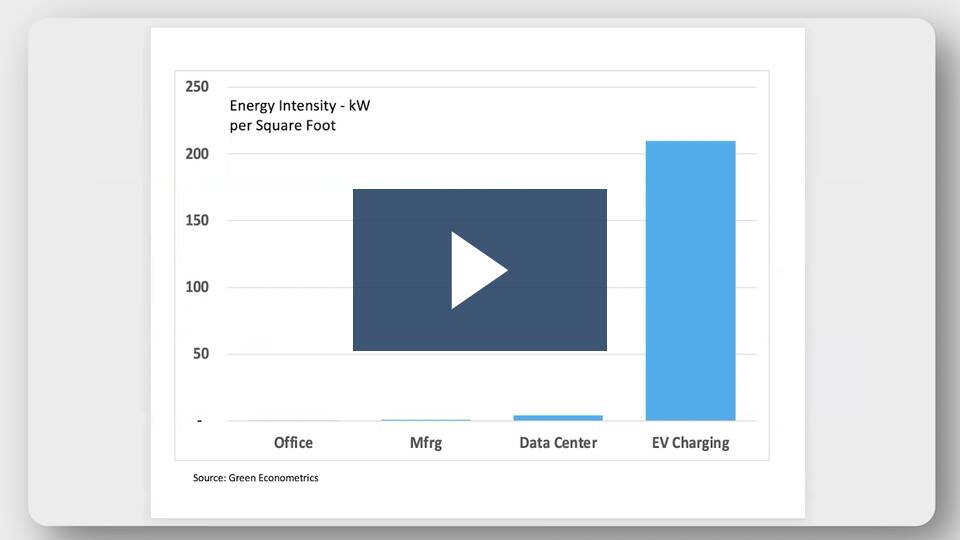
With the bipartisan National Electric Vehicle Infrastructure (NEVI) funding fast approaching, what are the implications on energy demand and the utility grid and why is EV charging compounding the complexities of grid transmission and distribution?

Currently EVs account for about 1% of the global vehicle market and according to EV Adoption, there are approximately 2 million EV on the road in the US. According to the Department of Transportation’s Federal Highway Administration, the average vehicle travels approximately 13,500 miles annually and EV efficiency is roughly 3.5 miles per kWh suggesting annual energy consumption of 3,870 kWh. According to the DOE Energy Information Administration, the average US home consumes roughly 10,900 kWh a year. Therefore, an EV would potentially account for the 35% of the average US home’s electric usage.  Most homes can be equipped with a Level 2 EV chargers (240 volts / 50 amps) mitigating any grid impact

EV Charging Grid Impact

Read More

Are Electric Vehicles Worth the Investment?

MarketScale podcast

https://marketscale.com/industries/transportation/are-electric-vehicles-worth-the-investment/

EV Economics

So, what does this EV energy transformation mean to consumers?  Let’s look at a few key factors in evaluating EVs:  economics, driving range, charging time and charging network. For one, it is the understanding of EV economics such as the difference between MPG to miles per kilowatt hour (kWh). Essentially, how far can you drive with a gallon of gas to kWh of energy. According the EPA, the average vehicle fuel efficiency in 2020 was 25.7 MPG. The U.S. Department of Transportation’s Federal Highway Administration states the average person drives around 13,500 milesevery year suggesting an annual fuel cost of over $2,300 at $4.50 per gallon.

The average EV range is approximately 3.5 miles per kWh. One way to assess the economics between MPG and kWh efficiency is to compare the driving costs of traveling 100 miles. With the average fuel cost of $4.50 in the US and 25.7 MPG equates to $17.50.  With an EV achieving 3.5 miles per kWh, the 100-mile traveling cost will depend on whether the EV was charged at home or on a charging network station. According to the Energy Information Administration, the average at home cost is roughly $0.14 per kWh. So, the 100-mile EV travel cost equates to $3.91.

However, if the EV requires charging on a public charging network, the cost is significantly higher. The average kWh cost on public charging networks is approximately $0.42 per kWh ranging from $0.25 from Tesla to $0.33-to-$0.60 on other charging networks. At $0.42 per kWh, the 100-miles travel would cost $12.00 in an EV which is still a 30% savings over conventional vehicles.

Figure 1: 100-Mile Driving Costs

Source: EPA, EIA, Green Econometrics

Read More

Analytics Framework for Sustainability

Why the analytics framework for process improvement can translate into substantial benefits around sustainability improvements and energy efficiency. The Coronavirus pandemic has upended social interaction – a new normal, with social distancing and protocols, and so why does sustainability play a crucial role in facilitating a smoother transition into the is new normal.  The reason is sustainability engenders confidence.  Knowing facilities are safe and that indoor air quality monitoring is vital for occupant health and safety builds confidence. Health and safety are also essential in generating the confidence that changes consumer behavior.  Therefore, the process by which you implement a sustainability plan plays an expanding role in orchestrating the activities that adhere to values and performance.

A sustainability framework provides the roadmap to monitor, measure and curate data thus enabling performance benchmarking of conditions and processes.  The analytics framework serves as a roadmap to utilize insight gained from data analysis.  Currently available tools such as data visual analysis, machine learning algorithms and cloud computing architecture enable cost effective approaches to achieve business and sustainability objectives.

A sustainability framework provides the foundation to drive business value across several dimensions and performance metrics.  The use of the sustainability process can drive business value, improve our environment, enhance customer loyalty, and better engage healthier and happier employees while rewarding shareholders and stakeholders with higher business valuations.

Read More

Heating and Cooling – Does Insulation Pay?

Insulation is one of the most important factors in improving building energy efficiency. Heating, ventilation and cooling (HVAC) often accounts for more than half the energy expense of a building. Insulation helps to improve the energy efficiency of heating and cooling. Depending on the selected insulating material, the economic impact on heating costs can be quite dramatic.

To understand how insulation helps improve building heating and cooling, it’s helpful to review the dynamics of building heat loss as it applies to building materials and outside actual air temperatures.

To calculate the heating requirements for a building, the overall heat loss from a building can be derived as a function of the combined heat loss of transmission through the roof, walls, windows, doors, and floors, as well as heat loss caused by ventilation and air infiltration. In general, without getting too scientific, the heat loss from transmission through roof, walls, doors, and windows represents the largest impact and is primarily a function of the temperature difference between the inside and outside air and thermal conductance of he building material. For a more detailed review of building heat loss see Heat Loss.

The difference between inside and outside temperature plays a critical role in building heat loss. The first step is to understand heating and cooling requirements from weather data. Heating degree day (HDD) are a measure of energy demand required to heat a building. HDD is derived from the difference between the daily outside temperature observations and the ideal indoor air temperature, say 65 degrees Fahrenheit (18.30 Celsius). The heating requirements for a building in a specific location can be derived from the HDD data in conjunction with building factors such as insulation, windows, solar heat gain, and use. Air conditioning also has a similar metric and is defined as cooling degree day (CDD) and measures the amount of energy used to cool a building.

From the historical data on outside air temperature, an average heating and cooling degree day can be assigned to a specific region. To calculate degree days for both heating and cooling Daily Temperatures can be assessed by zip code to capture historical data on specific climate zones.

When it comes to selecting building materials and insulation, material suppliers often supply two measures – the R-value and C-value. A material’s R-value (thermal resistance) is the measure of its resistance to heat flow. The C-value (thermal conductance) is the reciprocal of thermal resistance and measures the ability of a piece of material to transfer heat per unit time or more specifically, specifies the rate of energy loss through a piece of material.

The US Department of Energy (DOE) has provided revised R-value recommendations based on climate zones. To understand the energy impact of selecting the right R-value insulation material for your building, an on-line heating calculator will help illustrate the heating requirements and associated energy costs for different insulating materials. Building heating requirements are often expressed in BTU (British Thermal Units) per cubic foot.

The Heater Shop BTU Calculator Heating Calculator provides some useful insight into managing energy expenses. The calculations were based on an average of 25 HDD for New York City.

Figure 1 illustrates the heating requirements as measured by BTU per square foot of building space for corresponding insulating materials across ceiling heights from 10 to 40 feet to capture cubic feet. As seen from Figure 1, the heating requirements show significant variance depending on insulation assumptions.

Figure 1 BTUs per Square Foot BTU
Source: Heater Shop BTU Calculator

Taking the building heating requirements one-step further, different insulating assumptions (no insulation, average, and good) translate into wide dispersion in operating costs. The on-line heating calculator was used to estimate the building heating requirements based on the following assumptions: 10,000 square foot facility with ceiling height of 10 feet for 25 HDD for no-insulation average insulation, and good insulation. To derive fuel costs, the BTU per square foot for each insulation category was applied to a heating system operating for five heating months with approximately 1,400 hour of operations to coincide with a gas furnace at 90% efficiency and 20-minute on-cycle and 30-minute off-cycle. Gas pricing for heating are based on $17.00 per million BTU.

Figure 2 Heating Energy Cost  Heating
Source: Green Econometrics research

Figure 2 demonstrates that heating cost per square foot for good insulation saves approximately $2.90 per square foot in comparison to no-insulation at all. If we compare the heating costs savings to the cost of insulation, the payback period for insulation can be achieved in a year under most circumstances.

Figure 3 Insulation Cost  insulation
Source: Green Econometrics research

To assess the C-value and R-Value of various building materials, there are some useful charts available on the web. Insulation and Building Materials R-Values

The bottom line is that insulation is one of the most important building components materials to improve energy efficiency and lower utility costs.