Ethanol: Benefits and Issues
There are several studies evaluating ethanol as fuel for transportation that offer both positive and negative impacts from ethanol. On the positive side there is less CO2 emitted from ethanol than conventional hydrocarbon fuels, domestic producers gain economic value from employment and purchasing power, and there is less dependence on foreign oil. Other studies have concluded less efficiencies from ethanol such as negative energy values because of the fertilizers and energy used to produce ethanol is larger than the amount of energy produced, CO2 is released during the fermentation and combustion process, and it still must be blended with hydrocarbon fuels leaving us dependent on foreign oil.
Ethanol is alcohol-based fuel made from crops. Fermenting and distilling starch crops, typically corn, into simple sugars produce ethanol. Chemically ethanol is similar to hydrocarbon fuels in that they both contain carbon and hydrogen atoms.
To understand the economics, let’s compare ethanol to hydrocarbon fuels by efficiency and costs. The first step is to convert the BTU (British Thermal Unit) value of ethanol into Kilowatt-Hours (KWH) in order to have a common measure of energy. Remember the KWH is a useful measure of energy because we can equate KWH to engine horsepower performance and compare hydrocarbon fuels to alternative energies like solar and wind and compare these energy costs on a common level.
Our fuel energy conversion links Energy Units and Conversions KEEP, and Fuel BTUs provide some useful measures to evaluate ethanol in comparison to hydrocarbon fuels like diesel and gasoline.
One KWH equals 3,413 BTUs so we divide the BTU value for each fuel by 3,413 to arrive at its corresponding KWH energy value.
Energy Comparison
1 gallon of ethanol = 84,400 BTUs = 24.7 KWH
1 gallon of diesel = 138,690 BTUs = 40.6 KWH
1 gallon of gasoline = 125,000 BTUs = 36.6 KWH
1 gallon of oil = 138,095 BTUs = 40.5 KWH
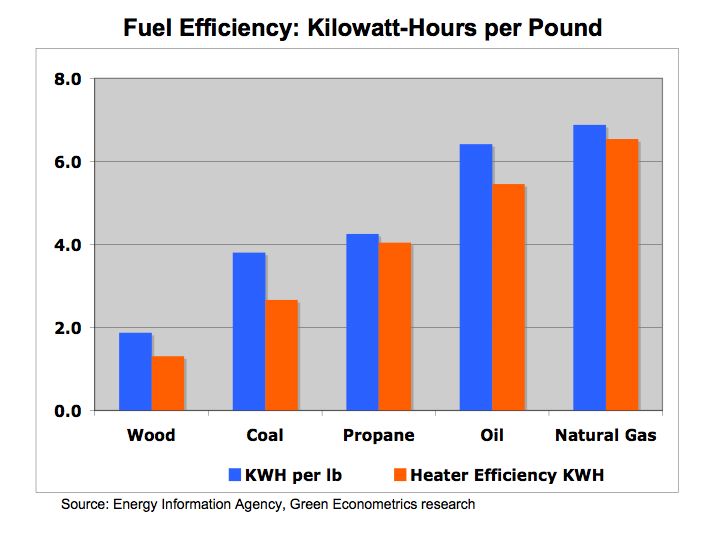
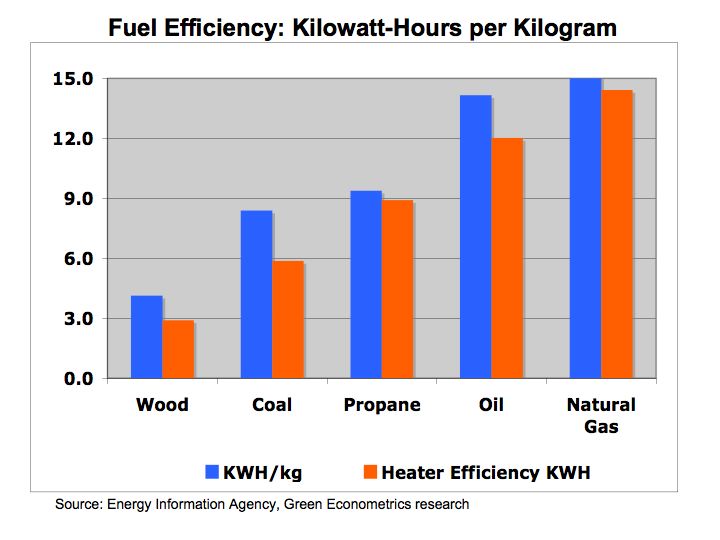
Figure 1 Kilowatt-Hours per Gallon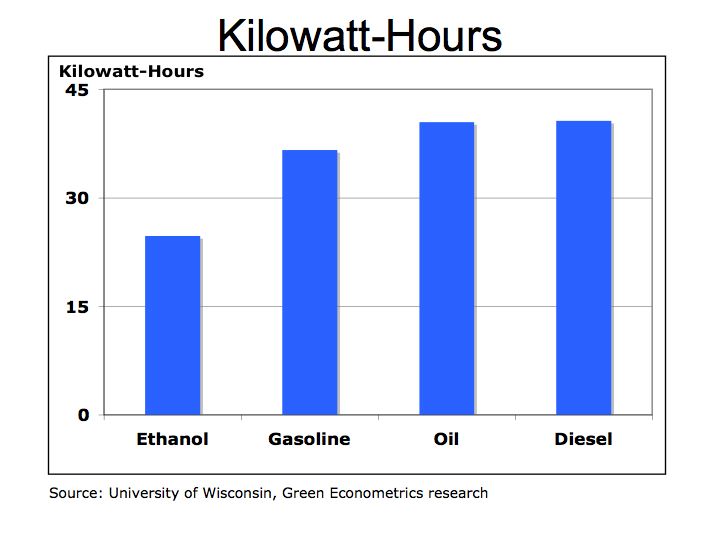
As seen from figure 1, ethanol is not the most efficient fuel because of its low BTU value in comparison to hydrocarbon fuels. However, ethanol is a form of renewable energy because the crops can be grown to generate more fuel.
Energy Economics
To compare the energy cost of ethanol to hydrocarbon fuels we convert each fuel into a cost per KWH. Our prices are quarterly average U.S. energy prices by fuel type: Ethanol Prices, , and Oil Prices
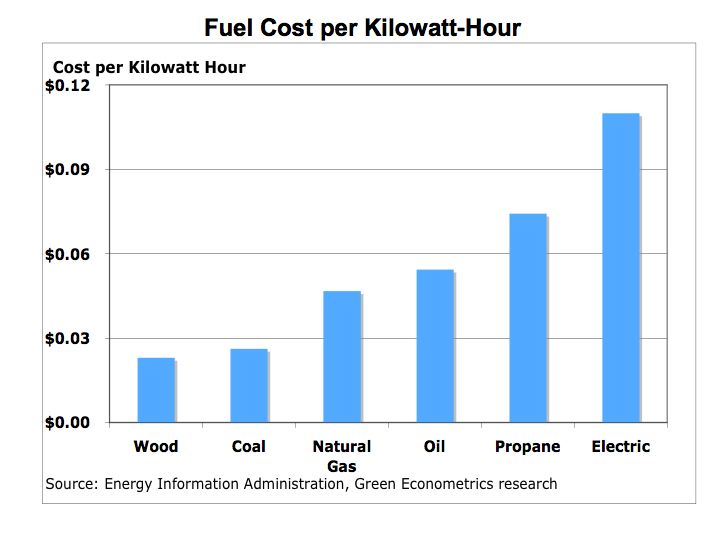
Figure 2 Cost per Kilowatt-Hours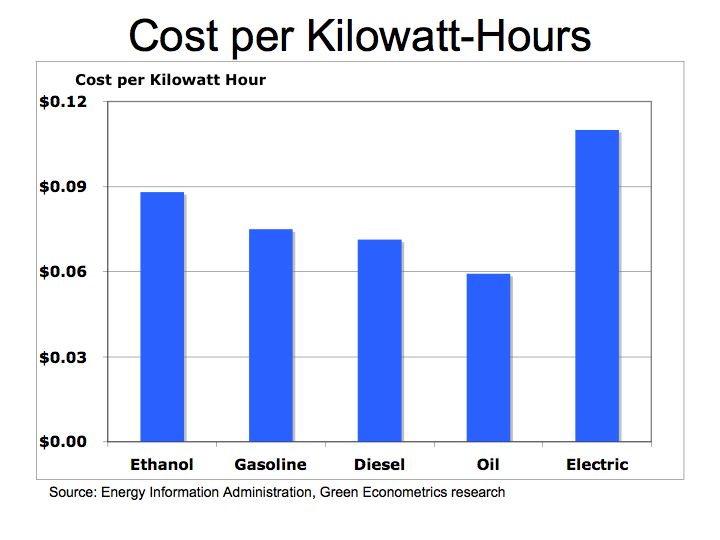
On a cost per KWH basis, ethanol is similar to hydrocarbon fuels. So depending on current fuel cost, which varies by location, ethanol could be higher or lower than diesel or gasoline.
On the production of ethanol a bushel of corn produces about 2.76 gallons of ethanol according a study by AgUnited . According to U.S. Department of Agriculture it takes 57,476 BTUs of energy to produce one bushel of corn Energy Balance of Corn Ethanol therefore, for BTU of energy used to produce ethanol there are 4 BTUs of energy gained from the ethanol for transportation.Carbon EconomicsEthanol is produced from fermentation of starch to sugars and is represented by the equation C6H12O6 = 2 CH3CH2OH + 2 CO2 according to University of Wisconsin Chemistry Professor Bassam Z. Shakhashiri The two CO2 molecules given off from the fermentation process of ethanol does add to CO2 emissions, but the growing process and biomass also extract CO2 from the atmosphere.
Emission of CO2 from hydrocarbon fuels depends on the carbon content and hydrogen-carbon ratio. When a hydrocarbon fuel burns, the carbon and hydrogen atoms separate. Hydrogen (H) combines with oxygen (O) to form water (H2O), and carbon (C) combines with oxygen to form carbon dioxide (CO2). How can a gallon of gas produce 20 pounds of CO2 To measure the amount of CO2 produced from a hydrocarbon fuel, the weight of the carbon in the fuel is multiplied by (44 divided 12) or 3.67. For ethanol we compared its basic structure to gasoline, diesel, and crude oil.
In the combustion process, ethanol produces CO2 at a rate that is below that of gasoline. The equation for ethanol combustion is C2H5OH + 3 O2 –> 3 H2O + 2 CO2. Ethanol Combustion In our simple example, the carbon weight in ethanol (two carbon with a combined atomic weight of 24 to a total weight of 46 for the molecule of C2H5OH) is multiplied by 3.67 to determine the amount of CO2 produced from ethanol. We then compared the output of CO2 to the amount of energy produced to arrive at pounds of CO2 per KWH. Bottom line is that ethanol emits 11% less CO2 than gasoline and is a renewable fuel.
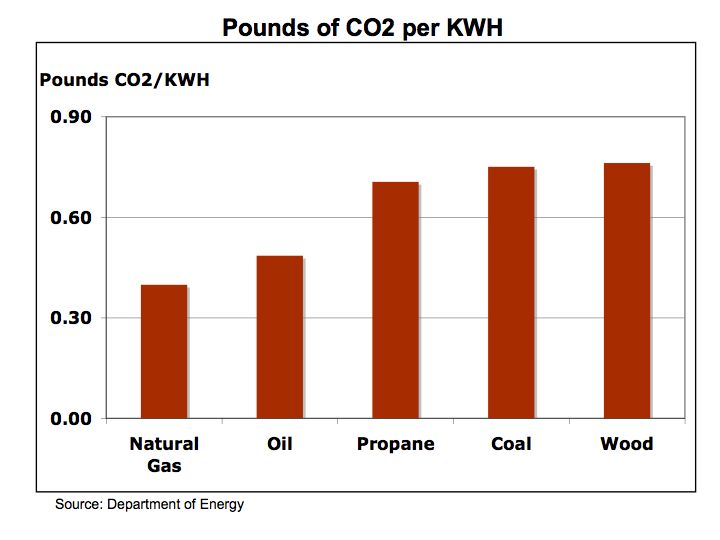
Figure 3 Pounds of CO2 by Fuel Type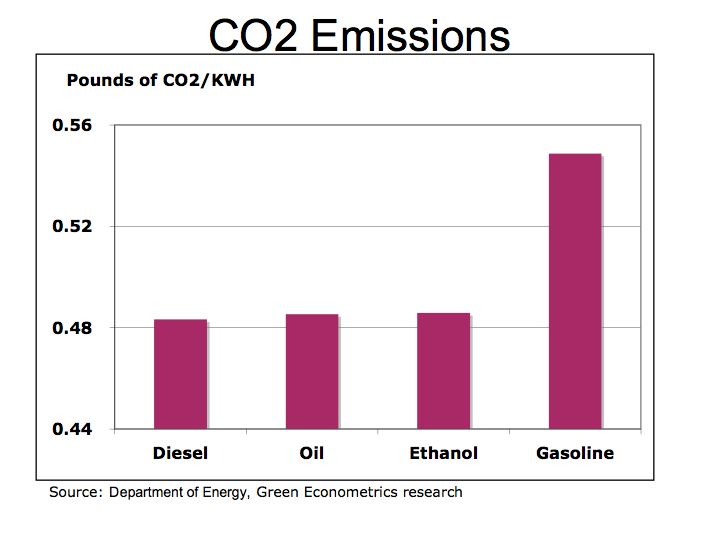
There are several studies on ethanol with the majority indicating benefits. Some of these include: High-level ethanol blends reduce nitrogen oxide emissions by up to 20% and ethanol can reduce net carbon dioxide emissions by up to 100% on a full life-cycle basis. Ethanol Benefits and Clean Cities While ethanol produces less CO2 than gasoline, it still emits CO2 and keeps us dependant upon hydrocarbon fuels.
For further information on fuel combustion Combustion Equations and for Energy to Produce Ethanol Ethanol Production