The Possible Achilles’ Heel of EVs and Energy Storage
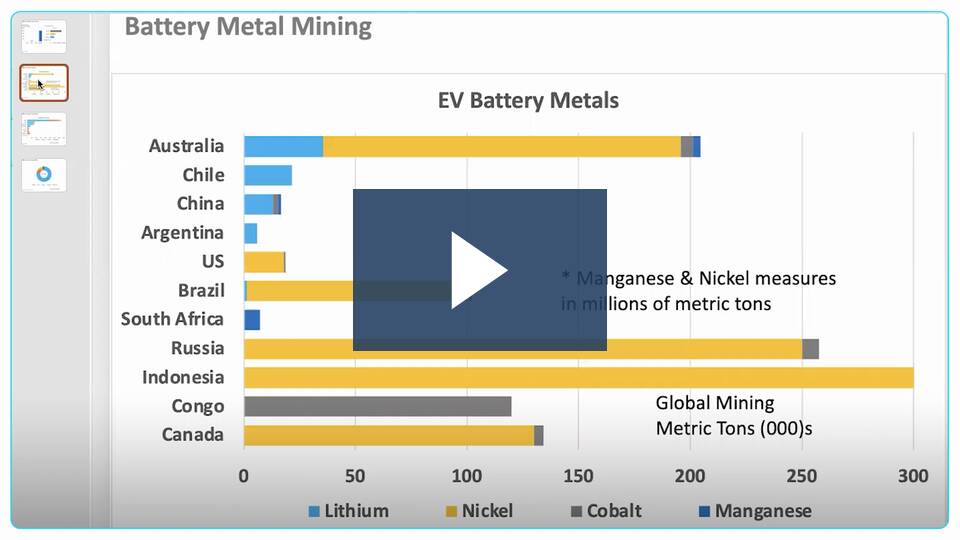
  • Battery technology is progressing slowly and advances in lithium-metal are not yet commercially available
  • Federal EV battery incentives pertain to countries with US free trade agreements: Australia, Canada, and Chile
  • Battery supply is constrained by metal mining and production is limited by complex and costly process technologies
  • More research and product production methods are imminently needed

Battery production for electric vehicles should be a concern. For one, the US has neither the resources nor the production capacity to meet the demand of EV manufacturers. Second, as a national security concern, not having the requisite production infrastructure to support energy transformation leaves the US vulnerable to economic decline and energy price increases. Third, to navigate energy transformation it’s imperative to establish battery production for grid stability and resiliency, particularly when introducing renewable energies.

Currently, lithium-ion batteries are the core foundation for EVs and most vehicle manufacturers are planning to transition to all elective vehicles in the near future. California might ban the sale of new cars running only on gasoline by 2035. The issue is the production of EVs is inextricably linked to the availability of batteries that are limited by supply constraints in both battery metals and production capacity. Our focus is on battery supply chains and production.

Battery Supply Chains

The big issue around EV batteries is assuring an adequate supply of materials at a reasonable price.  To better understand the EV supply chain let’s look at the common raw materials namely metals and their associated costs. The four primary metals in a lithium-ion battery commonly used in most EVs are lithium, nickel, cobalt, and manganese. EV batteries use nickel-manganese-cobalt cathodes, with 60% nickel and 20% of cobalt and manganese.

The Possible Achilles’ Heel of EVs and Energy Storage – MarketScale

Are Electric Vehicles Worth the Investment?

MarketScale podcast

https://marketscale.com/industries/transportation/are-electric-vehicles-worth-the-investment/

EV Economics

So, what does this EV energy transformation mean to consumers?  Let’s look at a few key factors in evaluating EVs:  economics, driving range, charging time and charging network. For one, it is the understanding of EV economics such as the difference between MPG to miles per kilowatt hour (kWh). Essentially, how far can you drive with a gallon of gas to kWh of energy. According the EPA, the average vehicle fuel efficiency in 2020 was 25.7 MPG. The U.S. Department of Transportation’s Federal Highway Administration states the average person drives around 13,500 milesevery year suggesting an annual fuel cost of over $2,300 at $4.50 per gallon.

The average EV range is approximately 3.5 miles per kWh. One way to assess the economics between MPG and kWh efficiency is to compare the driving costs of traveling 100 miles. With the average fuel cost of $4.50 in the US and 25.7 MPG equates to $17.50.  With an EV achieving 3.5 miles per kWh, the 100-mile traveling cost will depend on whether the EV was charged at home or on a charging network station. According to the Energy Information Administration, the average at home cost is roughly $0.14 per kWh. So, the 100-mile EV travel cost equates to $3.91.

However, if the EV requires charging on a public charging network, the cost is significantly higher. The average kWh cost on public charging networks is approximately $0.42 per kWh ranging from $0.25 from Tesla to $0.33-to-$0.60 on other charging networks. At $0.42 per kWh, the 100-miles travel would cost $12.00 in an EV which is still a 30% savings over conventional vehicles.

Figure 1: 100-Mile Driving Costs

Source: EPA, EIA, Green Econometrics

Read More

Why Visual Data Analytics: Discovery, Innovation and Opportunities

A data analytics framework is applicable to insight discovery; provides a roadmap towards innovation; and enables capabilities that can optimize approaches to new business models and opportunities. The following paper provides examples revealing how and why to apply visual analytics for discovery, innovation and evaluating new opportunities. 

Discover how waveforms and patterns are applied to science and finance, and how customer usage patterns can reveal new approaches to market micro-segmentation and persona classifications.  Lastly we’ll reveal how the deployment of IoT devices across the enterprise fuels data flow in the physical world regarding the performance and conditions of business assets.

Introduction

Our theme is applying visual data analytics as a tool for discovery, innovation and evaluating market opportunities. We show how two metrics, price and volume, are able to convey insight and establish price targets for technical analysis. Why energy consumption patterns and waveforms lend themselves to understanding science and classifying human behavior.  How proxy metrics can serve as measures for physical events. Why linking granular visibility into processes and the monitoring of conditions and operating performance help build an advantage in the digital economy.  

Green Econometrics relies on visual analytics as a core fabric in our data analytics frameworks because visual analytics are integral to discovery, innovation and new opportunity development. Visual insights are easy to understand – allowing business objective and performance metrics to seamlessly transfer across business units. So how do we do it?

Read More

Why Analytics and Business Intelligence

Analytics and Business Intelligence provide a framework for process improvement that drives operating efficiencies and enhances business value.  Most business owners and managers want to increase business value to benefit shareholders, stakeholders, and investors.  Individual investors and investment professionals direct capital towards companies that can demonstrate sustainable value.  Changes to performance in revenues, margins, and risks can become a catalyst to invest or divest. Business value is often measured by three performance criteria – revenues, operating margins, and risks.  Therefore, factors that contribute to revenue growth, margin expansion, and risk mitigation become the overarching goals to improve business value.  We add that sustainable value includes resource conservation and efficiency.

Just how does analytics and business intelligence address revenues, costs, and risks in improving business value?  To understand the integration of analytics and business intelligence in improving business value, let’s look at two initiatives in formulating business strategy. 

 In his book Measure What Matters, John Doer describes how establishing goals and objectives along with the corresponding performance criteria provide a better method to assure that key metrics are aligned to goals and business objectives. This process of mapping performance metrics to business objectives defined as Objectives and Key Results (OKRs) determine what is relevant to measure and track.  Adding to OKRs is the balanced scorecard approach which pulls reporting data from each business unit and department and explained by Robert Kaplan and David Norton in their Harvard Business Review article “Using the Balanced Scorecard as a Strategic Management System” to provide an assessment of conditions and performance.  

Read More

Analytics Framework for Sustainability

Why the analytics framework for process improvement can translate into substantial benefits around sustainability improvements and energy efficiency. The Coronavirus pandemic has upended social interaction – a new normal, with social distancing and protocols, and so why does sustainability play a crucial role in facilitating a smoother transition into the is new normal.  The reason is sustainability engenders confidence.  Knowing facilities are safe and that indoor air quality monitoring is vital for occupant health and safety builds confidence. Health and safety are also essential in generating the confidence that changes consumer behavior.  Therefore, the process by which you implement a sustainability plan plays an expanding role in orchestrating the activities that adhere to values and performance.

A sustainability framework provides the roadmap to monitor, measure and curate data thus enabling performance benchmarking of conditions and processes.  The analytics framework serves as a roadmap to utilize insight gained from data analysis.  Currently available tools such as data visual analysis, machine learning algorithms and cloud computing architecture enable cost effective approaches to achieve business and sustainability objectives.

A sustainability framework provides the foundation to drive business value across several dimensions and performance metrics.  The use of the sustainability process can drive business value, improve our environment, enhance customer loyalty, and better engage healthier and happier employees while rewarding shareholders and stakeholders with higher business valuations.

Read More