To measure the efficiency of conventional hydrocarbon fuels, we need a common measure of energy. The Kilowatt-Hours (KWH), the billing quantity of electric usage, serves as a useful measure of energy because we can equate KWH to engine horsepower performance, heat energy of a fuel, and compare energy costs on a common level. KWH can be used to determine which fuel is most efficient by measuring the heat output of each fuel.
A BTU is the amount of heat necessary to raise one pound of water by one degree Fahrenheit and each fuel has its own BTU measure. For example, one ton of coal produces about 21.1 million BTUs, which would equate to 6,182 KWH. One KWH equals 3,413 BTUs.
A framework to measure energy costs is to convert each fuel type into KWH of energy. Some helpful links to common fuel conversions Energy Units and Conversions KEEP, BTU by Tree, and Fuel BTUs
We want to establish common energy measure to evaluate home heating fuel efficiency for each fuel type. Our first step is to measure the BTU value for each fuel type. The next step is to divide the BTU value for each fuel by 3,413 to arrive at its corresponding KWH energy value.
Kilowatt-Hour per Unit of Fuel
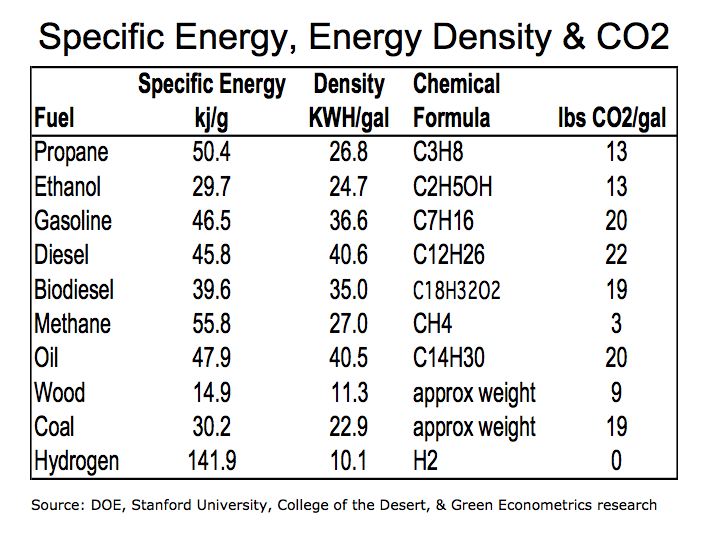
The energy value of a unit of fuel depends on its mass, carbon and hydrogen content, and the ratio of carbon to hydrogen. In general, hydrogen generates approximately 62,000 BTU per pound and carbon generates around 14,500 BTUs per pound. The combustion process is complex and while higher hydrogen content improves energy BTU levels, not all hydrogen goes to heat. Some hydrogen combines with oxygen to form water. Coal Combustion and Carbon Dioxide Emissions
Energy Comparison
1 pound of wood = 6,401 BTUs = 1.9 KWH
1 pound of coal = 13,000 BTUs = 3.8 KWH
1,000 cubic foot of natural gas = 1,000,021 BTUs = 299 KWH
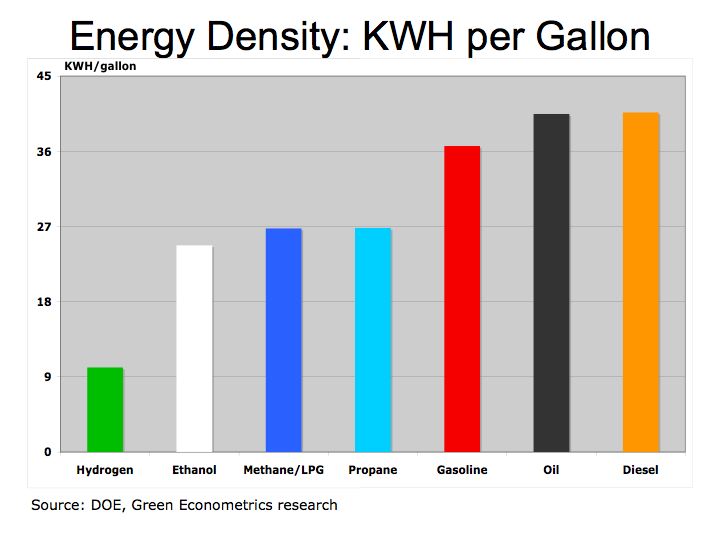
1 gallon of oil = 138,095 BTUs = 40.5 KWH
1 gallon of propane = 91,500 BTUs 26.8 KWH
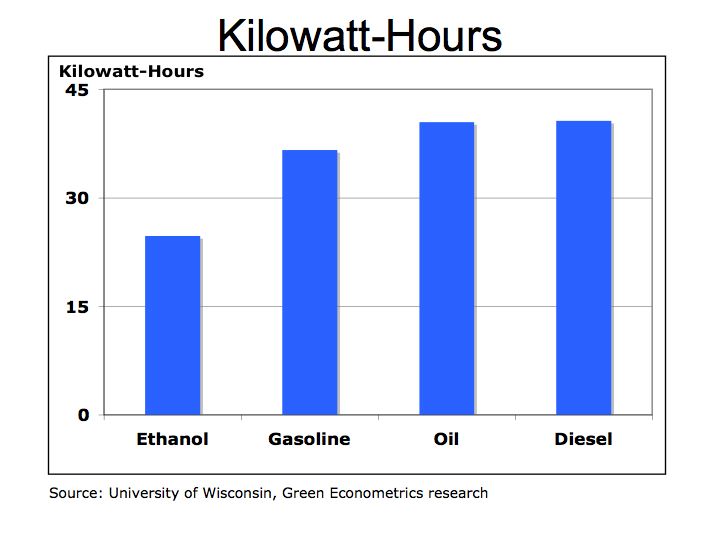
Figure 1a Kilowatt-Hours per Pound
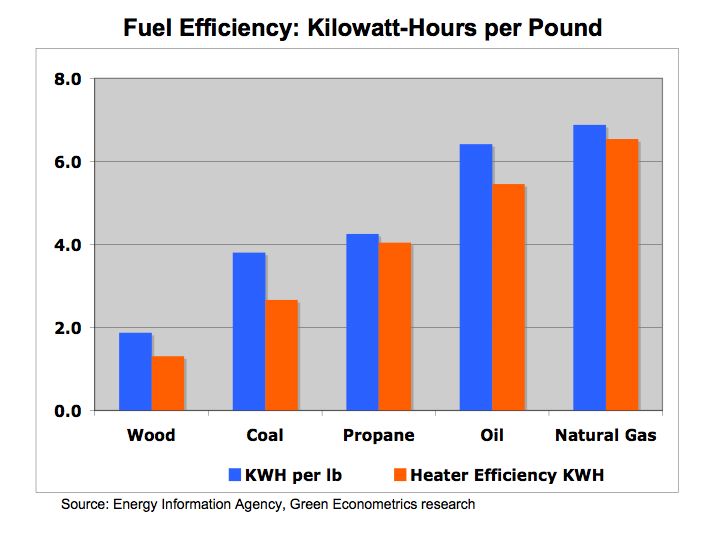
As seen from figure 1, natural gas provides the highest efficiency level followed by oil. Wood offers the lowest efficiency per pound at 1.9 KWH/lb and is followed by coal with twice the efficiency at 3.8 KWH/lb. Oil offers almost a 70% efficiency improvement over coal and propane is just slightly more efficient than coal.
Fuel Energy Efficiency
Wood = 1.9 KWH per pound
Coal = 3.8 KWH per pound
Natural Gas = 6.9 KWH per pound (liquid and gas measures are calculated at 6.3 pounds per gallon)
Oil = 6.4 KWH per pound
Propane = 4.3 KWH per pound
This is not the full story. While the energy efficiency of the fuel is important, a lot depends on the fuel efficiency of the stove or furnace that is used to heat your home. The heating efficiency of your stove or furnace has a substantial impact on the overall efficiency of the fuel’s heat value. The adjusted KWH in figure 1 indicates the fuel efficiency adjusted for the efficiency of the heating system. There is also some variance in the fuel efficiency given impurities, temperature, and water presence.
Adjusted Fuel Energy Efficiency
Wood @ 1.9 KWH per pound and stove efficiency of 70% equals 1.3 KWH/lb
Coal @ 3.8 KWH /lb and stove efficiency of 70% = 2.7 KWH/lb
Natural Gas @ 6.9 KWH /lb and furnace efficiency of 95% = 6.5 KWH/lb
Oil @ 6.4 KWH /lb and furnace efficiency of 85% = 5.5 KWH/lb
Propane @ 4.3 KWH /lb and furnace efficiency of 95% = 4.0 KWH/lb
Figure 1b Kilowatt-Hours per Kilogram
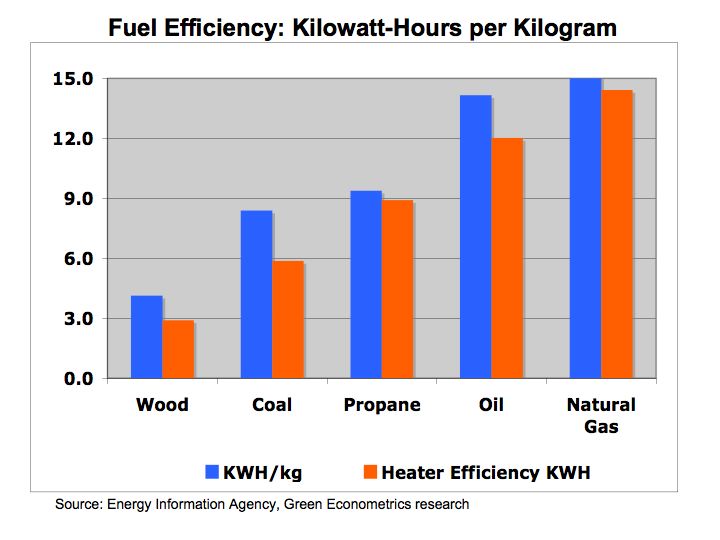
Figure 1b proves the same fuel types measured by liters and kilograms. While the absolute numbers are different, the relative fuel efficiency among the fuels is the same.
Energy Economics
The final phase of our fuel efficiency exercise is to compare an economic measure of fuel cost. The market price of fuel will vary by location, usage amount, and market conditions. Our prices were quarterly average U.S. energy prices by fuel type:
Natural Gas Prices, , Oil Prices, and Propane Prices
Coal and wood prices were based on local residential delivery.
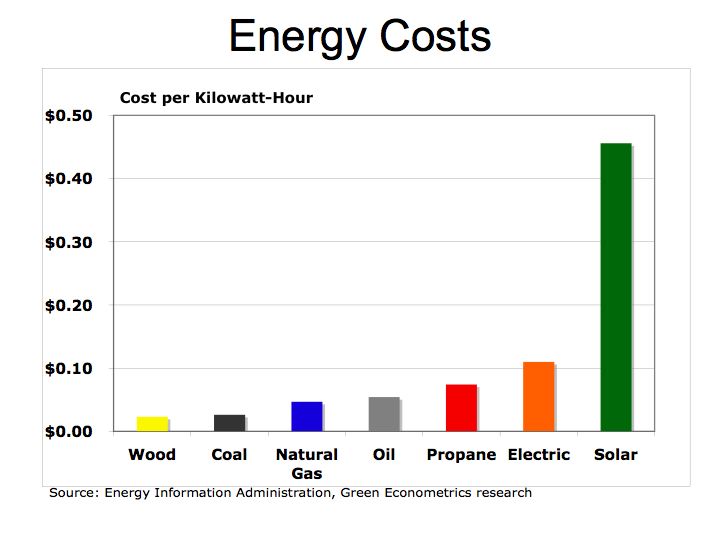
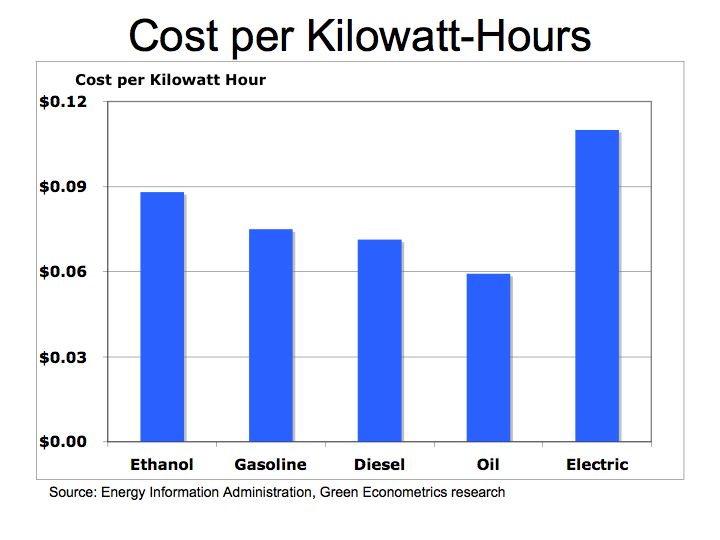
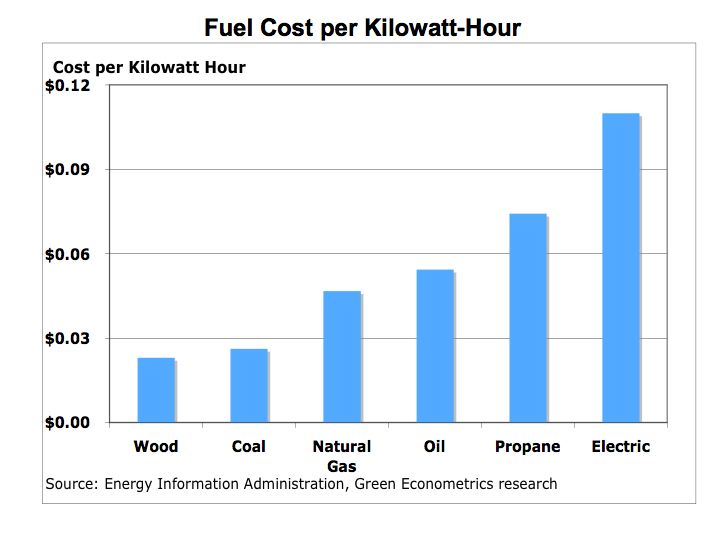
Figure 2 Cost per Kilowatt-Hours

Coal and wood are among the lowest priced fuels. However, coal and wood require extensive hands-on control and cleaning which are not factored into costs. Natural gas is offered in many urban areas and is currently priced below oil or propane. Natural gas offers higher energy efficiency and is priced lower than oil or propane, but is not available in all urban markets and very limited rural availability.
The trade off between oil and propane, which can be found in most markets, is operating efficiency and maintenance. Modern oil furnaces are demonstrating higher operating efficiencies, but cost significantly more than propane. Oil does offer higher efficiency than propane, but maintenance costs are higher for oil furnaces and that cost is not reflected in these fuel costs measures.
Electric heat in some markets where utility rates are below oil or gas may offer favorable economics, but electric rates might be going higher as utilities switch to lower carbon emission fuels. The challenge is to migrate electric utilities from lower-priced coal with high CO2 emissions to natural gas with lower carbon emissions. The cost to lower CO2 emissions from coal burning utilities could force natural gas prices to rise. The bottom line is that energy prices will continue to rise with natural gas tide to oil production. Even with higher fuel prices, there is still a tremendous disparity between conventional and alternative energies with the cost of solar near $0.38 per KWH and residential electric rates of $0.11 per KWH.
Carbon Economics
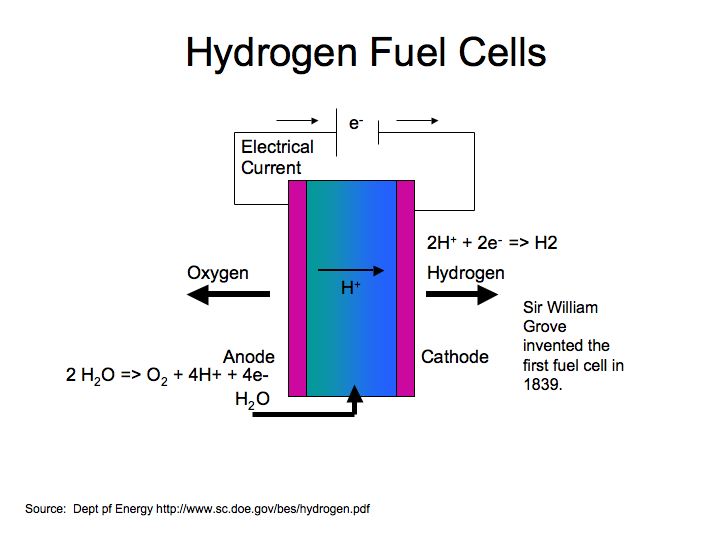
Emission of CO2 from hydrocarbon fuels depends on the carbon content and hydrogen-carbon ratio. When a hydrocarbon fuel burns, the carbon and hydrogen atoms separate. Hydrogen (H) combines with oxygen (O) to form water (H2O), and carbon (C) combines with oxygen to form carbon dioxide (CO2).
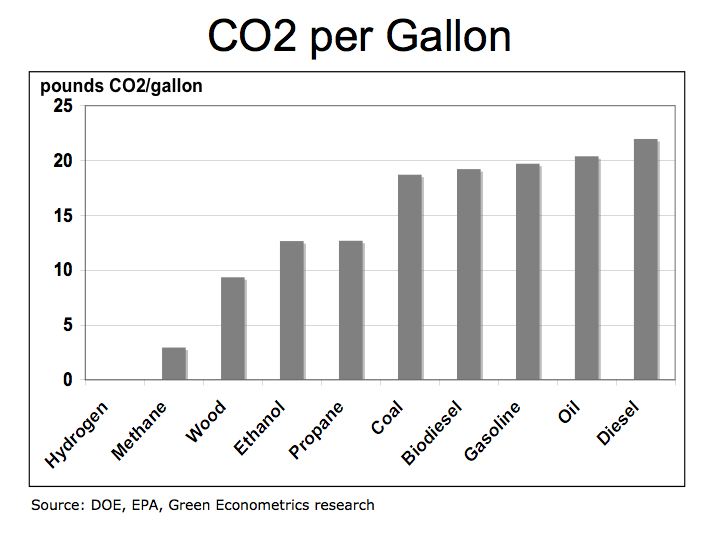
How can a gallon of gas produce 20 pounds of CO2
From this example, a carbon atom has an atomic weight of 12, combines with two oxygen atoms each with a weight of 16, to produce a single molecule of CO2 an atomic weight of 44. To measure the amount of CO2 produced from a hydrocarbon fuel, the weight of the carbon in the fuel is multiplied by (44 divided 12) or 3.67.
Wood has half the carbon content than coal, but coal is twice as efficient as wood and therefore both have nearly the same high level carbon footprint. Oil benefits from having higher energy efficiency than propane giving oil 30% lower CO2 emissions pound for pound.
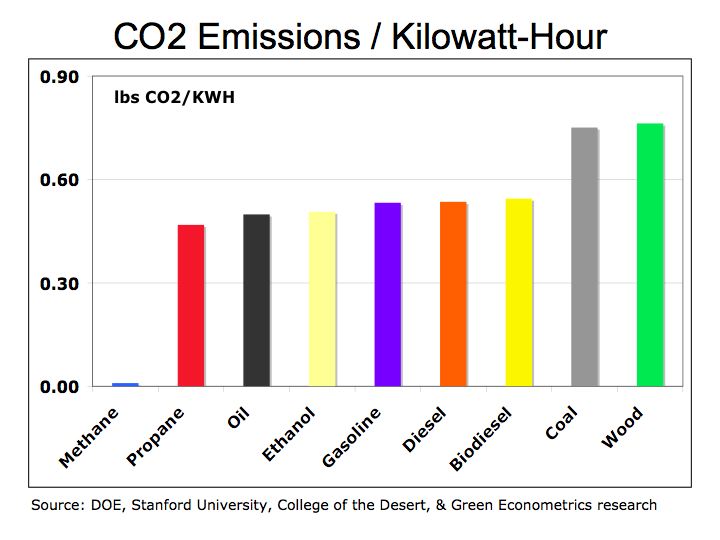
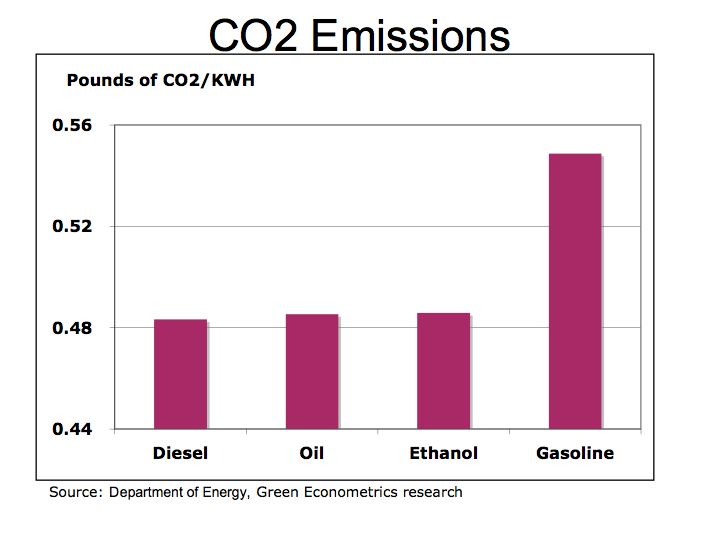
Figure 3 Pounds of CO2 by Fuel Type
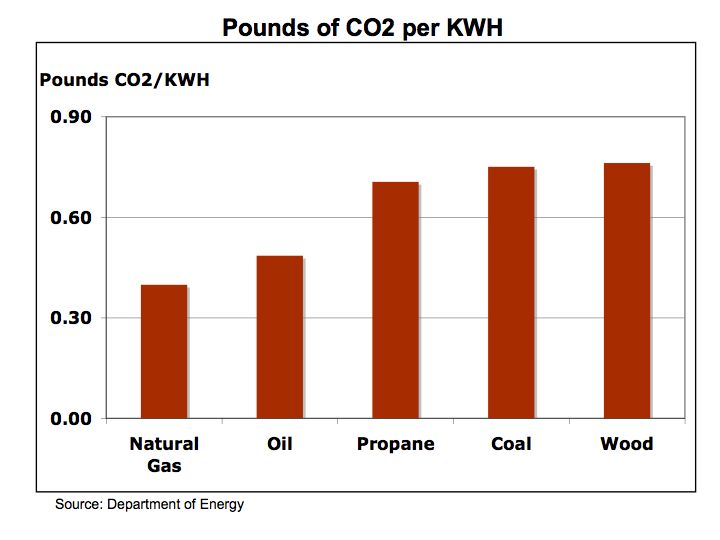
Natural gas, because of its low carbon content and high fuel efficiency, achieves lower CO2 emissions than oil, propane, or coal. Natural gas produces 46% less CO2 than coal and 10% less than oil. With coal relatively abundant and cheap in comparison to oil or natural gas, energy prices may increase as electric utilities switch to lower CO2 emission natural gas or invest into emission reduction processes that add to capital costs and operating expense.