Solar Energy: The Security Perspective

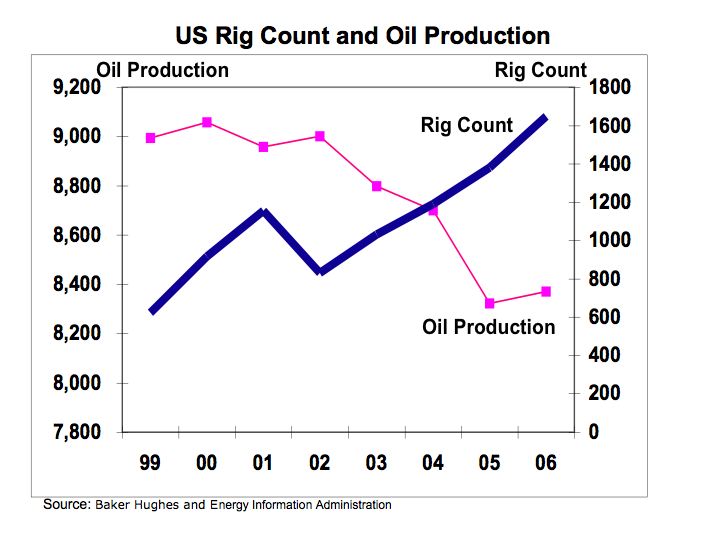
The U.S. Department of Energy (DOE)’s $23.6 Billion Spending Plan for FY’07 calls for $1.5 billion for the Office of Energy Efficiency and Renewable Energy where spending includes $28 million in solar, $16 million for thin-film photovoltaic manufacturing equipment to reduce the cost of solar panels, $23 million for researching ethanol, and $100 million for carbon sequestration research. However, more than half of the DOE spending is targeted towards research on weapons, defense, and security. Perhaps our national security would be better served if the U.S. were not dependent on foreign oil. Investment into alternative energies like solar and fuel cells could provide us with energy independence with less concern over protecting oil in foreign lands.

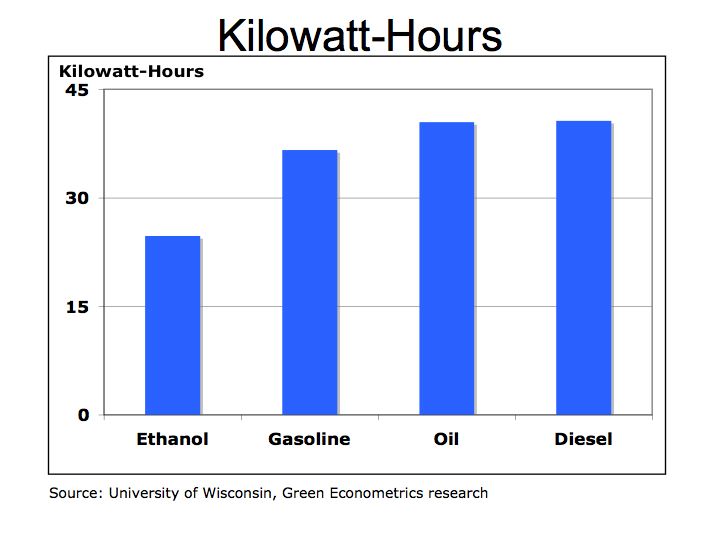
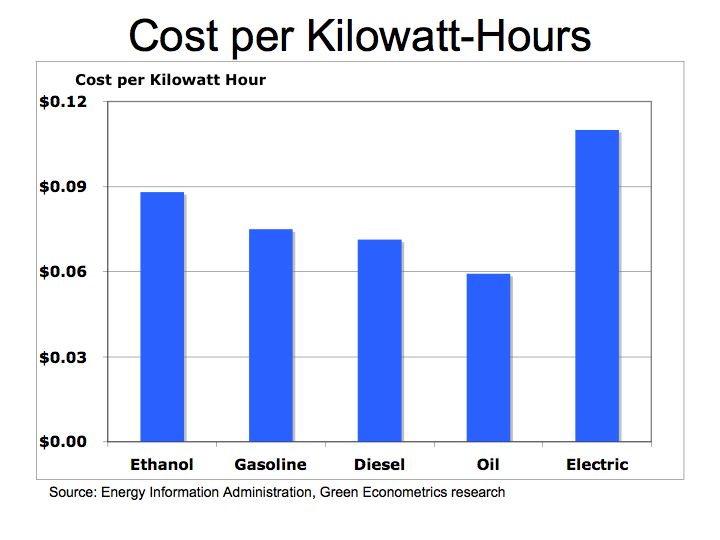
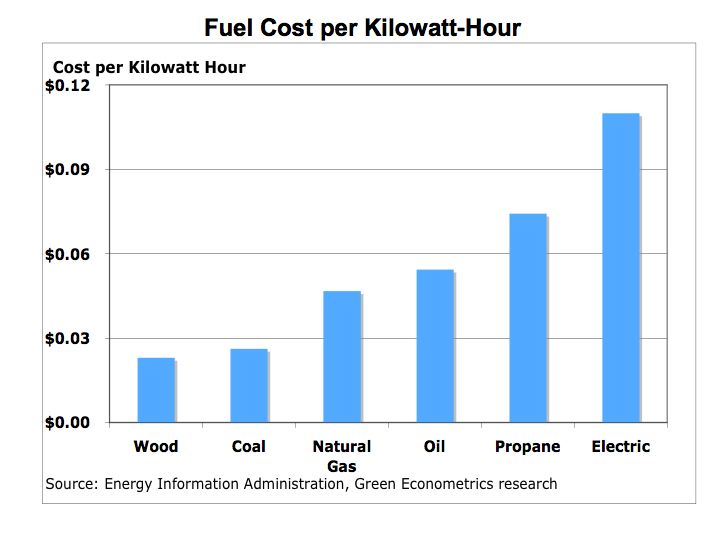
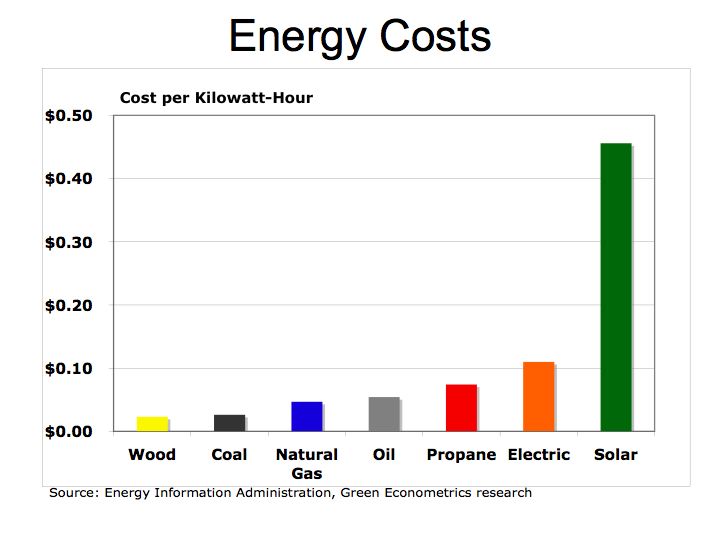
Solar energy is significantly more expensive than conventional hydrocarbon fuels. In Green Econometrics’ prior analysis of fuel efficiencies and costs, we found solar energy cost approximately $0.38-to-$0.53 per Kilowatt-Hour (KWH). See Understanding the Cost of Solar Energy
There is considerable variance in the cost of solar energy because sunlight availability varies by geography and climate. With limited sunlight solar costs could be over $1.00 per KWH. In terms of cost per KWH, solar energy is four-to-ten times the cost of hydrocarbon fuels.

Figure 1 Cost per Kilowatt-Hour
Energy Costs

For solar energy to be at parity with conventional fuels solar energy needs to be subsidized through tax incentives, utility rebates, and research funding. Research is perhaps the most important aspect of improving the economics of solar energy because through research companies could dramatically lower production costs. The disconnect in solar energy research is limited funding. Funding is required to incubate ideas and new approaches to solar energy in order to develop a roadmap for commercialized products that in turn, could be embraced by venture capital.

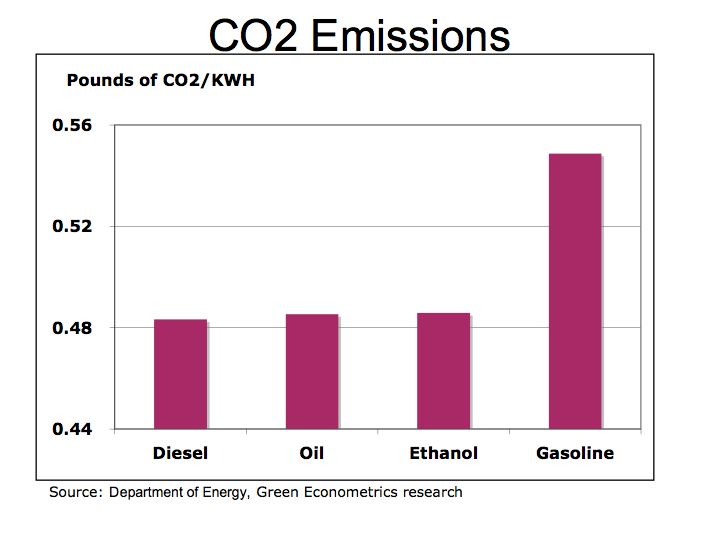
The DOE’s research funding for solar is just a drop in the bucket or barrel that better correlates the magnitude disparity. Electric utilities companies are providing electric power generated mainly through coal, which contributes heavily to CO2 emissions, and yet they don’t spend on research and development towards alternative energies. Large energy companies like Exxon Mobil (XOM) don’t have R&D budgets like pharmaceutical or technology companies that spend 14%-to-20% of their revenues on R&D. Merck (MRK) and Genentech (DNA) spent 17% and 20%, respectively on R&D while Microsoft (MSFT) and Google (GOOG) spent 15% and 14%, respectively on R&D in 2006.

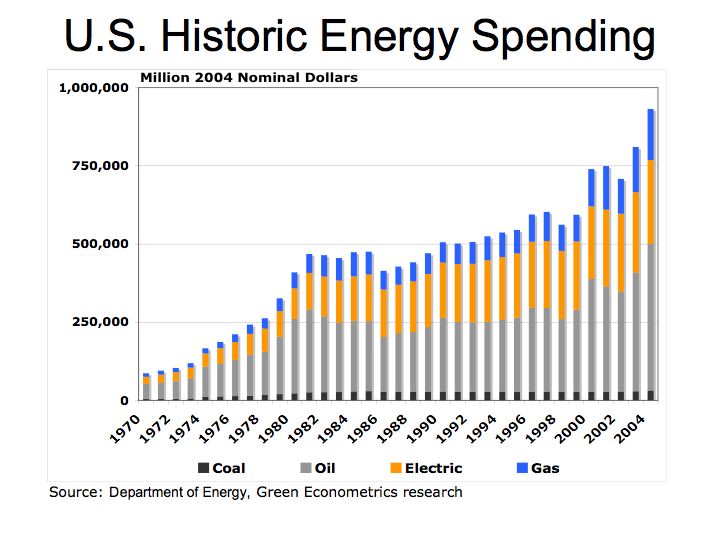
If Exxon Mobil were spending 10% of its 2006 revenues of $377.6 billion towards R&D to develop alternative energies, it would amount to over $37 billion, a figure that is larger than the DOE budget of $23.6 billion. DOE spending on solar energy research is approximately $28 million. According to the DOE, U.S. energy expenditures in 2004 were over $869 billion. So with that amount of money being spent on energy, how much should be spent to avoid dependence on foreign oil?

Figure 2 Historic Energy Spending
Historic Energy Spending

Solar energy and fuel cell technologies have the potential to ameliorate our energy dilemma of foreign oil dependence and risk of climate change from carbon emissions. While it’s hard to measure the economic impact of climate change, our dependence on foreign oil leaves us with growing $450 billion debt for our presence in Iraq and our national security vulnerable to vagaries of oil prices. The Cost of Iraq War The $450 billion the U.S. is spending in Iraq is almost enough money to equip the 124.5 million homes in the U.S. with a 1 KW solar energy system. The U.S. housing units rose to 126.7 million in 2006. Of course that may not cover your total electric usage that averages about 10,760 KWH per household according to data from the Energy Information Administration Electric Power Annual 2005 – State Data Tables

Can higher R&D spending on solar energy help?
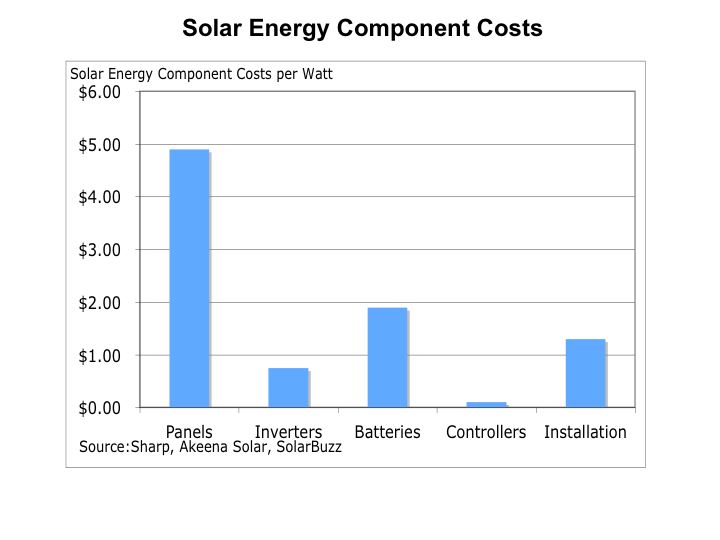
Even some of the leading domestic solar photovoltaic cell suppliers are light on R&D spending. SunPower (SPWR) and First Solar (FSLR) are budgeting their R&D spending towards the single digits as a percentage of revenues. Despite relatively low R&D spending levels, SunPower intends to lower solar panels cost by 50% by 2012. Solar photovoltaic cells undergo the same production processes as semiconductors. Experience curves associated with semiconductor production indicate a 20%-to-30% cost reduction with doubling of production. See The experience curve or cost-volume curve article from the Lockwood group TECHNOLOGY TRANSFER: A PERSPECTIVE The solar energy market is expected to grow at 80% over the next five years according to Rhone Resch, president of the Solar Energy Industries Association Solar Leader Expects >80% Market Growth Even without new advances in photovoltaic materials, with a solar energy market growth of 25% and an experience curve of 30%, solar cost could decline by 30% every three years from about $8.90 a watt ($0.45 a KWH) to $2.14 a watt or $0.11 a KWH in 15 years equal to the current price of electricity. The bottom line is that faster market growth and/or increased funding of solar energy research could significantly improve the economics of solar energy and give the U.S. greater security and energy independence.

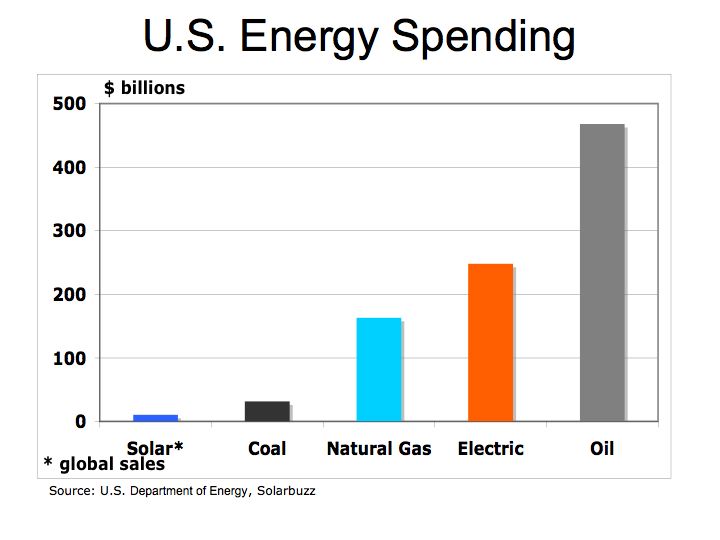
Solar and alternative energies represent a very small percentage of our total expenditures on energy. Energy Price and Expenditure Estimates by Source
So a substantial reduction of solar energy costs, assuming somewhat elastic demand, we should see significant growth in solar energy. In addition, if we tax hydrocarbon fuels by their respective carbon emissions, we might begin to see level energy playing field.

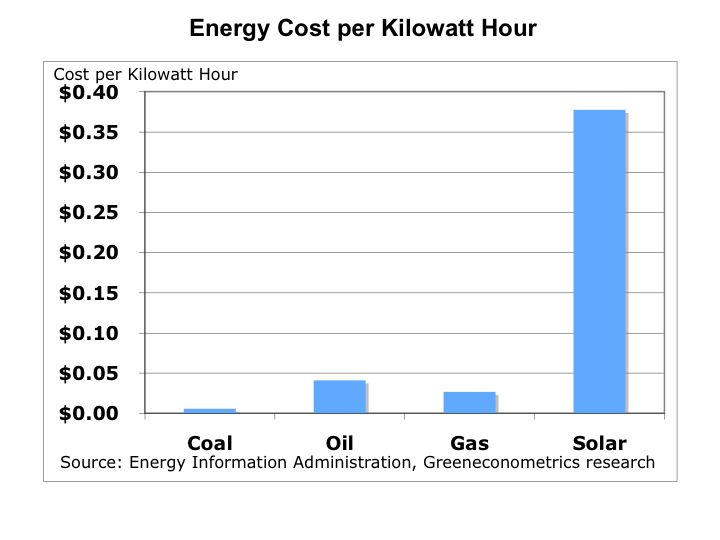
Figure 3 Energy Spending
Energy Spending

Funding solar energy should be views as a strategic imperative at par with national surety. Energy security should equate to national security and alternative renewable energies should provide us with the means to our energy independence.

Ethanol: Benefits and Issues

There are several studies evaluating ethanol as fuel for transportation that offer both positive and negative impacts from ethanol. On the positive side there is less CO2 emitted from ethanol than conventional hydrocarbon fuels, domestic producers gain economic value from employment and purchasing power, and there is less dependence on foreign oil. Other studies have concluded less efficiencies from ethanol such as negative energy values because of the fertilizers and energy used to produce ethanol is larger than the amount of energy produced, CO2 is released during the fermentation and combustion process, and it still must be blended with hydrocarbon fuels leaving us dependent on foreign oil.

Ethanol is alcohol-based fuel made from crops. Fermenting and distilling starch crops, typically corn, into simple sugars produce ethanol. Chemically ethanol is similar to hydrocarbon fuels in that they both contain carbon and hydrogen atoms.

To understand the economics, let’s compare ethanol to hydrocarbon fuels by efficiency and costs. The first step is to convert the BTU (British Thermal Unit) value of ethanol into Kilowatt-Hours (KWH) in order to have a common measure of energy. Remember the KWH is a useful measure of energy because we can equate KWH to engine horsepower performance and compare hydrocarbon fuels to alternative energies like solar and wind and compare these energy costs on a common level.

Our fuel energy conversion links Energy Units and Conversions KEEP, and Fuel BTUs provide some useful measures to evaluate ethanol in comparison to hydrocarbon fuels like diesel and gasoline.

One KWH equals 3,413 BTUs so we divide the BTU value for each fuel by 3,413 to arrive at its corresponding KWH energy value.

Energy Comparison
1 gallon of ethanol = 84,400 BTUs = 24.7 KWH
1 gallon of diesel = 138,690 BTUs = 40.6 KWH
1 gallon of gasoline = 125,000 BTUs = 36.6 KWH
1 gallon of oil = 138,095 BTUs = 40.5 KWH

Figure 1 Kilowatt-Hours per GallonKWH per Gallon

As seen from figure 1, ethanol is not the most efficient fuel because of its low BTU value in comparison to hydrocarbon fuels. However, ethanol is a form of renewable energy because the crops can be grown to generate more fuel.

Energy Economics

To compare the energy cost of ethanol to hydrocarbon fuels we convert each fuel into a cost per KWH. Our prices are quarterly average U.S. energy prices by fuel type: Ethanol Prices, , and Oil Prices

Figure 2 Cost per Kilowatt-HoursEnergy Costs

On a cost per KWH basis, ethanol is similar to hydrocarbon fuels. So depending on current fuel cost, which varies by location, ethanol could be higher or lower than diesel or gasoline.

On the production of ethanol a bushel of corn produces about 2.76 gallons of ethanol according a study by AgUnited . According to U.S. Department of Agriculture it takes 57,476 BTUs of energy to produce one bushel of corn Energy Balance of Corn Ethanol therefore, for BTU of energy used to produce ethanol there are 4 BTUs of energy gained from the ethanol for transportation.Carbon EconomicsEthanol is produced from fermentation of starch to sugars and is represented by the equation C6H12O6 = 2 CH3CH2OH + 2 CO2 according to University of Wisconsin Chemistry Professor Bassam Z. Shakhashiri The two CO2 molecules given off from the fermentation process of ethanol does add to CO2 emissions, but the growing process and biomass also extract CO2 from the atmosphere.

Emission of CO2 from hydrocarbon fuels depends on the carbon content and hydrogen-carbon ratio. When a hydrocarbon fuel burns, the carbon and hydrogen atoms separate. Hydrogen (H) combines with oxygen (O) to form water (H2O), and carbon (C) combines with oxygen to form carbon dioxide (CO2). How can a gallon of gas produce 20 pounds of CO2 To measure the amount of CO2 produced from a hydrocarbon fuel, the weight of the carbon in the fuel is multiplied by (44 divided 12) or 3.67. For ethanol we compared its basic structure to gasoline, diesel, and crude oil.

In the combustion process, ethanol produces CO2 at a rate that is below that of gasoline. The equation for ethanol combustion is C2H5OH + 3 O2 –> 3 H2O + 2 CO2. Ethanol Combustion In our simple example, the carbon weight in ethanol (two carbon with a combined atomic weight of 24 to a total weight of 46 for the molecule of C2H5OH) is multiplied by 3.67 to determine the amount of CO2 produced from ethanol. We then compared the output of CO2 to the amount of energy produced to arrive at pounds of CO2 per KWH. Bottom line is that ethanol emits 11% less CO2 than gasoline and is a renewable fuel.

Figure 3 Pounds of CO2 by Fuel TypeEthanol CO2

There are several studies on ethanol with the majority indicating benefits. Some of these include: High-level ethanol blends reduce nitrogen oxide emissions by up to 20% and ethanol can reduce net carbon dioxide emissions by up to 100% on a full life-cycle basis. Ethanol Benefits and Clean Cities While ethanol produces less CO2 than gasoline, it still emits CO2 and keeps us dependant upon hydrocarbon fuels.

For further information on fuel combustion Combustion Equations and for Energy to Produce Ethanol Ethanol Production

How vulnerable are we to energy shocks?

The second category 5 hurricane to hit Caribbean in two weeks leaves uncertainty in the energy market as oil prices head higher. While it is hard to draw the direct correlation between global warming and hurricanes strength, the fact is the oil production in the Gulf of Mexico accounts for 32% of our total oil production. In addition, the Gulf of Mexico is one the most productive oil and gas region as the U.S. faces declining petroleum product production despite significant increase in the number of oilrigs. The increasing likelihood of a weather related energy supply disruptions particularly from the Gulf area could dramatically increases to energy prices similar to Hurricane Katrina’s impact in 2005.

Higher oil prices have driven demand for energy exploration and investment into oil and gas drilling rigs. Since 1999, the number of drilling rigs has increased 112%. In the U.S., rig count is up 181% with 1,749 rigs in operation in 2007 from 622 in 1999 according to Baker Hughes. Worldwide Rig Count
According to RigZone there are 278 offshore drilling rigs in the Gulf of Mexico RigZone

Figure 1 Worldwide Rig Count
Worldwide Rig Count

Figure 1 provides the rig count for the U.S. and the world. The U.S. accounts for over half the world oil drilling rigs yet our production is less than 10% of total global production. The Gulf of Mexico with 278 drilling rigs produces 32% of our oil with only 16% of the rigs. Hurricane Impacts on the U.S. Oil and Natural Gas Markets The rigs in the Gulf of Mexico are more productive and therefore any weather related disruption in the Gulf leaves us more vulnerable to energy shocks.

Figure 2 US Rig Count and Oil Production
Rig Count and Oil

While the U.S. rig count is up 118% from 1999, petroleum production is actually down 7%. On a global basis, oil and petroleum product production increased 13% since 1999 and this includes a 60% increase in the number of drilling rigs excluding the U.S. The bottom line is the U.S. and the rest of the world is experience diminishing returns on investments in oil production.

With diminishing returns on investment into oil, would it not be better to invest into alternative energy such as solar or wind. The truth is the cost of solar and wind are still dramatically higher than hydrocarbon fuels. The cost of solar on a kilowatt-hour (KWH) basis is approximately $0.38 per KWH in comparison to oil at $0.05 per KWH.

Figure 3 Cost per Kilowatt-Hours
Energy Costs

Initiatives such as the trading of carbon credits leave little economic incentive to invest into alternative energy. A survey last year by TreeHugger found carbon credits trading for $5.50 to $13 per metric ton of carbon dioxide. Survey of Carbon offsets A metric ton of carbon dioxide equates to about 110 gallons of gasoline and at these prices, the carbon emission amounts to about $0.05-to-$0.12 to a gallon of gasoline. The carbon penalty does not even come close to bringing solar or wind energy on the same playing filed with hydrocarbon fuels. The Carbonfund organization offers a means to offset your carbon emissions with tax-deductible contributions

The cost of carbon emissions is not reflected in the market for energy. In addition, the market is unable to establish a fair price for carbon because there is no market force used to establish the value of carbon credits. We need a mechanism to bring solar energy at par with hydrocarbon fuels to limit our vulnerability to energy shocks and supply disruptions.

Understanding the Cost of Solar Energy

In comparison to conventional hydrocarbon fuels such as coal or oil in generating electricity, the cost of solar energy is significantly higher. To compare energy cost, a common equivalent is required. Back in our previous post, Coal: Fueling the American Industrial Revolution to Today’s Electric, we developed a framework to measure energy costs by converting costs to kilowatt-hours (KWH).

In our example, a ton of coal on the average produces approximately 6,182 KWH of electric at a cost of about $36 per short ton (2,000 pounds). Under this measure coal cost less than$0.01 per KWH. In comparison, a barrel of oil at $70/barrel produces 1,700 KWH at a cost approximately $0.05 per KWH. Let’s provide some measures to understand energy costs.
Energy Units and Conversions KEEP

Energy Comparison
1 ton of coal = 6,182 KWH
1 barrel of oil = 1,699 KWH
1 cubic foot of gas = 0.3 KWH

Energy Costs
1 ton of coal costs $36 = $0.006 per KWH
1 barrel of oil costs $70 = $0.05 per KWH
1 cubic foot of gas $0.008 = $0.03 per KWH

In comparison to solar energy, the hydrocarbon fuel costs are significantly lower without rebates, tax benefits nor the cost of carbon emissions. A two–Kilowatt (KW) solar energy system costs about $45,000 and covers roughly half of a typical American household’s energy needs. At $45,000, a solar energy system equates to $9,000 a kilowatt. The $9,000 per KW for solar is not very helpful in comparing electric generation costs to other fuels like coal or gas. Since coal, oil, and gas can be measured on a cost per KWH, we should measure solar costs on a KWH basis.

Some of the considerations for a solar energy system include the 20-to-30 year lifespan of the system and the hours of available sunlight. The hours of available sunlight depends on latitude, climate, unblocked exposure to the sun, ability to tilt panels towards the sun, seasonality, and temperature. On the average, approximately 3.6 peak sunlight hours per day serves as a reasonable proxy to calculate the average annual output of electric from solar energy panels.

Solar Energy Costs
Average system costs = $95 per square foot
Average solar panel output = 10.6 watts per square foot
Average solar energy system costs = $8.95 per watt

In order to compare the solar energy costs to conventional hydrocarbon fuels, we must covert the $8.95 per into KWH. Let’s make two calculations to measure the total electric energy output over the lifespan of the solar energy system. The first adjustment is to convert solar direct-current (DC) power to alternating current (AC) power that can be used for household appliances. The conversion of DC to AC power results in an energy loss of 10 percent for a solar energy system. The second calculation is to approximate total electric output by multiplying the average peak hours of sunlight (about 3.63 hours per day) times 365 days times 20 years (the product lifespan).

For our 5-KW solar energy system costing $45,000, the conversion to KWH is as follows:

5 KW times 90% = 4.5 KW – (Conversion of DC to AC power)
4.5 KW times 3.63 hours = 16 KWH per Day
16 KWH x 365 = 5,962 KWH – (Average Annual Output)
5,962 KWH x 20 years = 119,246 KWH – (Total output over 20 year lifespan)

So a $45,000 5KW solar energy system produces about 119,246 KWH of electric over its lifespan meaning the average cost equals $0.38 per KWH. ($45,000 divided by 119,246 KWH)

Figure 1 Cost of Energy
Energy Costs

The relatively high solar energy costs in comparison to conventional fuels should improve with utility rebates and government tax incentives. In addition, solar panel prices should continue to decline as volume production increases. Solar cell manufacturers employ similar production methods as semiconductor suppliers and benefit from economies of scale.

There are several components of a solar energy system. Solarbuzz provides some detailed information on solar industry pricing. Solarbuzz
The single largest cost is the solar panels themselves. The following figure provides an overview of the components of a solar energy system. Sharp Solar provides a very useful calculator for system costs and electric generation by geographical location along with utility rebates for your area. Sharp Solar Energy

Figure 2 Solar Energy Component Costs
Component Costs

We will explore the some of the advances in thin-film technologies, the declining costs of solar panels, and the improving solar conversion efficiencies that should continue to bring solar energy costs on par with hydrocarbon fuels. With the improving cost structure of solar and a better understanding of the cost of carbon emissions from hydrocarbon fuels, we may find a more level playing field in comparing energy costs.

Coal: Fueling the American Industrial Revolution to Today’s Electric

Why the economics of coal helps us better understand the benefits of wind and solar energy

On August 8, 1829, the Stourbridge Lion made entry as the first American steam locomotive in Honesdale, PA initiating the American Railroad. The steam locomotive railroad was the first developed to transport Anthracite coal mined in nearby Carbondale, PA to a canal in Honesdale, linking to the Hudson River in New York.

Coal as fuel energy has had an early use in American history with the 50 tons dug in 1748. Coal 1748 The history of coal dates backs to 2,000 BC and for oil it is even longer. Coal was cheaper and more efficient than wood. Coal was also more efficient to run most steam-powered engines, but was costly to transport and mine.

In terms of heating efficiency, coal offers almost double the energy, pound for pound, in comparison to wood. Energy Units and Conversions KEEP
Coal was difficult to mine and transport so engineers in America during the Industrial Revolution faced many challenges. Anthracite coal commanded a premium price because it emitted less smoke, was harder and contained more carbon giving it more fuel content than softer Bituminous or Lignite coals. There are several types of coal along a hard-to-soft classification. The makeup of coal changes according to compounds of lower hydrogen content and higher carbon – types of coal. Coal Ash Research Center University of North Dakota
The Anthracite coal deposits in Northeastern, PA are the largest deposit in the U.S. The gravity railroad linking Carbondale to Honesdale was an example of capital, knowledge, and technology meeting the growing need for energy.

Figure 1 Gravity Railroad
Gravity Railroad

Coal was an important component for commerce and heating. With access to the large Anthracite coal deposits in Northeastern, PA, New York City gained an advantage over competing port cities like Boston and Philadelphia. It was the energy infrastructure of the railroad and canal transportation network that enabled New York to access coal. Essentially, coal provided the fuel for the Industrial Revolution and New York City’s ability to access coal to meet the needs of its growing population and commerce was critical to the city’s success. Honesdale, PA was named in honor of then mayor of New York. Wayne County Historical Society

To understand the economics of coal let’s start with a measurement of energy. One ton of coal is equal to 16.2-to-26 million BTUs (British thermal units) of energy. A BTU is the amount of heat necessary to raise one pound of water by one degree Fahrenheit.

What is the economical value of a BTU? A common metric we should understand, particularly when we pay our utility bills is the kilowatt-hour – the amount of electricity consumed per hour. The KWH can be used to compare the efficiency and cost of wood, coal, oil, and gas. Also we can equate KWH to horsepower and have a common measure between energy usage and costs for our home and car.

Let’s convert fuel energy into a common equivalent. One-kilowatt hour (KWH) equals 3,413 BTUs. One ton of coal produces, on the average, 21.1 million BTUs, which equals 6,182 KWH of electric at a cost of about $36 per short ton (2,000 pounds). That means coal cost less than$0.01 per KWH. To put that into perspective, a barrel of oil at $77/barrel produces 1,700 KWH of electric equating to 60% higher efficiency pound for pound than coal. However, on a cost per KWH basis, oil cost about $0.05 per KWH. Coal’s lower cost per KWH is why it is still used today to generate electric.

Today, the Moosic Mountains who’s 1,940 foot pass became a formidable engineering challenge for transporting coal from Carbondale to Honesdale is adorned with wind mills from Florida Power & Light providing 64.5 megawatts of electric, enough to power 22,000 homes. Florida Power & Light
(FPL) is the largest generator of wind energy in the U.S. The irony is the mountain range with the largest deposits of Anthracite coal in the world and first used to provide electric to New York City, is now hosting windmills to generate electricity for homes and businesses.

Figure 2 Wind Energy
Waymart Wind Energy Center

FPL is one of the growing list of utilities that are adopting alternative energy including wind energy programs in 15 states and offering rebates up to $20,000 for solar photovoltaic residential systems and up to $100,000 for commercial systems. The windmills atop Moosic Mountains produce electric replacing 3,800 tons of coal a year. A ton of coal produces 746 kg (1,644 lb.) carbon, so the windmills save our atmosphere from about 3,131 tons of CO2. The incremental increase in CO2 emissions should be added to the cost of coal because it has significantly higher carbon byproduct per KWH than oil or gas. Carbon content of fossil fuels

The coalmines are closed today along with the railroads and canals. Changes in the economic value of coal impacted numerous towns and villages across the region. Anthracite coal production in Pennsylvania reached its peak in 1917 when more than 100 million tons of coal was mined with the anthracite industry employment reaching its peak in 1914 with about 181,000 workers. Anthracite Coal

The value of coal diminished as demand shifted towards coke for iron and steel and oil became an energy substitute. The Carbondale region with its vast Anthracite coal deposits suffered as a result of falling demand for Anthracite coal. According the World Coal Institute, Anthracite coal has high carbon and energy content, but Bituminous coal accounts for majority of the world coal consumption because it is more abundant while coke is used in the iron and steel industry. World Coal Institute

The Northeastern, PA region experienced an economic shock as Anthracite coal lost its appeal. Demand shifted towards oil at the high end for transportation and the more abundant Bituminous coal at the low end. Anthracite represents only 8% of coal production today with Bituminous accounting for 76% and Lignite 16%. Those communities in Northeastern, PA that were more tightly linked to coal mining fell deeper into financial turmoil as the demand for Anthracite coal declined.

The Bottom Line: the economics of energy determines its use – coal still accounts for approximately half of our electric generation because it has a lower cost than other fuels. However, there are two factors to consider 1) the cost of carbon is not calculated into the full price of coal or other hydrocarbon fuels and 2) the cost of conventional fuel is calculated on a marginal basis while alternative fuel costs are calculated on a fixed cost basis. Meaning the cost of roads, trucks, and mining equipment is not factored into the price of each piece of coal, only the marginal cost of producing each ton of coal. For solar and wind energy systems, the cost to construct the system is factored into the total cost while the marginal cost of producing electric is virtually free. We need a framework to better measure the economics of alternative energy.

Despite the carbon issues surrounding coal, (coal has higher carbon-to-hydrogen ratio in comparison to oil or gas) coal is more abundant and therefore is cheaper than oil. Utilities could migrate to natural gas to reduce carbon emissions, but with a cost of $0.03 per KWH, there is no economic incentive. Alternative energies such as wind and solar could provide a longer economic benefit to users, our environment, and the economy.

Our next step is to develop a framework to measure the fixed and marginal costs of alternative energy.