Vote the Economy by Voting for Energy

Access to energy was instrumental fueling the Industrial Revolution. Over the last 200 years, industrial nations have migrated from wood to coal and now to oil as a source of energy. During the 1700’s, wood was used for just about everything from fuel to constructing houses and building wagons and even tools. As demand for wood increased, the cost of wood rose as deforestation led to the scarcity. The scarcity of wood resulted in deteriorating economics.

It was the availability and access to coal that enabled the growth of Industrial Revolution by providing accessible energy. The Industrial Revolution was predicated upon the availability of Labor, Technology, Capital, and Energy. Scarcity of any of these inputs could undermine economic growth, as was the case with capital during the Great Depression of the 1930’s and the Energy Shock of the 1970’s.

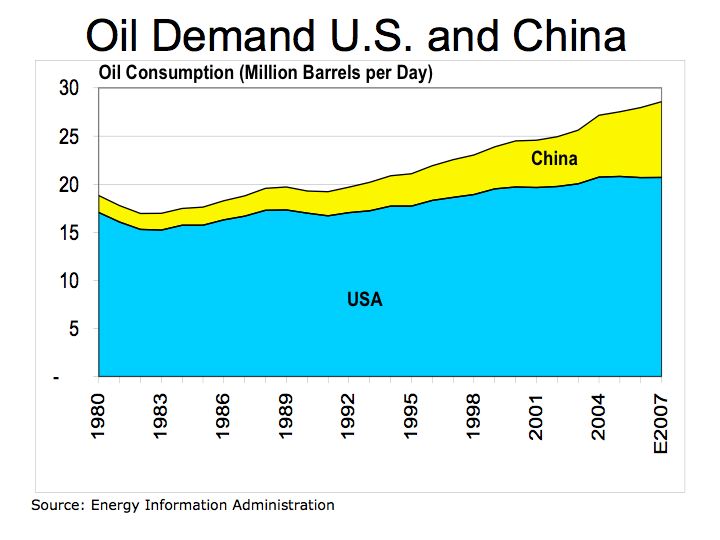
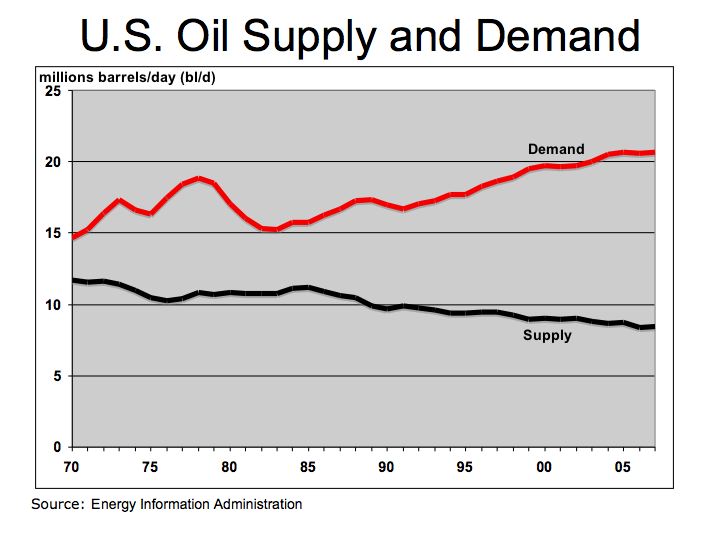
Oil, driven by rapid growth in automobile usage in the U.S, has replaced coal as the main energy fuel. According to the Energy Information Administration (EIA), the 70% of oil consumption in the U.S. is for transportation .

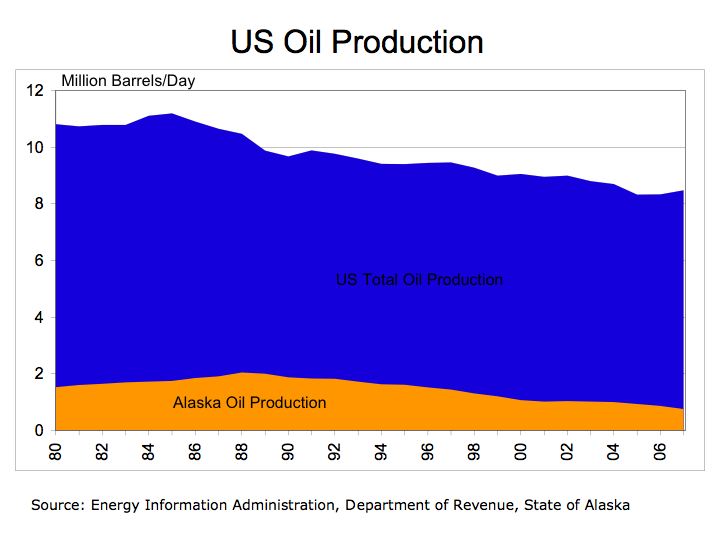
Figure 1 US Oil Imports Oil Imports

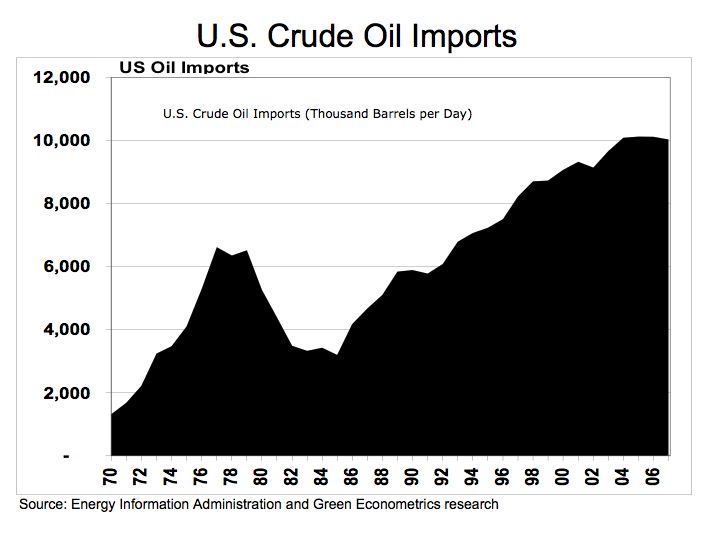
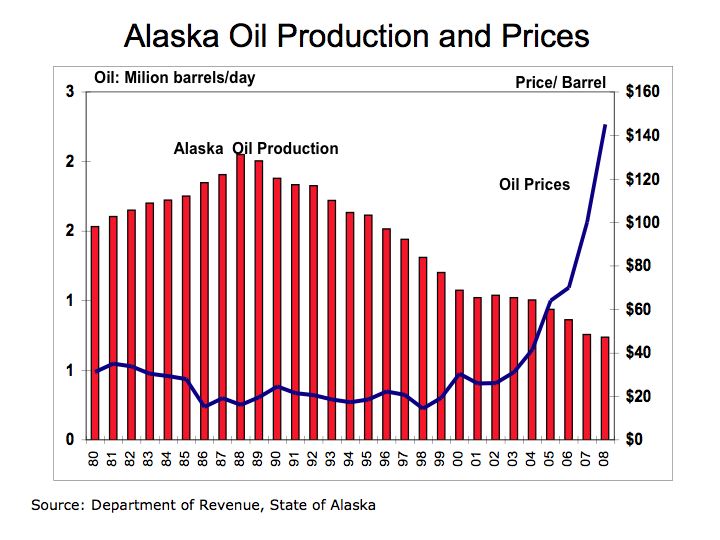
Figure 1 illustrates US historical oil imports, as measured by the Energy Information Administration in U.S. Crude Oil Field Production (Thousand Barrels per Day) that dates back to 1970. The EIA provides oil import data dating back to 1910. To estimate the amount of money the US spends on oil imports every year, we can use the data from the State of Alaska Department of Revenue, which provides historical data on the price of oil an derive an average yearly figure.

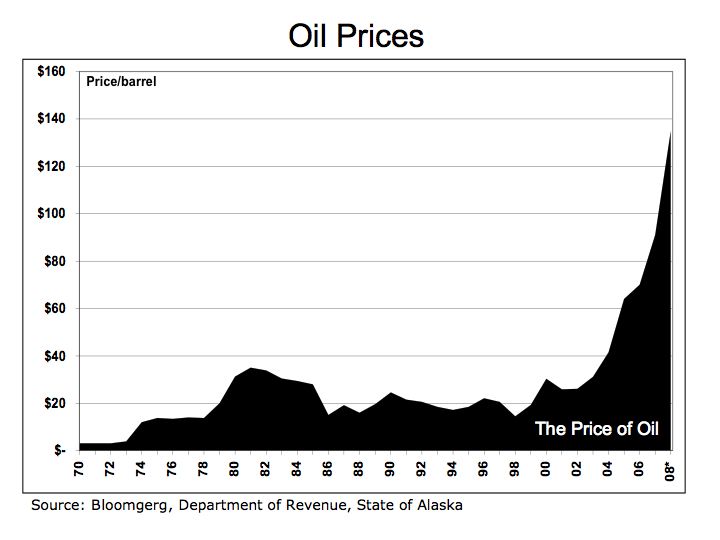
Figure 2 US Oil Import Spending Oil Spending

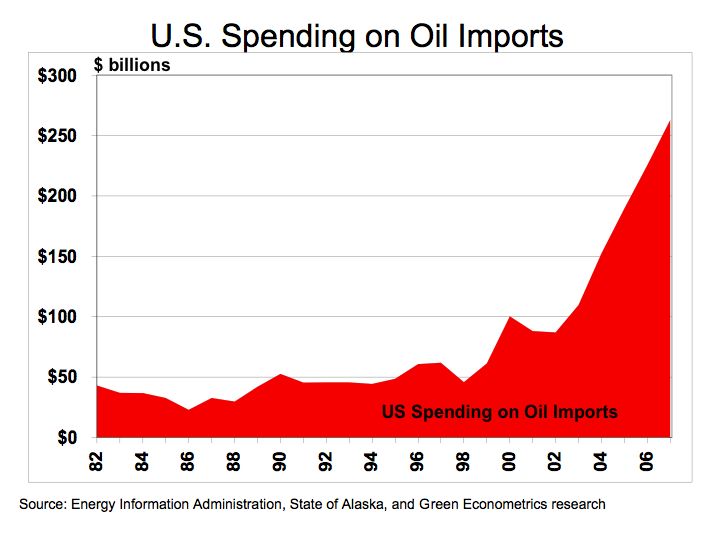
Figure 2. appears quite staggering given the amount of money we send to oil producing countries. The US is spending hundreds of billions to import oil. According to the EIA, the US imported an average of 10,031,000 barrels per day equating to $263 billion in imported oil during 2007 when the State of Alaska measured the yearly average spot price for a barrel of oil at $72.

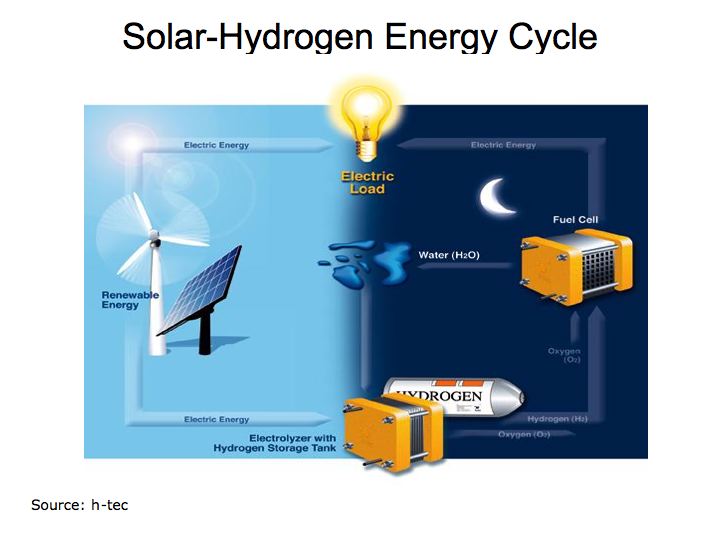
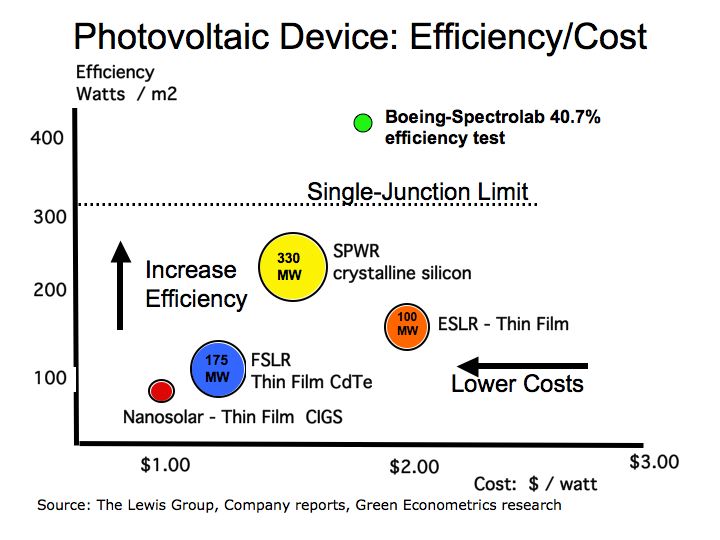
According to Solarbuzz, Germany leads the world in solar photovoltaic (PV) installations with 47% of the market while China increased its market share of PV production from 20% to 35%. The US accounts for 8% of the world solar PV installations. Solarbuzz indicates the global solar PV industry was $17 billion in 2007 and the average cost of solar electricity is $0.2141 per KWH. If a portion of our $260 billion sent to oil producing countries were to be invested into solar energy, perhaps the US would not lag the world in alternative energy.

The bottom line is that the money spent on importing oil has a deleterious impact on our economy and continues our dependence on hydrocarbon fuels producing carbon and other harmful byproducts that negatively impact our climate and health of our children. The longer we are dependent on oil, the longer our economy and environment suffer. Use your vote for alternative energy and not drill baby drill.

”DRILL BABY DRILL” – NO INVEST INTO ENERGY TECHNOLOGY

Using the latest data from the Energy Information Administration (EIA) , oil production remains significantly below historical levels achieved in ‘70’s and ‘80’s. The peak production in 1970 has not been replicated despite significant expansion of drilling activity during the 1980’s.

Oil Drilling and Production

Figure 1 Oil Drilling and Production Oil Production

Figure 1 illustrates US historical oil production, as measured by the Energy Information Administration in U.S. Crude Oil Field Production (Thousand Barrels per Day) that dates back to 1920 juxtaposed against U.S. rig count, as measured by Bakers Hughes. The chart suggests that during the first energy shock to hit the US and the world, drilling activity expanded dramatically. By 1981, weekly North American oil rig count reached a high of 4,530 oil rigs in 1981.

U.S. Crude Oil Field Production reached a peak of 9.6 million barrels per day in 1970. In 1981, the height of US oil drilling, oil production was 8.57 million barrels per day. By 2002, U.S. Crude Oil Field Production was 5.74 million barrels per day. Over the last six years oil production declined 10.7% while over this same period, drilling activity as measured by Baker Hughes’ North American Rigs Running weekly rig count, increased 125%.

The decline in U.S. oil production is quite disturbing. During the last decade, a host of new technologies were introduced to help facilitate oil production. Companies such as Dawson Geophysical Co. (DWSN) that enhanced the market for energy exploration by providing seismic data acquisition services. Dawson Geophysical acquires and processes data using 2-D and 3-D seismic imaging technology to assess the potential of hydrocarbon sources below the earth’s surface.

Companies such as W-H Energy Services Inc. that was recently acquired by Smith International, Inc (SII) , offer an array of drilling services such as horizontal and directional drilling for onshore and offshore oil drilling, and 3-demensional rotary steering drilling systems. Smith Int’l is growing revenues at over 19% annually and Dawson’s revenues are growing 53%. With these oil drilling and energy exploration technologies growing at double rates, and drilling activity expanding at 14%, why is oil production falling?

With the rancor of “drill baby drill’ heard as call to solve the energy crisis, energy technologies such as solar and wind energy solutions deserve greater emphasis. Oil will eventually run out. There is a finite amount of oil in the ground. The Tar Sands will not solve the problem. According to Alberta Energy, sand oil production was 966,000 barrels per day (bbl/d) in 2005 and is expected to reach 3 million bbl/d by 2020. Tar sands would only contribute 3.5% towards our current oil consumption of 84.5 million barrels per day.

The bottom line is that our dependence on oil leaves our economy vulnerable. Energy is the catalyst that enables economic development. The longer we are dependent on importing oil from countries hostile to civilized existence, the more tenuous grows the environment. We need to conserve existing energy use and invest into energy technologies that foster the development of alternative energies, thereby, limiting our dependence on oil period.

Energy Storage – the Key to Alternative Energies

Energy storage enables the electric generated though solar photovoltaic devices or wind turbines to be used when it’s dark, cloudy, or calm. As Nathan Lewis, Professor of Chemistry, Division of Chemistry and Chemical Engineering Lewis Group at California Institute of Technology, framed it, energy storage is integral in facilitating the development of alternative energy programs.

While hydrogen fuel cells offer future promise to our energy storage needs, battery technologies could provide some immediate results. As with all technologies there are tradeoffs.

There are several competing approaches to battery development. Among these approaches include the lead acid, nickel metal hydride, and lithium-ion cells.
Lead acid: batteries are the oldest approach and are typically found under the hood of your car or truck. Nickel metal hydride batteries have been around for more than 25 years and are used in hybrid electric vehicles such as the Toyota Prius. Lithium-ion cells have been on the market since 1991 and are used extensively in cellular phones, laptop computers, and digital cameras.

There are several issues in dealing with batteries such as environmental, economic, power, safety, and useful life. Lithium-ion cells possess many advantages, but incidences such as laptop computers erupting into flames, leaves many concerns for applicability in motor vehicles. Despite the setbacks, lithium-ion technology could provide solutions to the electric vehicle.

Why is this battery technology important? Solving the energy needs of the motor vehicle has profound implications in solving our energy needs. Nearly 70% of our oil consumption is direct towards transportation essentially motor vehicles. Without a dedicated strategy to address the transportation market and specifically the automobile, our progress towards energy independence is an illusion.

There are several issues with the nickel metal hydride batteries currently used in hybrid electric vehicles. Nickel metal hydride batteries are heavy, bulky, require large storage space in the vehicle, and don’t offer great acceleration. Lithium-ion offer power, size, and weight advantages over nickel metal hydride batteries, and numerous companies are working to improve performance and ameliorate the negative connotations associated with flaming laptops.

One of the basic concepts in dealing with batteries is the measure of battery energy versus battery power. The amount of battery energy refers to endurance, how long will the battery last and is often measured in ampere-hours or watt-hours per kilogram of battery weight. The amount of power refers to the energy draw and is akin to delivering acceleration in an electric vehicle.

The following figure illustrates the measurement of battery power and energy. Lithium-ion batteries are differentiated in their ability to bridge the power and energy tradeoff.

Figure 1 Battery Power vs Energy
battery

For home renewable energy projects such as solar or wind energy deployment, it is often recommended that a deep-cycle battery be used. Deep cycle batteries are able to draw down 70%-80% of their full power, offering longer energy life than a typical lead acid battery. In addition, newer materials such as Gel batteries and absorbed glass mat (AGM) that are sealed, maintenance free, and can’t spill, and therefore, are less hazardous. For a tutorial on home use batteries visit
BatteryStuff.com

An interesting perspective on battery design is presented Energy vs. Power by Jim McDowall. For a primer on how batteries work visit presented Battery Power The premise is that there are tradeoffs between designing a battery for high power versus high energy.

Research conducted at Stanford University suggest the battery life of lithium-ion batteries could be extended through the use of Nano-technology. The bottom line: energy storage is paramount to sustaining the development of alternative energies and battery technologies play a critical role in energy storage and further expanding the role of alternative energies.

Energy Crisis- Can we drill our way out?

Rising energy prices and our diminishing supply of oil threaten our national security. Without access to energy our economy and national defense are vulnerable to collapse. As a solution to our energy needs, we hear political rhetoric to expand oil drilling, but our energy strategy requires a long term solution that means embracing alternative/renewable energy technologies such as solar and wind. It only takes a quick review of oil production statistics to realize how formidable the challenge is that we face.

According to the Energy Information Administration (EIA) in 2007, the US consumed 20.6 million barrels of oil per day (bpd) but we were only able to produce 8.5 million bpd, leaving a deficit of approximately 12.2 million bpd. This means the US needs to import 60% of its oil and at a cost of $130 per barrel, the US will spend approximately $600 billion a year on imported oil.

Oil prices have increased dramatically with an increase of 420% since 2001. The combined impact of rising prices and diminishing oil production leaves the US in a precarious position. Yet, drilling for more oil may not rectify this tenuous situation.

As an example, back in the 1980’s, drilling activity in Alaska helped to ameliorate the oil crisis of the 1970’s. Today, oil production in Alaska has declined significantly. From its peak in 1988, oil production in Alaska has decline 64%. In Figure 1, oil production in Alaska in contrasted to the price of oil per barrel from 1980 to June 2008.

Figure 1 Alaska Oil Production
Alaska Oil

When we measure the supply and demand for oil, we find in the US, it is really a supply problem. According to the EIA , US demand for oil is growing at an annual rate of one percent over the last ten years, but oil production is down 20% since 1987.

Figure 2 US Oil Production
Oil

The energy problem however, is global. The demand for oil in the US may slow, yet supply constraints driven by growing consumption in developing countries could exacerbate this already bleak picture. On a per capita basis, the US consumes approximately 25 barrels of oil per person annually or a little over 600 gallons a year. That figure greatly exceeds other countries and particularly those in developing nations such as China.

In China, oil consumption per person is only 2 barrels or 84 gallons a year. However, oil consumption in China on a per capita basis has increased 88% from 1996 to 2006 according to data from the EIA. Despite China’s one percent population growth, at its current oil consumption growth rate, China is expected to double its current oil consumption by 2015 to over 14 million bpd and exceed the US in oil consumption by 2020. China’s current oil appetite suggests that in 14 years China will require an additional 14.6 million barrels per day. Even if oil producing countries are able to produce the additional oil, those countries that are unable to meet their own needs such as the US and China, will continue to be held hostage to oil producing states.

Figure 3 China Oil Consumption per Capita
China Oil

The bottom line: the energy model based on hydrocarbon fuels is broken. Neither drilling for more oil will not satisfy our energy needs nor will corn-based ethanol. We need to rapidly embrace electric vehicles using solar, wind, and fuel cell technologies to provide alternative energy solutions. It time to put energy as the most critical component of our national security. Energy should be front and center for the US election. It’s time to invest into clean and renewable energy solutions.

Energy Crisis – What Can We Do

As energy and food prices set new world records, what can we do at home to avert the crisis? Food prices are rising because corn is diverted from food production to producing ethanol for use as fuel in motor vehicles and is exacerbated by the recent flooding in the Mid West. Oil prices continue to escalate as demand for oil in developing countries increases and supply constraints, rising production costs, and limited refining capacity constrain the supply of oil. These factors continue to weigh against homeowners that will face escalating fuel bills to heat or cool their homes. There are some viable alternative energy solutions including wind and solar as well as home insulation that should offset the rising cost of energy. As far as food for fuel, we need to break our dependence on hydrocarbons which continues to impact our climate and weather and transfer our wealth to oil producing nations

Corn Prices have increased 264% since 2005. The rising price of corn used for ethanol is causing farmers to plant more corn and less production of other grains such as wheat or soy. Lower supply of grains is driving up food prices. Rising food prices is most debilitating to the poor, especially those in developing countries.

Figure 1 Corn Prices
Corn

Growing demand for oil and questions over Peak Oil suggesting even with oil prices rising to such an elevated level, production is rather anemic. According to the Energy Information Administration (EIA) , while oil prices increased 344% since 2001, oil production from OPEC is up only 1.2% over this same period.

Figure 2 Oil Prices
Oil

According to the EIA The demand for oil in China is growing at an 8.1% CAGR over the last five years. With demand for oil growing significantly in developing countries and despite production developments in Saudi Arabia and the 5-to-8 billion deepwater Tupi oil discovery in over Brazil The Tupi announcement in January 2008 is the world’s biggest oil find since a 12-billion-barrel field discovered in 2000 in Kazakhstan according the International Herald Tribune. These new oil discoveries are often in inhospitable areas or deep ocean environments, which makes extraction costly and difficult.

Figure 3 Rig Count and OPEC Oil Production
OPEC

What can we do? . Forget drilling for more oil, electric vehicles and investment into alternative energy is the only way to avert this crisis. OPEC area drilling activity is up 48% since 1998 and yet, despite dramatically higher oil prices, up 5 fold since 1998, OPEC oil production increased only 11% over 1998.

Homeowners could begin to deploy energy saving and alternative energy systems. Wind and solar energy could help reduce some of the pain. As consumer embrace hybrids, electric, and fuel cell vehicles, wind and solar should begin to offer a stronger value proposition. Energy saving tips such as compact fluorescent bulbs, on-demand hot water heaters, and thicker home insulation products should help reduce heating and cooling costs.

According to the American Wind Energy Association AWEA a turbine owner should have at least a 10 mph average wind speed and be paying at least 10 cents per Kilowatt-hour (KWH) for electricity. There are electric utility and tax credits available in some areas. There are also questions regarding zoning restrictions, and whether to connect to batteries for energy storage, or directly to your electric utility. Consult the Wind Energy Resource Atlas of the United States Wind Resource Maps to get a better understanding of wind speeds in your area.

Cost wind systems will vary depending on model and installation costs will vary by your location. The Whisper 500 from Southwest Windpower offers electric production of 538 KWK/month at 12 mph (5.4 m/s). The system weighs 155 lb (70 kg) and has blade span of 15 feet (4.5 m) and must be mounted on a tower in cement. At 538 KWH per month, that is enough energy to cover the needs a modest house with conservative electric usage. Small wind systems can range from under $1,000 to over $20,000 with a payback period of approximately five years depending on wind resources and utility rates.

Solar photovoltaic (PV) panels cost an average of $4.80 per watt according to Solarbuzz which is about $0.24 per KWH over a 20 year life of the PV system. With an average output of approximately 10.6-watts/square foot (114 w/m^2), a five KW PV systems would cover 515 square feet (47.8 sq. meters) costing approximately $36,000 before credits and tax benefits and produce about 490 KWH per month. Of course installations costs are extra, but with PV production ramping and new PV suppliers entering the market we can expect costs to decline. Federal and local tax credits as well as selling unused electric to your local utility offers economic value on the margin.

The economic value is expected to increase as costs decline and electric rates increase and we can expect significantly higher utility rates in the near future. The economics of zero carbon emissions is not even measured as a benefit to the consumer. We are just beginning to see the cost impact of extreme weather and climate change.

Consumers should try to ameliorate the rising cost of energy by investing into solar and wind. There are several companies offering complete installation services. Among these include: Akeena Solar (AKNS) in California and The Solar Center in New Jersey.

The bottom line: energy and food prices are creating a crisis for consumers globally and there are several initiatives that could help minimize the pain. In addition, the erratic weather patterns around the world may be just a prelude to climate changes due to the impact of carbon dioxide on climate, which may cost us much more in the long run. Let’s stop the drain of wealth cause by oil and invest into clean and renewable energy solutions.

Peak Oil – Time for Investments into Alternative Energy

The question of Peak Oil, first proposed by Dr. M. King Hubbert can best be illustrated by analyzing the supply and demand for oil. With use of statistics complied by Energy Information Administration (EIA) , the tenuous position our energy needs becomes more apparent. Let’s examine the latest data from the EIA to provide a picture of the global demand and supply of oil.

Oil Demand

Figure 1 Oil Demand U.S. and China
Oil Demand

From Figure 1 we can see that while the demand for oil in the U.S. has grown at a rather moderate rate in comparison to China. The demand for oil in the U.S. declined at an average annual rate of 0.4% during the 1980’s. U.S. oil demand has averaged at a 1.5% compounded annual growth rate (CAGR) during the 1990’s and 1.0% in the last five years since 2001.

In China, demand for oil is grew at 2.7% CAGR during the 1980’s and increased to 7.6% in the 1990’s. Since 2001, the demand for oil in China is growing at an 8.1% CAGR over the last five years. The strong demand for oil from China is remains unabated and is driven by growing motor vehicle usage. In nine years, at its current growth rate, China’s oil consumption will exceed the level of oil consumption the U.S. had in 1991 and in twelve years exceed our current level.

Figure 2 Oil Demand in China
China Oil

Figure 2 illustrates that the demand for oil in China is quite substantial. With the rate of growth in oil consumption in China exceeding 8% it won’t take very long to exacerbate our tenuous current energy position. Perhaps a review of oil production will shed some light on the topic.

Oil Supply

The following graphs provide a review of oil supply from the Middle East, Saudi Arabia, OPEC, Russia and surrounding Eurasia countries including the former Soviet Union.

Figure 3 Oil Production Middle East and Saudi Arabia
Saudi OIL

While oil production contracted somewhat during the 1980’s, oil production in the Middle East and Saudi Arabia has grown since 1980, but recent oil production appears constrained. Oil production in the Middle East is up 3.1% on a CAGR during the 1990’s, and has remained at that level since 2001. Saudi oil production grew 3.0% during the 1990’s, but has dropped slightly to 2.1% since 2001.

Meanwhile, among the countries of the former Soviet Union, we see oil production gaining strength. In the countries comprising the former Soviet Union (Eurasia), oil production is up 6.7% on a CAGR since 2001.

Figure 4 Oil Production Eurasia, Middle East and Saudi Arabia
Oil ME

Currently OPEC accounts for approximately 37% and Saudi Arabia 11% of the world’s oil production. Saudi Arabia is recognized as having the largest oil reserves in the world and its Ghawar oil field is the single most productive oil field in the world, according to a recent article in the Wall Street Journal . “Saudis Face Hurdle in New Oil Drilling” The Saudis are developing new fields such its Khurais field, but are finding production efforts challenging as they employ deep horizontal drilling and water injection to achieve production. Given what we glean from the EIA production statistics, achieving moderate oil production growth maybe more of a challenge then we think.

Figure 5 Monthly Oil Production
Monthly Oil

The bottom line is that our dependence on oil leaves us vulnerable not only to supply disruptions but also in trying to protect supply in countries that gravitate towards violence and terrorism. If more global efforts were employed to develop alternative energies, we could limit our dependence on oil, improve global economics by offering affordable energy to the world, and save our environment and climate – a small step for our planet.

Blame high food and energy prices on the White House

With the infinite wisdom of the White House and U.S. Congress, food prices are now directly tied to the price oil. The price of corn-based ethanol is now determined by the price of gasoline that it substitutes in motor vehicles and that price is established by supply and demand for oil. The price of gasoline at your local gas station or convenience store is based on the price of oil. And now that the price of corn is rising because it is tied directly to oil, the price of other grains and subsequently, prices along the entire food chain are rising.

Corn Prices have increased 166% since 2005. The rising price of corn that is used to produce corn ethanol is causing farmers to direct their limited resources to grow more corn, which means other grains such as wheat or soy become scarce and their prices rise. The growing scarcity of grains for food products is raising price across the food chain. Developing a renewable energy solutions based on diverting food as a substitute for expensive gasoline forces food supplies to become scare and expensive.

It is the supply and demand for gasoline and diesel fuels that establishes the price at the pump. When corn ethanol is substituted for gasoline, prices tend to gravitate towards a mean price that continues to rise to keep pace with the escalating price of crude oil now over $110 per barrel. Corn prices are inextricably linked to oil prices and in turn; corn prices impact other grain prices that means it cost more to feed your family or to feed livestock and forces those prices higher.

The rise in corn prices is illustrated in Figure 1.

Figure 1 Corn Prices
Corn Prices

Irrespective of the timing of Peak Oil, a long-term energy strategy is required. The days of cheap oil are over. Remember how oil production in Alaska helped ease the U.S demand for foreign oil a couple of decades ago. Oil production in Alaska declined by nearly 75 percent from its peak in 1987 according a Washington Post article back in 2005. In November 2007, the Petroleum News indicated production in Alaska is expected to decline further in the future. The U.S. depends on oil production in the Gulf of Mexico for about 25% of our supply, according to the Department of Energy which is why the impact from Hurricane Katrina was so devastating.

Diminishing supply and rising demand suggests oil prices should continue to remain elevated. The rising motor vehicle usage in China (China Motor Vehicle Registration)
and India continues to influence the demand for oil.

Figure 2 Vehicle Registrations in China
China Vehicles

Figure 2 and Figure 3 illustrate the rising use of motor vehicles in developing countries. This trends should continue and in turn, increase the demand for oil.

Figure 3 Automobile Sales in India
Cars India

Maybe we should look to some leading countries in the development of alternative energy strategies. Perhaps we can learn from Norway’s HyNor Project. Solar photovoltaic projects being lead by Germany
and Spain.

So the next time you fill your tank or when you’re at your local food store and find that your wages don’t quite cover your food bill, ask your local Congressional representative for better planning on alternative energy strategies and solutions. Investment and research into solar, wind, electric vehicles, and hydrogen energy could provide real solutions by addressing energy needs, climate concerns, the environment, and food prices.

Oil Tax could Facilitate Alternative Energy Development

Oil continues to trade above $100 per barrel with the NYMEX CRUDE FUTURE closing at $101.84 on the last day of February 2008 and the US House of Representative passes legislation to raise $18 billion in new taxes for Big Oil to foster development of alternative energies. While President Bush plans to veto the legislation and Republicans claim the legislation unfairly impacts the oil industry, let’s look at the numbers. The legislation calls $18 billion tax over the next ten years so the impact amounts to $1.8 per year. The oil demand is approximately 20.6 million barrels per day according the to latest data from the Energy Information Administration. With oil at $100 per barrel the US will spend about $2 billion a day on oil and that equates to over $750 billion a year. In comparison to the total amount of oil we use, the tax is about 2/10th of one percent.

Figure 1 US Oil Supply and Demand
US OIL

Well maybe that’s not a fare comparison. The bill, H.R. 6, the CLEAN Energy Act. would roll back two tax breaks for the five largest U.S. oil companies and offer tax credits for energy efficient homes and gas-electric hybrid vehicles.
According to the CNN article, the money to be collected over the 10-year period would provide tax breaks for solar, wind and other alternative energies and for energy conservation. The legislation was approved 236-182, and is expected to cost the five largest oil companies an average of $1.8 billion a year over that period, according to an analysis by the House Ways and Means Committee. So in other words this bill just repeals tax breaks given to Big Oil to become more competitive in the global market.

Figure 2 Oil Prices and World Rig Count
OIL PRICES

So what is the $1.8 in tax impact on Big Oil? Let’s just look at the impact this would have if just Exxon Mobil Corp (XOM) had to endure the tax only. Exxon Mobil generated $404 billion revenues in 2007, which means if Exxon had to face this tax only, it would be less than ½ of 1% of revenues. Considering that some states impose a 6% sales tax on consumers, a tax impact of 0.2% on the largest oil companies seems rather innocuous.

If the world has to depend upon OPEC oil production, questions do arise over the expansion of oil production and OPEC’s willingness to supply oil despite oil over $100 per barrel. As figure 3 illustrates production among OPEC nations is faltering. Could this be a prelude to Peak Oil?

Figure 3 OPEC Oil Production
OPEC Oil

The bottom line is that without incentives and further research on alternative energies, the world continues to be held hostage to oil and hydrocarbon fuels which are directly linked to rising CO2 levels and climate change.

Hydrogen Fuel Cells – energy conversion and storage

World oil demand continues to rise despite efforts to limit demand. Renewable energies such as solar and wind have the potential to limit our dependence on hydrocarbon fuels, but one issue remains prominent – storing energy. While the sun provides radiation for solar and generates wind, when its cloudy or dark we are unable to produce solar energy. One must provide a means to store that energy for when it is needed. Fuel cells enable energy conversion and fill a reliable role in alternative energy strategies.

A chart compiled by Wasserstoff-Energie-Systeme GmbH (h-tec) provides an easy to understand depiction of how fuel cells integrate with solar and wind energy solutions. Fuel cells provide the enabling technology that allows hydrogen to serve as the storage and transport agent. The solar energy that is produced during the daylight hours is used in an electrolyzer to produce hydrogen that in turn, is then used to operate the fuel cell producing electricity at night when it is needed. This process is called the solar-hydrogen energy cycle. Figure 1 illustrates the importance of energy storage in adopting alternative energies.

Figure 1 Solar-Hydrogen Energy Cycle
Energy Cycle

Demand for oil and hydrocarbon fuels continues to grow despite effort to conserve. Total Petroleum Consumption shows increasing oil demand from China and India while demand in the U.S. grows at a slower pace. With improving efficiencies and lower production costs, fuel cells could provide a solution to our appetite for oil in motor vehicles. Figure 2 describes how fuel cells and electrolyzers (fuels running in reverse) work.

Figure 2 Fuel Cells
Fuel Cells

Fuel cells are devices that convert chemical to electrical energy – in essence; it’s an electrochemical energy conversion device. In the chemical process of a fuel cell, hydrogen and oxygen are combined into water, and in the process, the chemical conversion produces electricity. In the electrolyzer, an electrical current is passed through water (electrolysis) and is the reverse of the electricity-generating process occurring in a fuel cell.

Hydrogen fuel cells offer tremendous opportunity for storing and transporting energy enabling broad applications for home, business, motor vehicle and large-scale energy projects. The follow provides a review of current technologies applicable to hydrogen fuel cells. Factors to consider in using hydrogen fuel cells include operating efficiency, operating temperature range, and material used for the electrolyte (the catalyst that separates hydrogen) and fuel oxidant (that transfers the oxygen atoms).

Figure 3 Hydrogen Fuel Cell Technologies
FC Technologies

One of the most practical fuel cell technologies for motor vehicle use include Proton Exchange Membrane (PEM) because it operates at normal ambient temperatures and offers high electrical efficiency. There are several useful web sites that illustrate the benefits of hydrogen fuel cells. h-tec and the National Renewable Energy Laboratory provide some very useful information on hydrogen fuel cells.

We are also seeing progress on fuel cell vehicles that could ultimately ameliorate are demand for oil, if not eliminate it entirely, all with no carbon dioxide or other harmful emissions. We see most major automakers developing hydrogen powered fuel cell vehicles. GM is making progress introducing several models using GM’s Fuel Cell Technology.
Honda’s experimental hydrogen refueling station in Torrance, CA uses solar to produce hydrogen for their hydrogen fuel cell vehicle Honda’s FCX .

The bottom line is that the availability of cheap oil is on the decline and without further research on alternative energies we may find the global economy in a very tenuous position. Further research into solar and hydrogen fuel cells could significantly reduce our dependence on oil.

The Economics of Energy – why wind, hydrogen fuel cells, and solar are an imperative

From the Industrial Revolution we learned that economic growth is inextricably linked to energy and as a result, our future is dependent upon equitable access to energy. When the Stourbridge Lion made entry as the first American steam locomotive in 1829 it was used to transport Anthracite coal mined in nearby Carbondale, PA to a canal in Honesdale that in turn linked to the Hudson River and onto New York City. Coal fueled the growth of New York and America’s Industrial Revolution because coal was cheap and more efficient than wood.

Advances in science and technology gave way to improvements in manufacturing, mining, and transportation. Energy became the catalyst to industrial growth. Steam power such as Thomas Newcomen’s steam powered pump in 1712 developed for coal mining and James Watt’s steam engine in 1765 were initially used to bring energy to market.

In terms of heating efficiency, coal at the time offered almost double the energy, pound for pound, in comparison to wood. Energy Units and Conversions KEEP Oil offers higher energy efficiencies over coal and wood, but as with most hydrocarbon fuels, carbon and other emissions are costly to our economy and environment.

With rapid growth in automobile production in the U.S., oil became the predominant form of fuel. According to the Energy Information Administration, in 2004 the U.S. spent over $468 billion on oil.

Figure 1 U.S. Energy Consumption by Fuel
Energy Consumption

We all need to become more conversant in understanding energy costs and efficiency and as a corollary, better understand the benefits of renewable energy such as solar, wind, and hydrogen fuel cells. A common metric we should understand is the kilowatt-hour (KWH) – the amount of electricity consumed per hour. The KWH is how we are billed by our local electric utility and can be used to compare costs and efficiency of hydrocarbon fuels and alternative energies.

One-kilowatt hour equals 3,413 British Thermal Units (BTUs). One ton of Bituminous Coal produces, on the average, 21.1 million BTUs, which equals 6,182 KWH of electric at a cost of about $48 per short ton (2,000 pounds). That means coal cost approximately $0.01 per KWH. To put that into perspective, a barrel of oil at $90/barrel distilled into $3.00 gallon gasoline is equivalent to 125,000 BTUs or 36.6 KWH of energy. Gasoline at $3.00/gallon equates to $0.08 per KWH. So gasoline at $3.00 per gallon is eight times more expensive than coal.

Is oil and gasoline significantly more efficient than coal? Let’s compare on a pound for pound basis. A pound of coal equates to about 10,500 BTUs or approximately 3.1 KWH per pound. A gallon of gasoline producing 125,000 BTUs weighs about 6 pounds equating to 6.1 KWH per pound (125,000 /3,413 /6). While gasoline is almost twice as efficient as coal, coal’s lower cost per KWH is why it is still used today to generate electric.

The Bottom Line: the economics of energy determines its use – coal still accounts for approximately half of our electric generation because it has a lower cost than other fuels. However, there are two factors to consider 1) the cost of carbon is not calculated into the full price of coal or other hydrocarbon fuels and 2) the cost of conventional fuel is calculated on a marginal basis while alternative fuel costs are calculated on a fixed cost basis. Meaning the cost of roads, trucks, and mining equipment is not factored into the price of each piece of coal, only the marginal cost of producing each ton of coal. For solar, hydrogen fuel cells, and wind energy systems, the cost to construct the system is factored into the total cost while the marginal cost of producing electric is virtually free. We need a framework to better measure the economics of alternative energy. The impact of carbon on our climate and global warming are clearly not measured in the costs of hydrocarbon fuels nor is the cost of protecting our access to oil such the cost the Iraq War.

Despite the carbon issues surrounding coal, (coal has higher carbon-to-hydrogen ratio in comparison to oil or gas) coal is more abundant and therefore is cheaper than oil. As electric utilities in 24 states embrace alternative energies through such programs as Renewable Portfolio Standards (RPS), perhaps the benefits of alternative energies will begin to combat the negative economics of hydrocarbon fuels.

Ethanol offers short-term solutions, but corn-based ethanol is not the answer

Ethanol may emit less CO2 and help reduce the demand for foreign oil in the short term, but ethanol and in particular, corn-based ethanol raises food prices, is less efficient than gasoline, diesel, and biodiesel, and is not a substitute for oil.

According to research compiled by National Geographic Magazine , the energy balance of corn ethanol, (the amount hydrocarbon fuel required to produce a unit of ethanol) is 1-to-1.3 whereas for sugar cane ethanol the ratio is 1-to-8. This suggests corn-based ethanol requires significantly more energy to produce than sugar cane ethanol. Corn ethanol is only marginally positive.

A major issue with corn ethanol is its impact on corn prices and subsequently, food prices in general. It is the price of oil that is impacting the price of corn because nearly all ethanol produced in the U.S. is derived from corn. Therefore, corn prices are inextricably linked to oil prices as well as to the supply and demand of corn as food and feedstock. Corn Prices while volatile and impacted from weather and other variables appear to follow the rising price of oil as illustrated in Figure 1. In turn, corn prices are also influencing other commodity prices where corn is used for feed for livestock.

The rising motor vehicle usage in China and India is escalating the already tenuous situation in the oil markets. With ethanol tied to oil prices we are beginning to see corn prices exacerbate the inflationary pressures at the retail level. Over the last year consumers are paying more for food with large increases in the prices of eggs, cereal poultry, pork, and beef which are tied to corn.

Figure 1 Corn Prices
Corn Prices

Senate legislation for Renewable Fuels Standard calls for ethanol production to increase to 36 billion gallons by 2022 with 21 billion derived from as cellulosic material such as plant fiber and switchgrass . Corn is expected to comprise 42% of the ethanol production in 2002 from virtually all today. The fact is that ethanol production at its current level of 6 billion gallons equates to only 4% of our gasoline usage and is already impacting food prices. Gasoline consumption in 2005 amounted to 3.3 billion barrels or 140 billion gallons. Current estimates put gasoline consumption at 144 billion gallons a year in 2007. Even if vehicles could run entirely on ethanol, there is not enough corn harvest to substitute our demand for oil. We need a cohesive and coordinated effort using multiple technologies to develop alternative energies to reduce our dependence on foreign oil.

Performance

According to Renewable Fuels Association ETHANOL FACTS:
ENGINE PERFORMANCE,
ethanol offers higher engine performance with octane rating of 113 in comparison to 87 for gasoline and has a long history in the racing circuit. In 2007, the Indy Racing League, sponsors of the Indianapolis 500 started using ethanol in racecars. However, the higher engine performance may come at a cost of lower fuel efficiency.

Table 1 Specific Energy, Energy Density & CO2
Specific Energy

Efficiency

Gasoline offers 56% higher energy efficiency (specific energy) over ethanol as measured by kilo-joules per gram (kj/g). (As a reference: 1 kilowatt-hour = 3,600 kilojoules = 3,412 British Thermal Units) Biodiesel with 35 kj/g is 33% more energy efficient than ethanol at 24.7 kj/g.

In terms of energy density, ethanol would require larger storage capacity to meet the same energy output of gasoline diesel, and biodiesel. Ethanol requires a storage tank 48% larger than gasoline and 41% larger than diesel for the same energy output.
Please see Hydrogen Properties and Energy Units

For a quick review of Specific Energy and Energy Density – (Molecular Weight Calculator) the specific energy of a fuel relates the inherent energy of the fuel relative to its weight and is measured in kilo-joules per gram.

CO2 Emission

The molecular weight of CO2 is approximately 44 with two oxygen molecules with an approximately weight of 32 and one carbon atom with a weight of 12. During the combustion process, oxygen is taken from the atmosphere producing more CO2 then the actual weight of the fuel. In the combustion process a gallon of gasoline weighing a little over six pounds produces 22 pounds of CO2.

CO2 emission is a function of the carbon concentration in the fuel and the combustion process. During combustion ethanol produces approximately 13 pounds of CO2 per gallon. Gasoline and diesel produce approximately 22 and 20 pounds per gallon, respectively. CO2 emissions per gallon appear quite favorable for ethanol. However, the results are less dramatic when CO2 emissions are compared per unit of energy produced.

Figure 2 CO2 per KWH
CO2 / KWH

When measured in pounds of CO2 per kilowatt-hours (KWH) of energy, the results show ethanol producing 6% less CO2 than diesel or biodiesel and 5% less than gasoline. In the case of ethanol, the lower specific energy of the fuel negates the benefit of its lower CO2 emissions. Meaning more ethanol is consumed to travel the same distance as gasoline or diesel thereby limiting the benefit of its lower CO2 emissions.

The bottom line is ethanol does not ameliorate our dependence on foreign oil and while it demonstrates higher performance for racecars, it is still less efficient than gasoline diesel, and biodiesel, and diverts food production away from providing for people and livestock. The reality is there are special interest groups that obfuscate the facts about ethanol for their own benefit. The real solution to our imminent energy crisis is alternative energies including cellulosic ethanol, solar, hydrogen fuel cells, and wind.

Energy Shocks: Peak Oil Question

Peak oil has been a discussion for several decades after the theory developed by Dr. M. King Hubbert was put forth to alert the world of the impending decline in oil production. Recent data from the Energy Information Administration (EIA) oil production from the twelve members of OPEC has declined from its peak in 2005, despite increased global drilling activity.

Figure 1 OPEC Oil Production
OPEC Oil

Higher oil prices is driven demand for energy exploration and drilling is up significantly in the U.S. and the world according to Baker Hughes Worldwide Rig Count. Oil price continue to remain above $90/barrel and despite the increased oil drilling activity, oil production remains relatively flat.

Figure 1 demonstrates the tenuous nature of OPEC oil production with oil production declining almost 4% from the peak average production of 31.2 million barrels per day. One must remember that oil production is variable with up and down trends over time. However, with oil over $900 a barrel we are not seeing significant production increase despite the rise in oil drilling. Figure 2 illustrates world-drilling rigs in comparison to oil prices on a global basis. The U.S. accounts for over half the world oil drilling rigs yet our production is less than 10% of total global production.

Figure 2 Rig Count and Oil Production
Rig Count and Oil Production

What does all this mean? For one peak oil may be a reality or sooner then we like. Secondly, with concern over climate change and global warming, there is no real spending on alternative energy to help mitigate a potential shortage in oil. More spending on solar and hydrogen fuel cells is required to ameliorate the eminent disruption in oil flow. Without an orchestrated government mandate to develop alternative energies all nations face a national security issue that has the potential to cripple economic activity.

The Importance of Energy to Economic Growth

A brief review of history and in particular the industrial Revolution, it’s quite apparent that economic growth is inextricably linked to energy. As energy is tied to our economy, our future is dependent upon equitable access to energy. This in turn sets the framework of our dependence on oil and hence, why our national security is tied to securing the flow of oil.

Eighteenth-Century England gave birth to the Industrial Revolution. Four critical components provided the framework enabling the Industrial Revolution: Labor, Technology, Risk Capital, and Energy

Improving efficiencies in agriculture lead to an increase in the food supply while minimizing the amount of labor required to cultivating crops. The improving agriculture efficiencies lead to population growth and an available labor force that began to migrate to the cities.

Advances in science and technology gave way to improvements in manufacturing, mining, and transportation. It was the harnessing of steam power such as Thomas Newcomen’s steam, powered pump in 1712 for coal mining and James Watt’s steam engine in 1765 that lead to railroads and machinery.

Risk capital was also an important element for the development of the Industrial Revolution. Risk capital and the entrepreneurial spirit that allowed capital to be applied innovation helped transition England into the largest economy in the world.

And Energy. Access to an available source of energy was instrumental fueling the Industrial Revolution. With wood being used for just about everything in the early 1700’s from housing, wagons, tools, and fuel, deforestation lead to energy scarcity. It was coal that enabled the growth of Industrial Revolution by providing an accessible energy source.

With rapid growth in automobile production in the U.S., oil became the predominant form of fuel. According to the Energy Information Administration, in 2004 the U.S. spent over $468 billion on oil. Given that we import nearly 60% of the oil we consume, most of our wealth travels abroad. More emphasis on alternative energies could help ameliorate our dependence on oil.

Figure 1 U.S. Energy Consumption by Fuel
Energy Consumption

While solar and wind energy have seen some very strong growth, alternative energy still account for less then 2% of our global energy production.

We need to realize that our dependence on oil could cripple our economy. Supply constraints or disruption to oil flow could derail economic activity. It should be an imperative for our national security to develop alternative energies.

Energy Shocks: Vulnerability Update

Rising oil prices have driven exploration and drilling activity, yet oil production remains anemic in comparison. Could the latest data suggest oil production is nearing a peak? With global demand expected to rise over 30% by 2030 according to a recent article in the Wall Street Journal, Handicapping the Environmental Gold Rush the latest oil production figures suggest we are indeed vulnerable to energy shocks.

High oil prices have driven demand for energy exploration and investment into oil and gas drilling rigs. In the U.S., rig count is up 181% with 1,749 rigs in operation in 2007 from 622 in 1999 according to Baker Hughes Worldwide Rig Count. Oil prices are up quite dramatically in the last few weeks with latest price above $94/barrel.

Figure 1 Worldwide Rig Count and Oil Prices
Worldwide Rig Count

Figure 1 illustrates world-drilling rigs in comparison to oil prices. The U.S. accounts for over half the world oil drilling rigs yet our production is less than 10% of total global production. While oil prices are nearly as high as they were back in the 70’s (accounting for inflation) we are not witnessing the tremendous oil-drilling explosion as we did back then.

Part of the explanation could lie with oil production. If we look at recent data, oil production appears to be leveling off while demand is expected to increase significantly as developing countries increase their use of motor vehicles. Data from the U.S. Department of Energy (DOE) and Ward’s Communications, Ward’s World Motor Vehicle Data show that the number of motor vehicle on the road is up 48% from 1990 to 2005 with countries like China experiencing the most dramatic increase. Yet oil production over this same period is up only 27%.

Figure 2 US Rig Count and Oil Production
Rig Count and Oil Production

In the U.S., rig count is up 118% from 1999, yet petroleum production is actually down 7%. On a global basis, oil and petroleum product production increased 13% since 1999 while global rig count increased 112%. The U.S. and the rest of the world is experiencing diminishing returns on investments in oil production wile usage, led by motor vehicle consumption continues to escalate. In the U.S. more than 60% of oil consumption goes to vehicle use.

With all of the attention given to oil and hydrocarbon fuels, alternative energies are just a small fraction of our energy needs. We need to dramatically increase our research efforts into alternative energies such as solar, wind, and hydrogen fuel cells energies.

Solar and Hydrogen Energy – where vehicle fuel efficiency is headed

Despite efforts that have enabled the U.S. to limit its demand for oil, world oil demand is up significantly. Advances in technology such as solar energy and vehicle fuel cell could help the world reduce its dependence on oil.

Figure 1 Oil and Gold Prices
Oil Prices

The U.S. Department of Energy (DOE) and the U.S. Environmental Protection Agency (EPA) today released the Fuel Economy Guide for 2008 model year vehicles Fuel Economy Leaders: 2008 Model Year Coming in first place is the Toyota Prius (hybrid-electric) with city/highway miles per gallon (MPG) of 48/45. With higher fuel costs more people are factoring in fuel efficiency into their purchase decision. However, it is the purchase of pickup trucks and SUV that account for most of the vehicle purchases in the U.S. and these vehicles are dramatically less fuel-efficient than hybrids and small four-cylinder automobiles.

Despite the trend towards larger vehicles, the U.S is not experiencing a rapid rise in oil demand. Yet oil prices continue to climb. While geopolitical risk may account for the bulk of the recent price increase, latest information from the U.S. Energy Information Administration (EIA) Total Petroleum Consumption shows increasing oil demand from China.

Figure 2 Oil Demand: U.S. and China
Oil Demand

Figure 2 illustrates that while oil demand in the U.S. has grown only modestly since 2000, the growth in China’s oil demand is rising rapidly. The recent data from the EIA shows oil demand through Q2/07. The demand for oil in the U.S. is up 5% from 2000 while in China oil demand is up 59% over the same period.

Improving vehicle fuel efficiency may abate rapidly rising oil demand in the U.S., but more emphasis on diesel and hybrids could take us a lot further. For example, Toyota has been slow to introduce its diesel line of pickup trucks in the U.S. while it offers a broad line of more fuel-efficient vehicle outside the U.S. Toyota offers several cars and trucks in Europe with impressively high fuel efficiencies that are not available in the U.S. Infact, the Toyota Hilux two-wheel drive pickup truck offers a four-cylinder diesel engine with an MPG of 44.8 on the highway and 29.1 in the city.

We are also seeing progress on fuel cell vehicles that could ultimately ameliorate are demand for oil, if not eliminate it entirely, all with no carbon dioxide or other emissions. We see most major automakers developing hydrogen powered fuel cell vehicles. Honda for one has the right concept in employing solar energy to make hydrogen.

Honda’s experimental hydrogen refueling station in Torrance, CA increases the solar incre3ases the efficiency of hydrogen fuel by using solar energy to produce hydrogen. The hydrogen is then used to power Honda’s Honda’s FCX concept hydrogen fuel cell vehicle with the only emission being pure water vapor. These fuel cell vehicles may not be ready for prime time, they provide a clear reality to what is achievable.

The bottom line is that supply and demand dictate price and the availability of cheap oil is on the decline. Further research into solar and hydrogen fuel cells could significantly change our dependence on oil.

Economics of Solar Energy – price parity and efficiency: Are we there yet?

With the Solar Decathlon is taking place in Washington DC today promoting commercially available solar energy technology and oil prices pushing to an all time high of $84/barrel, where are we in terms of cost parity with hydrocarbon fuels. Advances in solar energy technology, lower production costs, and rapidly rising oil costs could bring solar energy into parity with hydrocarbon fuels within five years.

The cost of solar energy remains prohibitively high at about $0.45 per kilowatt-hour (KWH) for an installed system. (a kilowatt-hour equals a 100-watt light in operations for 10 hours and equals 3,412.14 British Thermal Units – BTU) As a reminder, there is significant variance in cost per KWH ($0.23-to-$0.68) because a solar energy system is dependent upon daily available sunlight, which varies from about two hours a day in Alaska to almost six hours in Arizona. Solar energy costs are based on data from solar photovoltaic (PV) supplies SunPower (SPWR) and Sharp Solar.

In comparison to hydrocarbon fuels, one gallon of gasoline has an energy value equal to approximately 125,000 BTUs and cost around $3.00/gallon. The energy value of a gallon of gasoline equates to 36.6 KWH, therefore its price is about $0.08 per KWH. So there is significant disparity between gasoline at $0.08/KWH and solar energy at $0.45.

Fortunately, there are a number of initiatives seeking to improve the economics of solar energy. When we measure the cost of solar energy in dollars per watt we find a complete solar energy systems cost around $8.90/watt. (If we amortize the $8.90/watt over a twenty year expected life of a solar energy system, it amounts to $0.45/KWH) To improve the economic value of solar energy we can lower production costs and/or improve solar efficiency in terms of raising the KWH of electric produced per solar panel.

From the Lewis Group. at Caltech, we learned about several technological approaches to improving solar energy efficiency. Among some of the leading solar technologies are multi-junction semiconductor cells and solar concentrators. In a multi-junction cell, individual cells are made of layers, where each layer captures part of the sunlight passing through the cell. One of the key limits to solar efficiency are the semiconductor band gaps where excess solar energy is lost to heat instead of being converted to electric. Solar concentrators amplify available sunlight and increase the watts per square meter per solar panel.

Last year the Department of Energy reported that solar energy achieved a new record in efficiency performance. The news release, New World Record Achieved in Solar Cell Technology. suggesting that solar concentrators and multi-junction PV cells could surpass the Shockley-Queisser single-junction solar efficiency limit of approximately 31% for single layer solar cell. The multi-junction, concentrator solar cell produced by Boeing-Spectrolab (a Boeing company BA) achieved a world-record conversion efficiency of 40.7% in lab experiments while commercial products operate at 26.5%-to-28.3% efficiency range.

The DOE believes breakthroughs in solar efficiency such as these may lead to systems with an installation cost of only $3 per watt, which translates into a cost of $0.15/KWH. In addition, solar PV cell suppliers are diligently working to reduce production costs. SunPower is targeting a 23% solar efficiency as a goal to reduce its solar energy system cost by 50% by 2012. Semiconductor solar cells benefit from economies of scale, which could reduce cost by 20% for each doubling of production. These solar initiatives should act to reduce solar energy costs.

Meanwhile, as energy costs rise with oil at $84/barrel, the cost of gasoline is expected to increase. If gasoline at the local filling station rises to $6.00/gallon, its cost in KWH jumps to $0.16/KWH. At that price gasoline would be above those achievable through solar energy advancements of $0.15/KWH.

Figure 1 Photovoltaic Device: Efficiency/Cost
PV Costs

With pricing on PV cells falling below $3.00/watt (or $0.15/ kilowatt-hour), solar energy will be close to parity with conventional hydrocarbons. If the cost of gasoline rises to $6.00 a gallon, it would cost $0.16/KWH while current cost of electric is about $0.11/KWH because of the low cost of coal. The bottom line is innovative research initiatives have the potential to deliver disruptive technologies that significantly changes the economics of delivering an energy solutions to all nations.

Further review:
Please see research at California Institute of Technology’s division of Chemical and Chemical Engineering at The Lewis Group.
Imperial College, Jenny Nelson’s Third generation Solar Cells.
DOE’s National Renewable Energy Lab (NREL) Third Generation Solar Photon Conversion (Exceeding the 32% Shockley(Exceeding the 32% Shockley—Queisser Limit)
Solar Energy Market Data Solarbuzz

The DOE’s Change a Light, Change the World campaign misses the bigger point.

The U.S. Department of Energy (DOE) is quite correct in suggesting that if every household in the U.S. substituted a 100-watt standard light bulb for a Compact Fluorescent Light bulb (CFL), it would eliminate an amount of carbon dioxide (CO2) equivalent to one million automobiles. However, it is the bigger picture that matters, – motor vehicles contribute the most to CO2 emissions. We must not forget that by focusing on CO2 emissions, they are admitting that CO2 is a real issue that potentially leads to global warming and climate change.

Let’s look at some facts about our carbon footprint. A 100-watt light in operation for 13.3 hours produces approximately one pound of CO2 when the electricity is generated by coal. Coal has significantly higher carbon emissions per kilowatt-hour (KWH) than oil or gas. Please see Carbon content of fossil fuels . Coal generates about half the electric power in the U.S. and produces roughly ¾ of a pound of CO2 for every KWH of electric. That means for every 1.3 KWH of electricity used (a 100-watt light used for 13.3 hours) we produce 1 pound of CO2. And remember it’s the oxygen in the air that contributes nearly 73% to the weight of CO2. This is why more CO2 is created than the actual weight of the fuel.

Using the same fuel emissions data, a motor vehicle with an average fuel efficiency of 22 miles per gallon (MPG), produces approximately 90 pounds of CO2 for every 100 miles driven. A gallon of gasoline produces nearly 20 pounds of CO2. That equates to one pound of CO2 for every mile driven by an SUV with a fuel efficiency of 19 MPG. (19.9 pounds/gallon times 1 mile divided by 19 MPG)

While it makes sense to address the issue of CO2 emissions, particularly as coal accounts for half of electric power generation and has higher CO2 emissions per KWH than oil, the real issue is an energy plan that givers us energy independence. Energy independence should equate to national security.