Solar and Hydrogen: Energy Economics
After reviewing some of the details of Honda’s experimental solar-power hydrogen refueling station in Torrance, CA and its fuel cell vehicle several questions concerning efficiency and practicality come to mind. It most be noted that solar and hydrogen don’t emit harmful byproducts such as carbon dioxide or carbon monoxide so both technologies are important to our energy security. First let’s look at the efficiency of hydrogen and second the efficiency of generating hydrogen from solar.
As we learned from science class, hydrogen is the most abundant element in the universe. Hydrogen has approximately 3 times the energy per unit mass as gasoline and requires about 4 times the storage volume for a given amount of energy according to a Hydrogen Energy report from Stanford University. In further review of additional information on hydrogen we are also making some adjustments to our fuel-ranking table.
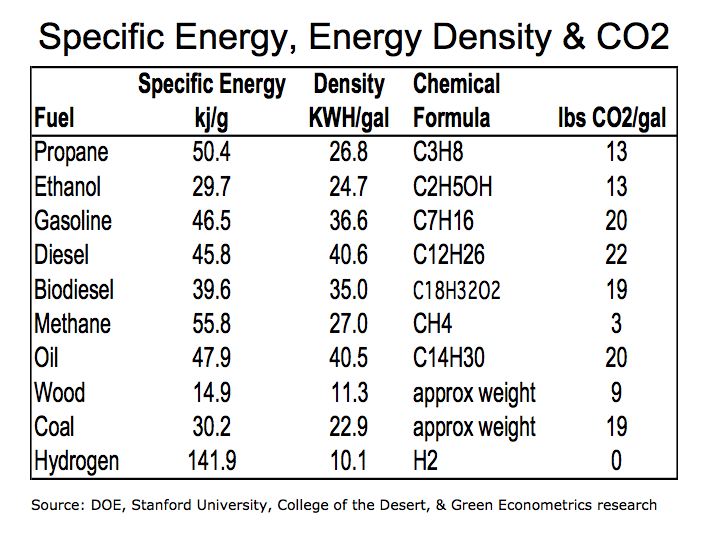
We are revising Table 1 that was used in our post of October 3, 2007 for data on the energy density for hydrogen from 2.5 kilowatt-hours (KWH) per gallon to 10.1 KWH/gal and is reflected in the revised Table 1 below. The discrepancy lies in measuring the weight of hydrogen in liquid volume. We are calculating the energy density of hydrogen using the high heat values of hydrogen of 61,000 British Thermal Units (BTUs) and a weight 0.57 pounds per gallon from the Stanford Hydrogen Report.
As a reference: 1 KWH = 3,600 kilojoules = 3,412 BTUs
Revised Table 1 Specific Energy, Energy Density & CO2
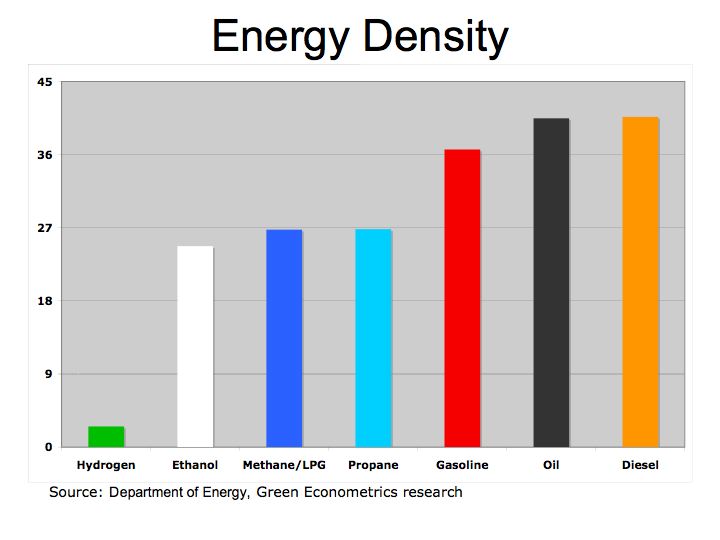
Hydrogen offers tremendous energy potential, but as we see from Table 1, hydrogen has a low energy density meaning it requires a large storage container to make it practical for use in a motor vehicle. Several car manufacturers including GM and Toyota have developed hydrogen vehicles. Hydrogen can be used in internal combustion engines replacing gasoline or in fuel cells to generate electric to power the vehicle. However, there are some limitations to the current technology that may limit the economic viability hydrogen powered vehicles in the near term. But there are no detrimental emissions with hydrogen as apposed to hydrocarbon fuels thus providing tremendous benefits as vehicle efficiency improves.
Honda’s solar-powered hydrogen fueling station takes nearly a week in sun to produce enough hydrogen to power Honda’s FCX concept hydrogen fuel cell vehicle. Honda employs a Proton Exchange Membrane Fuel Cell (PEMFC) that converts hydrogen to electric that in turn, powers the vehicle. The Honda FCX fuel cell vehicle has two fuel tanks that can be filled with up to 156.6 liters of hydrogen or about 43 gallons that offers 430km (267 miles) driving range. The hydrogen fuel cell vehicle provides a reasonable driving range, but with a fuel efficiency of 6.5 miles per gallon (MPG), suggests more research is needed.
BMW’s Hydrogen 7 can travel 125 miles on hydrogen and 300 on gasoline before refueling. In tests the BMW 745h liquid-hydrogen test vehicle has 75 kg tank has a Hydrogen Fuel Efficiency of 10 km/liter or about 25.2 MPG and cruising speed of 110 MPH. Not too bad for an internal combustion engine that is able to run on gasoline or hydrogen.
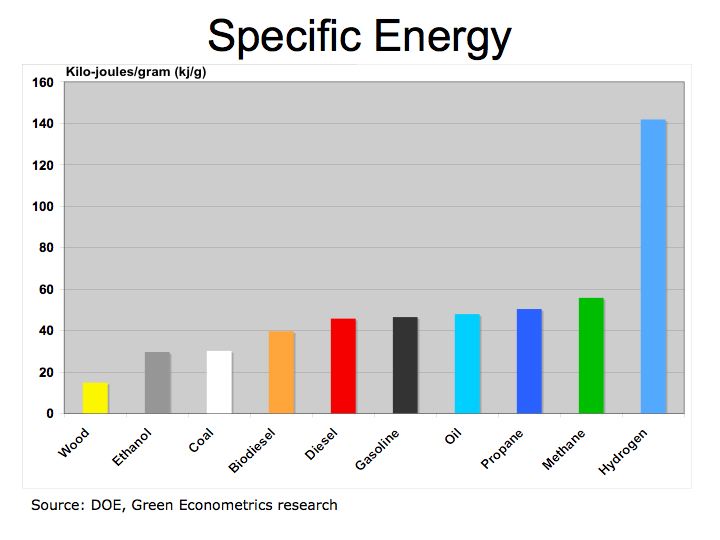
Figure 1 Specific Energy
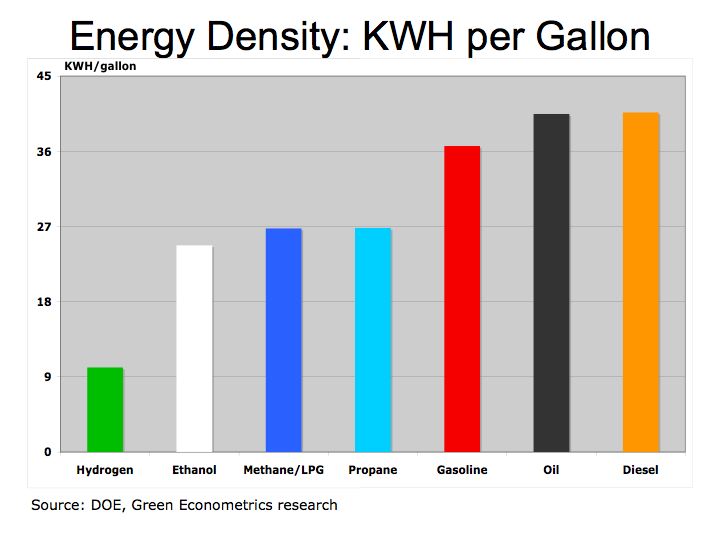
Given the changes to hydrogen’s energy density we are also adjusting hydrogen density (Figure 2) to reflect liquid hydrogen and high-energy value as noted by Hydrogen Properties College of the Desert.
Revised Figure 2 Energy Density: KWH per Gallon
We still have more questions given hydrogen’s very high specific energy, (3 times that of gasoline) and low energy density (4 times the volume of gasoline). Hydrogen is more efficient then petroleum fuel, yet when used as a fuel cell in a vehicle Honda’s MPG of 6.5 MPG is quite low. The fuel efficiency of BMW’s Hydrogen 7 of 25.2 MPG is only at parity with gasoline.
The efficiency of using solar energy to generate hydrogen may not be the most efficient method. One report from Walt Pyle, Jim Healy, and Reynaldo Cortez Solar Hydrogen Production by Electrolysis indicated that a 1-kilowatt solar photovoltaic device could generate 1 cubic meter of hydrogen in 5.9 hours. Essentially, 5.9 KWHs from a 1KW solar cell produces 1 cubic meter of hydrogen. We know that a pound of hydrogen in liquid state equals approximately 61,000 BTUs (51,500 BTUs at low heat value) or 17.9 KWH.
Research at Caltech, suggests that photoelectrochemistry The Lewis Group may offer a more efficient means of generating hydrogen. We will continue to explore solar efficiency and hydrogen fuel cells to evaluate the economics of alternative energy.
The bottom line is that our dependence on foreign oil is the biggest threat to national security and without cultivation of alternative energies we continue to endure an untenable situation. Further research into solar and hydrogen fuel cells could significantly ameliorate our dependence on oil.
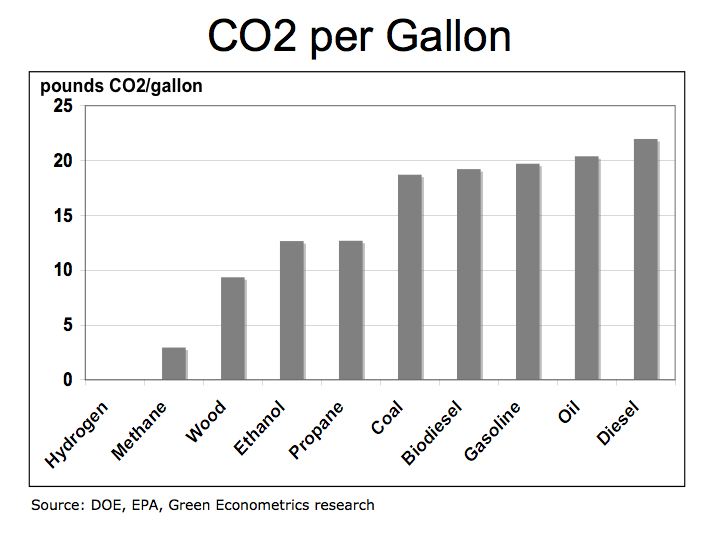
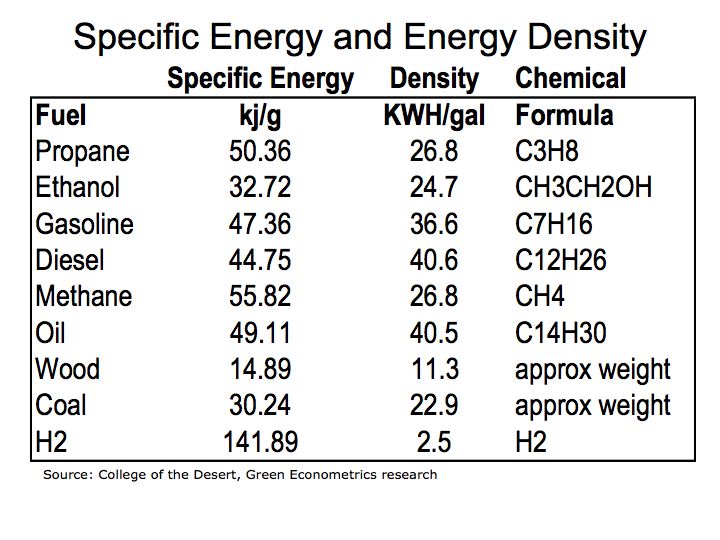
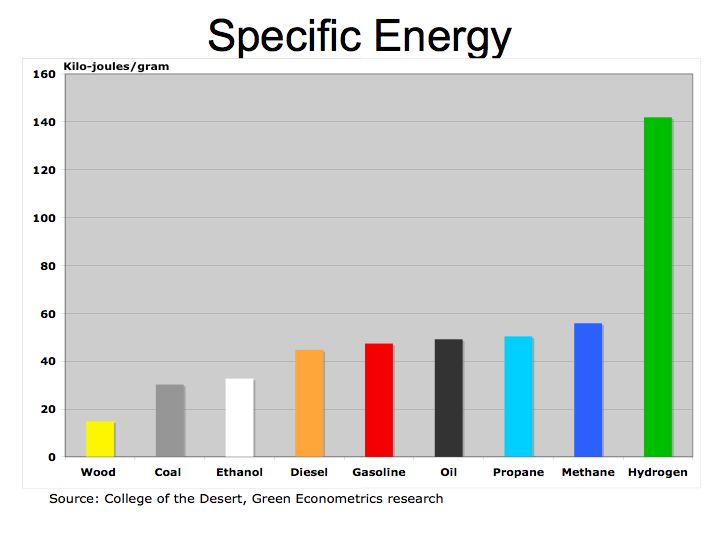 Figure 1 illustrates how fuels compare according to their specific energy. As we can see, hydrogen, because it’s extremely light, has the highest specific energy in comparison to hydrocarbon fuels.