The Economics of Energy – why wind, hydrogen fuel cells, and solar are an imperative

From the Industrial Revolution we learned that economic growth is inextricably linked to energy and as a result, our future is dependent upon equitable access to energy. When the Stourbridge Lion made entry as the first American steam locomotive in 1829 it was used to transport Anthracite coal mined in nearby Carbondale, PA to a canal in Honesdale that in turn linked to the Hudson River and onto New York City. Coal fueled the growth of New York and America’s Industrial Revolution because coal was cheap and more efficient than wood.

Advances in science and technology gave way to improvements in manufacturing, mining, and transportation. Energy became the catalyst to industrial growth. Steam power such as Thomas Newcomen’s steam powered pump in 1712 developed for coal mining and James Watt’s steam engine in 1765 were initially used to bring energy to market.

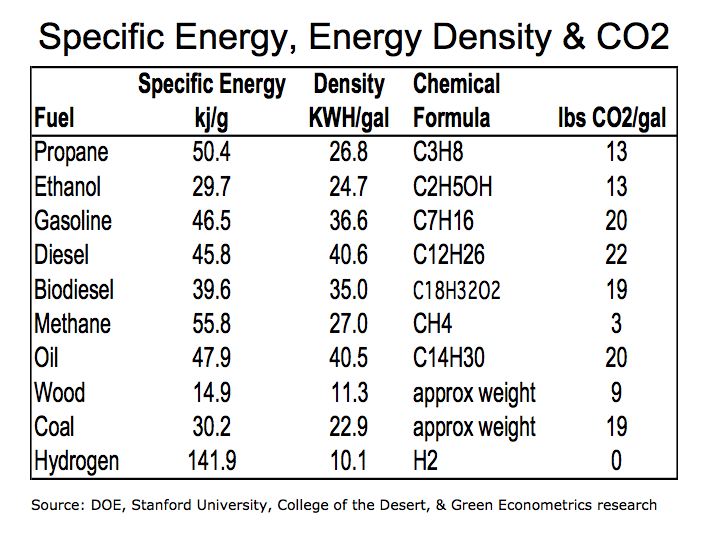
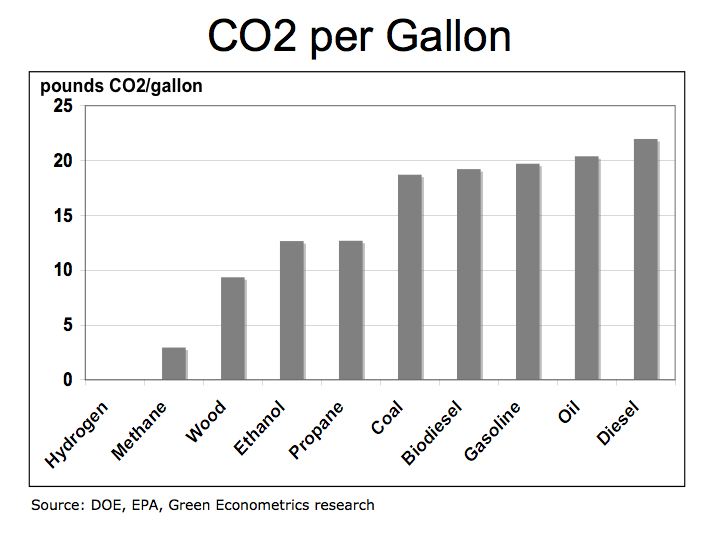
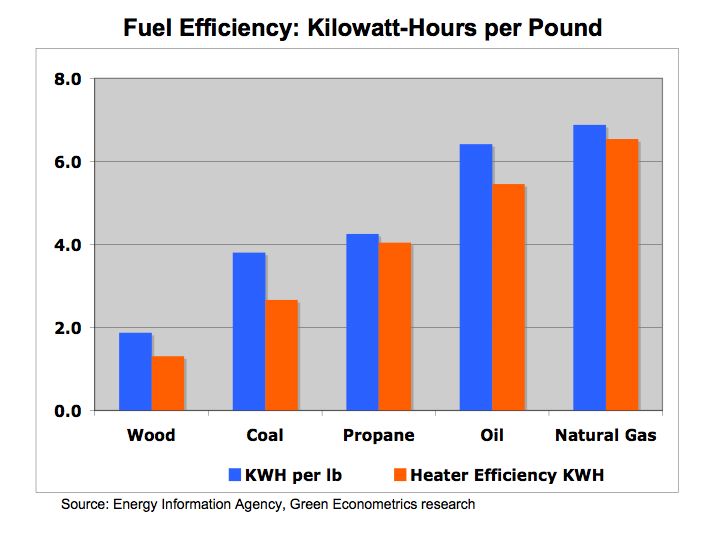
In terms of heating efficiency, coal at the time offered almost double the energy, pound for pound, in comparison to wood. Energy Units and Conversions KEEP Oil offers higher energy efficiencies over coal and wood, but as with most hydrocarbon fuels, carbon and other emissions are costly to our economy and environment.

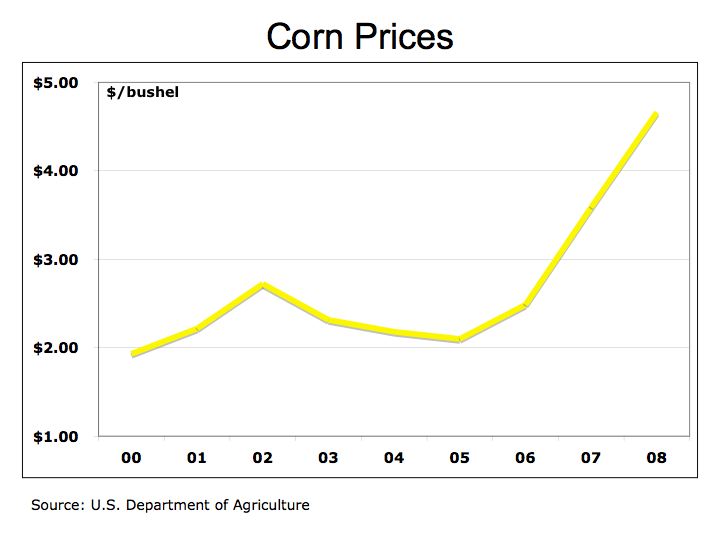
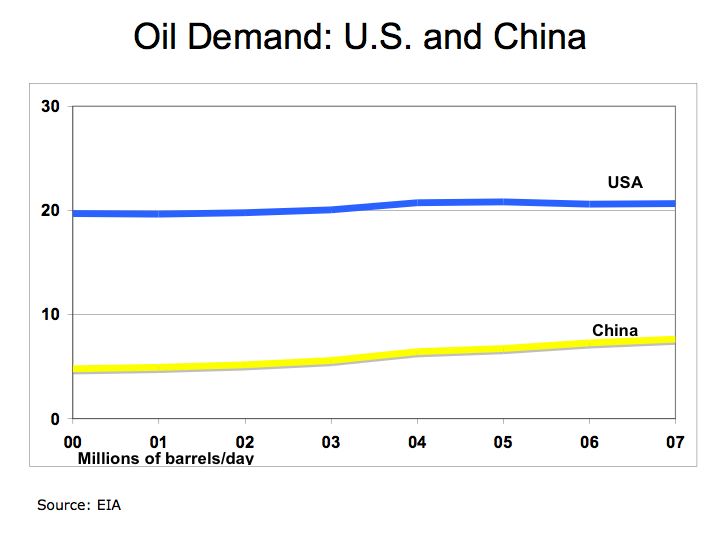
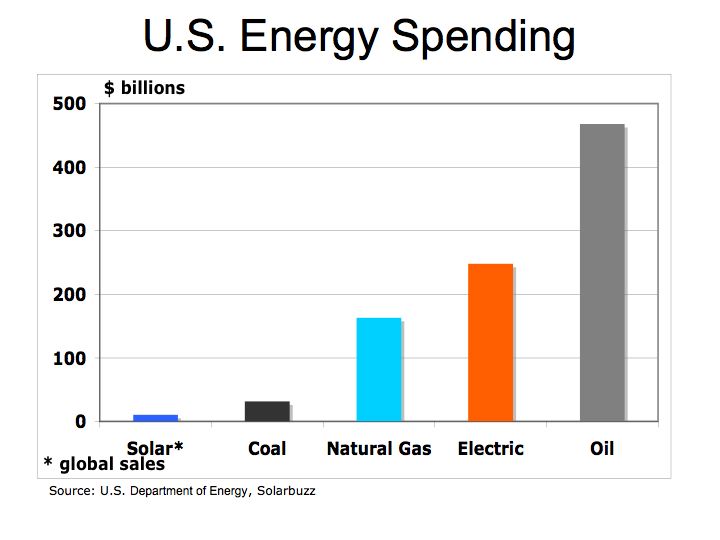
With rapid growth in automobile production in the U.S., oil became the predominant form of fuel. According to the Energy Information Administration, in 2004 the U.S. spent over $468 billion on oil.

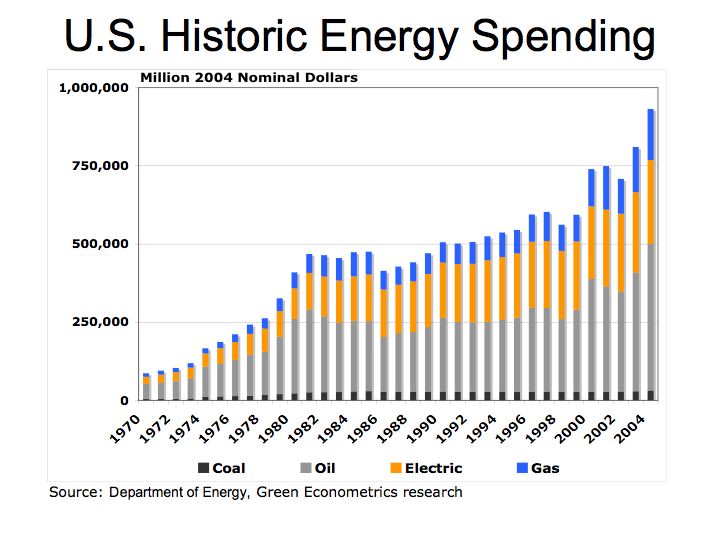
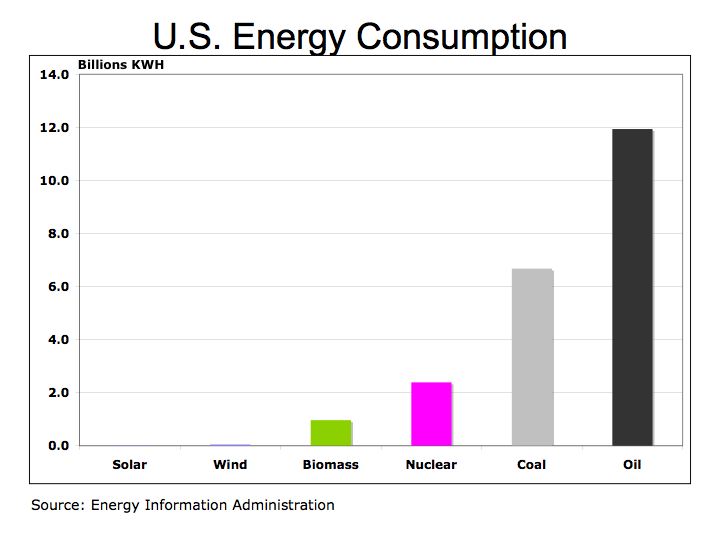
Figure 1 U.S. Energy Consumption by Fuel
Energy Consumption

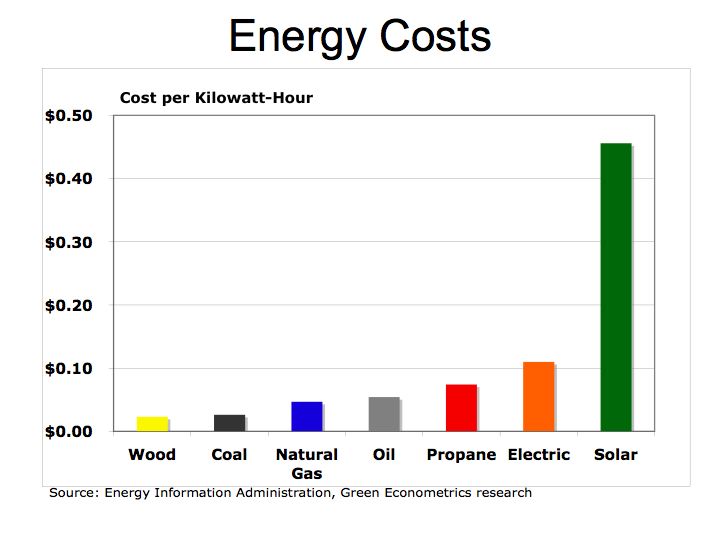
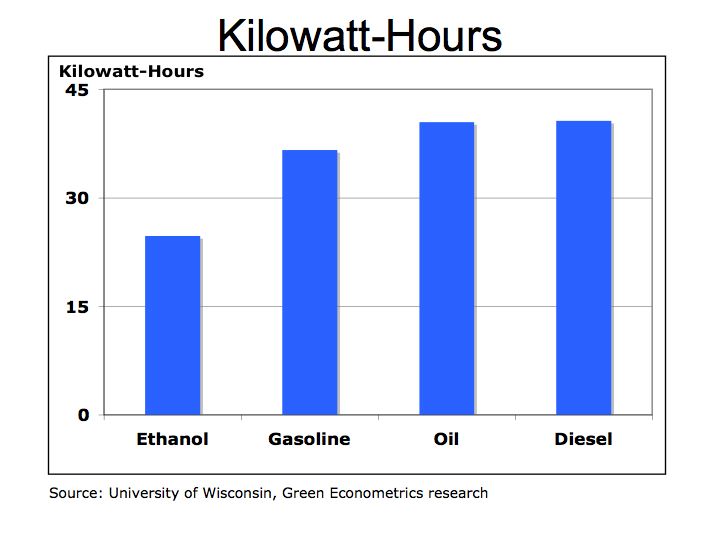
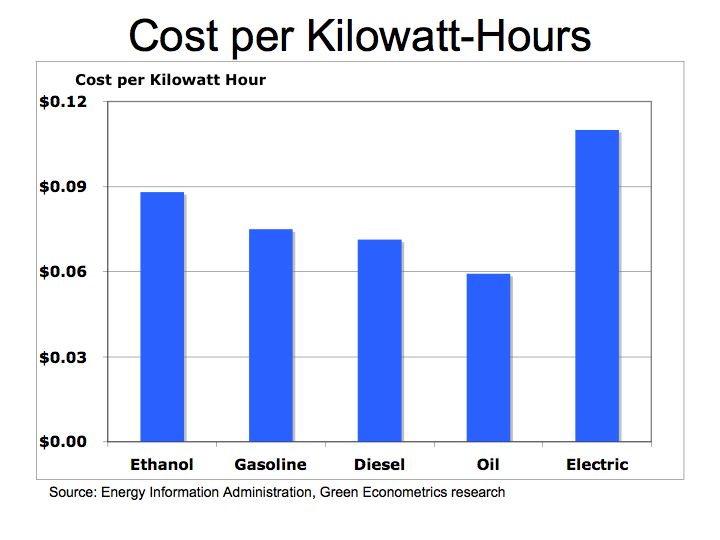
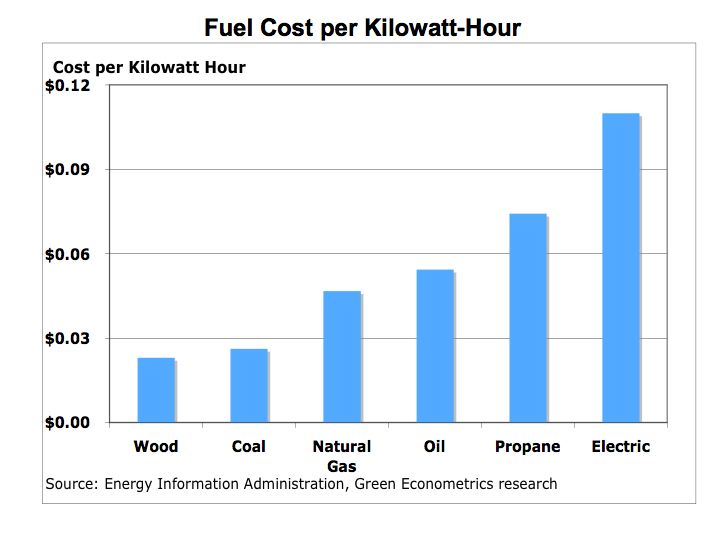
We all need to become more conversant in understanding energy costs and efficiency and as a corollary, better understand the benefits of renewable energy such as solar, wind, and hydrogen fuel cells. A common metric we should understand is the kilowatt-hour (KWH) – the amount of electricity consumed per hour. The KWH is how we are billed by our local electric utility and can be used to compare costs and efficiency of hydrocarbon fuels and alternative energies.

One-kilowatt hour equals 3,413 British Thermal Units (BTUs). One ton of Bituminous Coal produces, on the average, 21.1 million BTUs, which equals 6,182 KWH of electric at a cost of about $48 per short ton (2,000 pounds). That means coal cost approximately $0.01 per KWH. To put that into perspective, a barrel of oil at $90/barrel distilled into $3.00 gallon gasoline is equivalent to 125,000 BTUs or 36.6 KWH of energy. Gasoline at $3.00/gallon equates to $0.08 per KWH. So gasoline at $3.00 per gallon is eight times more expensive than coal.

Is oil and gasoline significantly more efficient than coal? Let’s compare on a pound for pound basis. A pound of coal equates to about 10,500 BTUs or approximately 3.1 KWH per pound. A gallon of gasoline producing 125,000 BTUs weighs about 6 pounds equating to 6.1 KWH per pound (125,000 /3,413 /6). While gasoline is almost twice as efficient as coal, coal’s lower cost per KWH is why it is still used today to generate electric.

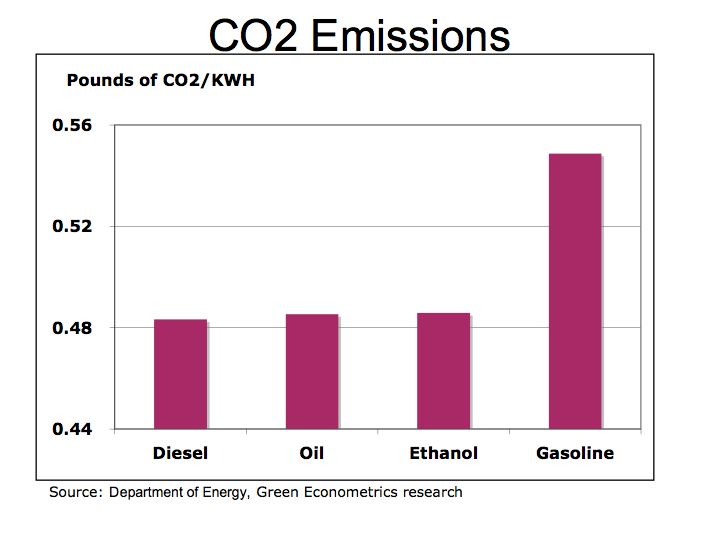
The Bottom Line: the economics of energy determines its use – coal still accounts for approximately half of our electric generation because it has a lower cost than other fuels. However, there are two factors to consider 1) the cost of carbon is not calculated into the full price of coal or other hydrocarbon fuels and 2) the cost of conventional fuel is calculated on a marginal basis while alternative fuel costs are calculated on a fixed cost basis. Meaning the cost of roads, trucks, and mining equipment is not factored into the price of each piece of coal, only the marginal cost of producing each ton of coal. For solar, hydrogen fuel cells, and wind energy systems, the cost to construct the system is factored into the total cost while the marginal cost of producing electric is virtually free. We need a framework to better measure the economics of alternative energy. The impact of carbon on our climate and global warming are clearly not measured in the costs of hydrocarbon fuels nor is the cost of protecting our access to oil such the cost the Iraq War.

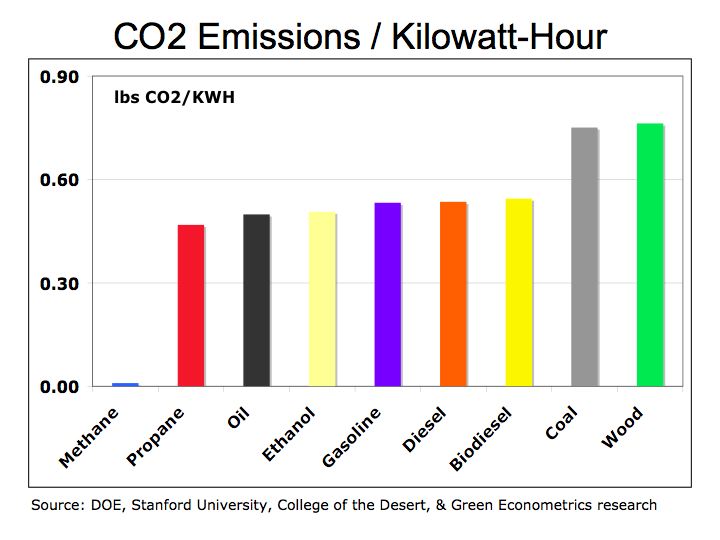
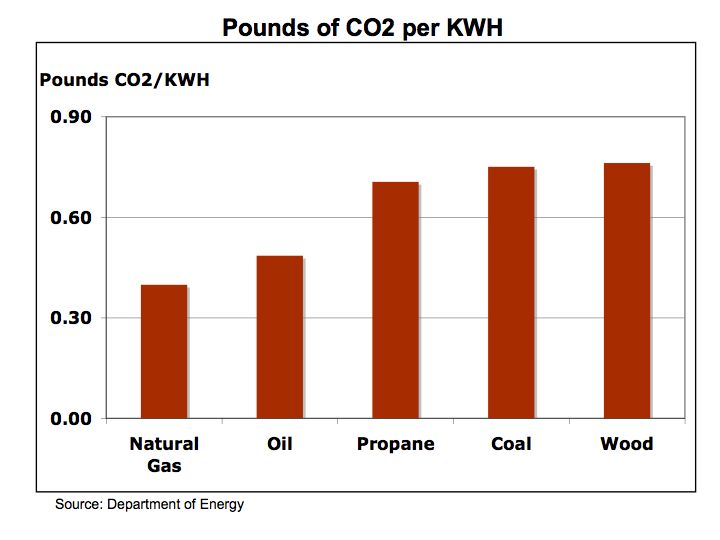
Despite the carbon issues surrounding coal, (coal has higher carbon-to-hydrogen ratio in comparison to oil or gas) coal is more abundant and therefore is cheaper than oil. As electric utilities in 24 states embrace alternative energies through such programs as Renewable Portfolio Standards (RPS), perhaps the benefits of alternative energies will begin to combat the negative economics of hydrocarbon fuels.

Ethanol offers short-term solutions, but corn-based ethanol is not the answer

Ethanol may emit less CO2 and help reduce the demand for foreign oil in the short term, but ethanol and in particular, corn-based ethanol raises food prices, is less efficient than gasoline, diesel, and biodiesel, and is not a substitute for oil.

According to research compiled by National Geographic Magazine , the energy balance of corn ethanol, (the amount hydrocarbon fuel required to produce a unit of ethanol) is 1-to-1.3 whereas for sugar cane ethanol the ratio is 1-to-8. This suggests corn-based ethanol requires significantly more energy to produce than sugar cane ethanol. Corn ethanol is only marginally positive.

A major issue with corn ethanol is its impact on corn prices and subsequently, food prices in general. It is the price of oil that is impacting the price of corn because nearly all ethanol produced in the U.S. is derived from corn. Therefore, corn prices are inextricably linked to oil prices as well as to the supply and demand of corn as food and feedstock. Corn Prices while volatile and impacted from weather and other variables appear to follow the rising price of oil as illustrated in Figure 1. In turn, corn prices are also influencing other commodity prices where corn is used for feed for livestock.

The rising motor vehicle usage in China and India is escalating the already tenuous situation in the oil markets. With ethanol tied to oil prices we are beginning to see corn prices exacerbate the inflationary pressures at the retail level. Over the last year consumers are paying more for food with large increases in the prices of eggs, cereal poultry, pork, and beef which are tied to corn.

Figure 1 Corn Prices
Corn Prices

Senate legislation for Renewable Fuels Standard calls for ethanol production to increase to 36 billion gallons by 2022 with 21 billion derived from as cellulosic material such as plant fiber and switchgrass . Corn is expected to comprise 42% of the ethanol production in 2002 from virtually all today. The fact is that ethanol production at its current level of 6 billion gallons equates to only 4% of our gasoline usage and is already impacting food prices. Gasoline consumption in 2005 amounted to 3.3 billion barrels or 140 billion gallons. Current estimates put gasoline consumption at 144 billion gallons a year in 2007. Even if vehicles could run entirely on ethanol, there is not enough corn harvest to substitute our demand for oil. We need a cohesive and coordinated effort using multiple technologies to develop alternative energies to reduce our dependence on foreign oil.

Performance

According to Renewable Fuels Association ETHANOL FACTS:
ENGINE PERFORMANCE,
ethanol offers higher engine performance with octane rating of 113 in comparison to 87 for gasoline and has a long history in the racing circuit. In 2007, the Indy Racing League, sponsors of the Indianapolis 500 started using ethanol in racecars. However, the higher engine performance may come at a cost of lower fuel efficiency.

Table 1 Specific Energy, Energy Density & CO2
Specific Energy

Efficiency

Gasoline offers 56% higher energy efficiency (specific energy) over ethanol as measured by kilo-joules per gram (kj/g). (As a reference: 1 kilowatt-hour = 3,600 kilojoules = 3,412 British Thermal Units) Biodiesel with 35 kj/g is 33% more energy efficient than ethanol at 24.7 kj/g.

In terms of energy density, ethanol would require larger storage capacity to meet the same energy output of gasoline diesel, and biodiesel. Ethanol requires a storage tank 48% larger than gasoline and 41% larger than diesel for the same energy output.
Please see Hydrogen Properties and Energy Units

For a quick review of Specific Energy and Energy Density – (Molecular Weight Calculator) the specific energy of a fuel relates the inherent energy of the fuel relative to its weight and is measured in kilo-joules per gram.

CO2 Emission

The molecular weight of CO2 is approximately 44 with two oxygen molecules with an approximately weight of 32 and one carbon atom with a weight of 12. During the combustion process, oxygen is taken from the atmosphere producing more CO2 then the actual weight of the fuel. In the combustion process a gallon of gasoline weighing a little over six pounds produces 22 pounds of CO2.

CO2 emission is a function of the carbon concentration in the fuel and the combustion process. During combustion ethanol produces approximately 13 pounds of CO2 per gallon. Gasoline and diesel produce approximately 22 and 20 pounds per gallon, respectively. CO2 emissions per gallon appear quite favorable for ethanol. However, the results are less dramatic when CO2 emissions are compared per unit of energy produced.

Figure 2 CO2 per KWH
CO2 / KWH

When measured in pounds of CO2 per kilowatt-hours (KWH) of energy, the results show ethanol producing 6% less CO2 than diesel or biodiesel and 5% less than gasoline. In the case of ethanol, the lower specific energy of the fuel negates the benefit of its lower CO2 emissions. Meaning more ethanol is consumed to travel the same distance as gasoline or diesel thereby limiting the benefit of its lower CO2 emissions.

The bottom line is ethanol does not ameliorate our dependence on foreign oil and while it demonstrates higher performance for racecars, it is still less efficient than gasoline diesel, and biodiesel, and diverts food production away from providing for people and livestock. The reality is there are special interest groups that obfuscate the facts about ethanol for their own benefit. The real solution to our imminent energy crisis is alternative energies including cellulosic ethanol, solar, hydrogen fuel cells, and wind.

Economics of Solar PV Suppliers

Improving economics and high market valuations should help drive research for alternative energy. With the release of Q3/07 financials, it’s clear that the economics of solar photovoltaic (PV) suppliers is improving. Some of the leading pure play publicly traded PV stocks are demonstrating significant improvements in financial performance that should drive further investment into solar and green technology. The improving economics of solar should continue to drive further investment into alternative energy companies as venture capital firms and Wall Street find that alternative energy is a significant secular trend with sustainable economic foundation.

Most visible among the solar PV suppliers is First Solar (FSLR) with y/y revenue growth for Q3/07 increasing 290% and gross margins exceeding 50% and operating margins above 30%. FSLR’s management was clear in articulating that these strong Q3 numbers reflect ramping on of its German manufacturing facility and would not be sustainable. However, with gross margins exceeding 50% and operating margins above 30% Wall Street takes notice and rewards the firm with valuation multiple envious of leading technology companies such as Google (GOOG) and Cisco Systems (CSCO).

Figure 1 Revenues, Margins, and Capacity
Solar Financial Performance

The stronger financial performance of solar PV suppliers is significant because it improves the viability of the solar PV business model thereby attracting more investors and in turn drives funding for alternative energy start up companies. FSLR went public in November 2006 with a closing price of $24.74 on its first day. With a closing price one year later of $212.63, FSLR offers investors a yearly return of 759%. The attractive return generated by solar stocks tends to attract more investors and drives market valuations higher thus feeding the flow of additional venture capital funding.

In terms of market valuation FSLR trades at a significant premium to most companies in the S&P 500 as well as leading technology companies including GOOG and CSCO. . Most solar PV companies trade at higher market valuation multiples than CSCO and GOOG. Both FSLR and Sun Power (SPWR) trade at premium price-to-sales (P/S) and price/earnings-to-growth (PEG) multiples in comparison to some leading technology stocks. In terms of PEG ratios, FSLR and SPWR trade at 2.9x and 2.2x respectively while CSCO and GOOG trade at 1.3x and 1.2X, respectively. In comparison, the S&P 500 index trades at a PEG of 0.8x while the technology and energy segments trade at 0.6x and 2.2x, respectively. These high market valuations prove the venture capital community with high exit values on their current crop of alternative energy investments. Please see Figure 2.

It is this premium market valuation multiple that suggests the importance of alternative energy. Wall Street tends to be a leading indicator and keen in its ability to identify secular trends. Major trends command premium valuations and reward venture capital with attractive exist strategies. Wall Street rewards cash flow growth fueling further venture capital funding that in turn, fuels the flow of intellectual and financial capital. The value migration measured by price-to-sales multiples and illustrated by A. Slywotsky in his book Value Migration provide a framework to gauge the significance of trend towards alternative energies. Capital gravitates to the business model that creates economic value and is measured by a stock’s price-to-sale ratio. By that measure solar stocks is where the value is headed.

Figure 2 Price-to-Sales Ratio
PS Ratio

The bottom line is that high market valuations attract research funding and brain power. Rising oil prices, rapid industry growth, and high public market valuations of solar PV companies, should act to attract further venture capital funding of alternative energy companies. Increased solar funding should translate into increased research and talent migration that could improve solar efficiency and reduce costs that in turn could bring solar to electric grid parity.

Solar and Hydrogen: Energy Economics

After reviewing some of the details of Honda’s experimental solar-power hydrogen refueling station in Torrance, CA and its fuel cell vehicle several questions concerning efficiency and practicality come to mind. It most be noted that solar and hydrogen don’t emit harmful byproducts such as carbon dioxide or carbon monoxide so both technologies are important to our energy security. First let’s look at the efficiency of hydrogen and second the efficiency of generating hydrogen from solar.

As we learned from science class, hydrogen is the most abundant element in the universe. Hydrogen has approximately 3 times the energy per unit mass as gasoline and requires about 4 times the storage volume for a given amount of energy according to a Hydrogen Energy report from Stanford University. In further review of additional information on hydrogen we are also making some adjustments to our fuel-ranking table.

We are revising Table 1 that was used in our post of October 3, 2007 for data on the energy density for hydrogen from 2.5 kilowatt-hours (KWH) per gallon to 10.1 KWH/gal and is reflected in the revised Table 1 below. The discrepancy lies in measuring the weight of hydrogen in liquid volume. We are calculating the energy density of hydrogen using the high heat values of hydrogen of 61,000 British Thermal Units (BTUs) and a weight 0.57 pounds per gallon from the Stanford Hydrogen Report.

As a reference: 1 KWH = 3,600 kilojoules = 3,412 BTUs

Revised Table 1 Specific Energy, Energy Density & CO2
Specific Energy

Hydrogen offers tremendous energy potential, but as we see from Table 1, hydrogen has a low energy density meaning it requires a large storage container to make it practical for use in a motor vehicle. Several car manufacturers including GM and Toyota have developed hydrogen vehicles. Hydrogen can be used in internal combustion engines replacing gasoline or in fuel cells to generate electric to power the vehicle. However, there are some limitations to the current technology that may limit the economic viability hydrogen powered vehicles in the near term. But there are no detrimental emissions with hydrogen as apposed to hydrocarbon fuels thus providing tremendous benefits as vehicle efficiency improves.

Honda’s solar-powered hydrogen fueling station takes nearly a week in sun to produce enough hydrogen to power Honda’s FCX concept hydrogen fuel cell vehicle. Honda employs a Proton Exchange Membrane Fuel Cell (PEMFC) that converts hydrogen to electric that in turn, powers the vehicle. The Honda FCX fuel cell vehicle has two fuel tanks that can be filled with up to 156.6 liters of hydrogen or about 43 gallons that offers 430km (267 miles) driving range. The hydrogen fuel cell vehicle provides a reasonable driving range, but with a fuel efficiency of 6.5 miles per gallon (MPG), suggests more research is needed.

BMW’s Hydrogen 7 can travel 125 miles on hydrogen and 300 on gasoline before refueling. In tests the BMW 745h liquid-hydrogen test vehicle has 75 kg tank has a Hydrogen Fuel Efficiency of 10 km/liter or about 25.2 MPG and cruising speed of 110 MPH. Not too bad for an internal combustion engine that is able to run on gasoline or hydrogen.

Figure 1 Specific Energy
Specific Energy

Given the changes to hydrogen’s energy density we are also adjusting hydrogen density (Figure 2) to reflect liquid hydrogen and high-energy value as noted by Hydrogen Properties College of the Desert.

Revised Figure 2 Energy Density: KWH per Gallon
Energy Density

We still have more questions given hydrogen’s very high specific energy, (3 times that of gasoline) and low energy density (4 times the volume of gasoline). Hydrogen is more efficient then petroleum fuel, yet when used as a fuel cell in a vehicle Honda’s MPG of 6.5 MPG is quite low. The fuel efficiency of BMW’s Hydrogen 7 of 25.2 MPG is only at parity with gasoline.

The efficiency of using solar energy to generate hydrogen may not be the most efficient method. One report from Walt Pyle, Jim Healy, and Reynaldo Cortez Solar Hydrogen Production by Electrolysis indicated that a 1-kilowatt solar photovoltaic device could generate 1 cubic meter of hydrogen in 5.9 hours. Essentially, 5.9 KWHs from a 1KW solar cell produces 1 cubic meter of hydrogen. We know that a pound of hydrogen in liquid state equals approximately 61,000 BTUs (51,500 BTUs at low heat value) or 17.9 KWH.

Research at Caltech, suggests that photoelectrochemistry The Lewis Group may offer a more efficient means of generating hydrogen. We will continue to explore solar efficiency and hydrogen fuel cells to evaluate the economics of alternative energy.

The bottom line is that our dependence on foreign oil is the biggest threat to national security and without cultivation of alternative energies we continue to endure an untenable situation. Further research into solar and hydrogen fuel cells could significantly ameliorate our dependence on oil.

Solar and Hydrogen Energy – where vehicle fuel efficiency is headed

Despite efforts that have enabled the U.S. to limit its demand for oil, world oil demand is up significantly. Advances in technology such as solar energy and vehicle fuel cell could help the world reduce its dependence on oil.

Figure 1 Oil and Gold Prices
Oil Prices

The U.S. Department of Energy (DOE) and the U.S. Environmental Protection Agency (EPA) today released the Fuel Economy Guide for 2008 model year vehicles Fuel Economy Leaders: 2008 Model Year Coming in first place is the Toyota Prius (hybrid-electric) with city/highway miles per gallon (MPG) of 48/45. With higher fuel costs more people are factoring in fuel efficiency into their purchase decision. However, it is the purchase of pickup trucks and SUV that account for most of the vehicle purchases in the U.S. and these vehicles are dramatically less fuel-efficient than hybrids and small four-cylinder automobiles.

Despite the trend towards larger vehicles, the U.S is not experiencing a rapid rise in oil demand. Yet oil prices continue to climb. While geopolitical risk may account for the bulk of the recent price increase, latest information from the U.S. Energy Information Administration (EIA) Total Petroleum Consumption shows increasing oil demand from China.

Figure 2 Oil Demand: U.S. and China
Oil Demand

Figure 2 illustrates that while oil demand in the U.S. has grown only modestly since 2000, the growth in China’s oil demand is rising rapidly. The recent data from the EIA shows oil demand through Q2/07. The demand for oil in the U.S. is up 5% from 2000 while in China oil demand is up 59% over the same period.

Improving vehicle fuel efficiency may abate rapidly rising oil demand in the U.S., but more emphasis on diesel and hybrids could take us a lot further. For example, Toyota has been slow to introduce its diesel line of pickup trucks in the U.S. while it offers a broad line of more fuel-efficient vehicle outside the U.S. Toyota offers several cars and trucks in Europe with impressively high fuel efficiencies that are not available in the U.S. Infact, the Toyota Hilux two-wheel drive pickup truck offers a four-cylinder diesel engine with an MPG of 44.8 on the highway and 29.1 in the city.

We are also seeing progress on fuel cell vehicles that could ultimately ameliorate are demand for oil, if not eliminate it entirely, all with no carbon dioxide or other emissions. We see most major automakers developing hydrogen powered fuel cell vehicles. Honda for one has the right concept in employing solar energy to make hydrogen.

Honda’s experimental hydrogen refueling station in Torrance, CA increases the solar incre3ases the efficiency of hydrogen fuel by using solar energy to produce hydrogen. The hydrogen is then used to power Honda’s Honda’s FCX concept hydrogen fuel cell vehicle with the only emission being pure water vapor. These fuel cell vehicles may not be ready for prime time, they provide a clear reality to what is achievable.

The bottom line is that supply and demand dictate price and the availability of cheap oil is on the decline. Further research into solar and hydrogen fuel cells could significantly change our dependence on oil.

A small investment produces huge savings on your electric bill

My September electric bill arrived the other day and I was interested in comparing my energy savings after swapping 60 and 100-watt light bulbs for Compact Fluorescent Light bulbs (CFL), as recommended by the U.S. Department of Energy (DOE). Our progress in migrating to solar and wind energy is moving slower than expected. The CFL bulbs were a cheap investment so last year 12 standard light bulbs (two 100-watt and ten 60-watt) for ten 60-watt and two 100-watt CFL bulbs.

The results are impressive with improving energy reductions and money savings. Energy usage as measured by kilowatt-hours (KWH) is down an average of 30% from last and attributable to CFL, outdoor solar lighting as well as electric conservation efforts. However, the savings attributable to the CFL bulbs, of nearly $8 per month equate to an impressive return on investment of over 190% in one year.

While our initial calculations suggested energy savings (for lighting) called for reductions of over 70% when switching to CFL bulbs, the electric bill reduction was not that dramatic because large appliance usage account for a larger portion of electric power bill. However, when measuring the return on investment for a fast, cheap, and easy step to lower your electric bill, the CFL produces real savings,

The CFL bulbs cost around $4.00 for either a 100-watt or 60-watt equivalent light bulb. GE’s compact fluorescent lights were installed in August 2006 at a total cost of $48.00 (12 times $4.00 a light). According to GE the 60-watt CFL used 15-watts of power and the 100-watt CFL used approximately 26-to-29 watts of power. So theoretically, energy use, assuming lights were in operation for 4 hours per day, would save about 71 KWH a month. Our electric rates are currently at $0.108 per KWH which is at par with the U.S. average rate of Electricity Prices for Households $0.104 per KWH in 2006. Therefore, the CFL bulbs are saving about $7.71 per month from our electric bill amounting to $92.50 in savings over a year. That yields an investment return of 193% on a $48 investment in CFL bulbs.

Figure 1 CFL Energy SavingsEnergy Savings

Now of course, power usage varies by household, including the diligent habits of our children, so savings will vary. The bottom line is little steps sometimes produce big results – CFL bulbs do help reduce your electric bill with a small investment and also help the environment as each 1.3 KWH reduction in power use reduces carbon dioxide (CO2) emissions by 1 pound. Coal generates about half the electric power in the U.S. and produces roughly ¾ of a pound of CO2 for every KWH of electric. That means for every 1.3 KWH of electricity used (a 100-watt light used for 13.3 hours) produces one pound of CO2. CFL help reduce CO2 emissions by approximately 1.4 pounds per bulb based on light usage of just 1-hour/day a month.

The DOE’s Change a Light, Change the World campaign misses the bigger point.

The U.S. Department of Energy (DOE) is quite correct in suggesting that if every household in the U.S. substituted a 100-watt standard light bulb for a Compact Fluorescent Light bulb (CFL), it would eliminate an amount of carbon dioxide (CO2) equivalent to one million automobiles. However, it is the bigger picture that matters, – motor vehicles contribute the most to CO2 emissions. We must not forget that by focusing on CO2 emissions, they are admitting that CO2 is a real issue that potentially leads to global warming and climate change.

Let’s look at some facts about our carbon footprint. A 100-watt light in operation for 13.3 hours produces approximately one pound of CO2 when the electricity is generated by coal. Coal has significantly higher carbon emissions per kilowatt-hour (KWH) than oil or gas. Please see Carbon content of fossil fuels . Coal generates about half the electric power in the U.S. and produces roughly ¾ of a pound of CO2 for every KWH of electric. That means for every 1.3 KWH of electricity used (a 100-watt light used for 13.3 hours) we produce 1 pound of CO2. And remember it’s the oxygen in the air that contributes nearly 73% to the weight of CO2. This is why more CO2 is created than the actual weight of the fuel.

Using the same fuel emissions data, a motor vehicle with an average fuel efficiency of 22 miles per gallon (MPG), produces approximately 90 pounds of CO2 for every 100 miles driven. A gallon of gasoline produces nearly 20 pounds of CO2. That equates to one pound of CO2 for every mile driven by an SUV with a fuel efficiency of 19 MPG. (19.9 pounds/gallon times 1 mile divided by 19 MPG)

While it makes sense to address the issue of CO2 emissions, particularly as coal accounts for half of electric power generation and has higher CO2 emissions per KWH than oil, the real issue is an energy plan that givers us energy independence. Energy independence should equate to national security.

With choices like Biodiesel and Ethanol, what’s the best fuel for your vehicle?

With the rapid growth in vehicle use around the world, it would be nice to know what are the most efficiency, economic, and least carbon emitting fuels. The number of motor vehicles on the road is increasing rapidly. The number of cars and trucks in China is up over 3,600 percent in the last thirty years. Data from the U.S. Department of Energy (DOE) and Ward’s Communications, Ward’s World Motor Vehicle Data provide an interesting view of the growth in motor vehicle use.

Figure 1 China Truck and Car Registration
China Vehicles

While the U.S. still accounts for the largest motor vehicle market, the rest of the world is quickly accelerating towards more vehicles on the road. Figure 2 shows the number of vehicle registrations over the last thirty years for China, the U.S. and the rest of the world (ROW). Vehicle registration growth in the U.S. has been growing at a 2% per year rate from 1975 to 2005. The largest growth in vehicle registration is in China and India where growth in the last ten years is up 195% and 99%, respectively.

Figure 2 World Vehicle Registration
World Vehicles

With an explosion in motor vehicle use, what fuel should we be using to better performance and reduce emissions? Let’s go back to two basic concepts of energy: Specific Energy and Energy Density. For a quick review, (Molecular Weight Calculator) the specific energy of a fuel relates the inherent energy of the fuel relative to its weight. Specific energy is often measured in kilo-joules per gram (kj/g). One kilo-joule equals one kilowatt-second meaning one kilowatt-hour (KWH) equals to 3,600 kilo-joules. Also one British Thermal Unit (BTU) equals 1,055.05585 joules. A reference to the specific energy and energy values of most fuels can be found at Hydrogen Properties

Figure 3 Specific Energy
Specific Energy

By specific energy hydrogen is the clear leader. However, vehicles must inherently carry their fuel supply, so to determine which fuel is best for motor vehicles, energy density of the fuel is the next measurement. While vehicle fuel efficiency is dependent upon a number of factors such as engine type and performance, make and model of vehicle, road conditions and fuel, we are focusing on fuel energy.

Figure 4 Energy Density: KWH per Gallon
Energy Density

Figure 4 illustrates how fuels compare with respect to energy density, that is, energy relative the container size. We again are using KWH to measure energy value. Hydrogen, because it is so light, requires 15.9 times the container volume to provide the same energy as diesel. Biodiesel provides more power per gallon than Ethanol, which requires 1.6x, the container size for the same amount of energy as diesel. Biodiesel and diesel are relatively similar with respect to energy density. While both Ethanol and Biodiesel are both form of renewable energy, Biodiesel offers more bang per gallon. Before we are able invest more into hydrogen and solar energy to bring alternative energy into parity with conventional hydrocarbon fuels, diesel and biodiesel offer better energy efficiency among hydrocarbon fuels.

Table 1 Specific Energy, Energy Density & CO2
Specific Energy

As a final assessment of hydrocarbon fuels, let’s compare carbon dioxide (CO2) emissions among our list of fuels. CO2 emission is a function of carbon concentration and combustion process of the fuel. Fuel energy research at the Department of Environmental Protection (EPA) and DOE indicate 99% to nearly 100% combustion of with fuels used in vehicles. That means almost all of the atoms in the fuel are converted to either heat or byproducts such as CO2.

Figure 5 illustrates how much CO2 is produced per gallon of fuel. Remember the molecular weight of CO2 is about 44 with oxygen contributor nearly 73% of the weight and is taken from our atmosphere during combustion. This is why more CO2 is created than the actual weight of the fuel. A second factor needs to be considered when evaluating CO2 emission and that is how much CO2 is produced per energy value. In comparing CO2 emissions per KWH of energy, Ethanol produces about 7% less CO2 than diesel or Biodiesel and 5% less than gasoline. Neither of these estimates considers the emissions from the processing to produce Ethanol or Bioiesel.

Figure 5 CO2 per Gallon
CO2

The bottom line is Ethanol and Biodiesel provide marginal relief to our energy crisis with biodiesel offering better efficiency and Ethanol marginally less CO2 missions. The only real solution to our imminent energy crisis is alternative energies such as solar, hydrogen fuel cells, and wind.

Can Canadian Tar Sands rescue our appetite for Oil?

Oil prices remain at historically high levels and threaten our economy with higher home heating and transportation costs. With a lot of rhetoric over Peak Oil as well as claims that Tar Sands offer a viable substitute for oil, let’s examine a couple of facts to determine the feasibility and sustainability of supplementing our current demand for oil with tar sands.

According to Bureau of Land Management’s on line resource for Oil Shale and Tar Sands, tar sands are a mixture of clay, sand, water, and bitumen, which is liquid hydrocarbon oil like substance. Tar sands consist of about 10%-to-15% liquid hydrocarbon and an 80%-to-85% mixture of mineral water, clay, and sand, and 4%-to-6% water. It takes about two tons of tar sands, which are extracted, mainly through strip mining, and processed to produce one barrel of oil.

According to Alberta Energy, sand oil production was at 966,000 barrels per day (bbl/d) in 2005 and is expected to reach 3 million bbl/d by 2020 and possibly even 5 million bbl/d by 2030. Alberta’s sand oil reserves at 1,704 million barrels, but proven and extractable using current technology, the estimate is 175 billion barrels which is second to Saudi Arabia’s 260 billion according to CBS 60 Minutes

However, with productions level of Alberta’s sand oil at 3 or even 5 million barrels per day, it represents just 4%-to-6% of the world’s oil needs. The U.S. consumed an average of approximately 20.5 million bbl/d in 2006 as indicated by the Energy Information Administration.

If it takes two tons of tar sand to produce one barrel of oil, the ability to increase production to 3 million barrels per day would amount to mining of 2.1 billion tons of tar sand. Total coal mining in the U.S. for 2006 was 1.1 billion tons according to EIA Coal Data At 5 million barrels per day, equivalent to about 6% of the world oil production in 2006, would amount to 3.6 billion tons of tar sand. That would be significantly larger than the 1.3 billion tons total world production of Iron ore in 2005 Info Comm. That appears to be a lot of mining for a 6% increase of oil on the world market. The added tar sand oil would make a significant contribution to U.S. oil needs.

According to the Canadian Association of Petroleum Producers capital investment in Alberta’s oil sands amounted to $10.4 billion in 2005. That’s not a bad investment considering that even with production levels of 1 million barrels a day, revenue potential could be $29 billion a year with oil over $80 per barrel.

Figure 1 U.S. Oil Supply and Demand
Oil Supply and Demand

Given the that tar sands only provide a fraction of our energy requirements and is burdened by carbon emission even during extraction, a commitment to solar energy fuel cells may offer a better return on investment. The bottom line is oil derived from tar sand is only a supplement to our energy demands, it’s non-renewable, adds to carbon emissions, requires extensive processing, and must be mined.

Home Heating Concerns

With oil prices over $80 per barrel, the National Energy Assistance Directors’ Association in its press release today Record Home Heating Prices for Heating is expecting the average home heating cost for the ’08-’08 season to rise 9.9%. For homeowners using oil heat, heating costs are expected to increase 28% and for homes using propane, a 30% increase is expected.

With rising energy costs driven by costly oil extraction, the potential impact from carbon emissions with our continuing use of oil on climate change and rising sea levels, as well as the potential for fuel supply disruptions, could exacerbate our tenuous relationship with energy.

Eventually, as price rise dramatically, alternative energy becomes more compelling. The problem is our economy is so inextricably link to oil, that our energy security is based on securing foreign oil.

Figure 1 Oil Prices and Home Heating CostsHome Heating

Without support and research on alternative energies such as solar and fuel cell technologies, we are hostage to oil. The U.S. economy is facing one of the most crises since the Oil Embargo of the 1973. Inflation driven by escalating oil prices is impacting the cost of home heating, transportation, production, materials, and food, particularly as corn is diverted to ethanol production. The housing market is in turmoil with falling home values, rising foreclosures, and a credit crisis that is making it more difficult to secure a mortgage may lead to slower consumer spending. With rising inflation and slower growth we may find ourselves in an economic world described as stagflation that was coined in the ’70’s to describe the bleak environment when gas stations rationed fuel, unemployment grew and the Federal Reserve raised rates dramatically to quell inflation.If we could limit our dependence on foreign oil through investment into solar energy and fuel cell technologies, we would not be impacted by the exogenous events in oil producing nations.

We believe there are a number of catalyst that could serve to dramatically lower the cost of alternative energies. It takes initiatives from all of us to change the balance. After all, oil is becoming more costly to extract, new oil discoveries are in difficult and challenging environments, and oil will eventually run out – it is finite. If we wait to long, our ability to make a difference may not be available.

Solar Energy: The Security Perspective

The U.S. Department of Energy (DOE)’s $23.6 Billion Spending Plan for FY’07 calls for $1.5 billion for the Office of Energy Efficiency and Renewable Energy where spending includes $28 million in solar, $16 million for thin-film photovoltaic manufacturing equipment to reduce the cost of solar panels, $23 million for researching ethanol, and $100 million for carbon sequestration research. However, more than half of the DOE spending is targeted towards research on weapons, defense, and security. Perhaps our national security would be better served if the U.S. were not dependent on foreign oil. Investment into alternative energies like solar and fuel cells could provide us with energy independence with less concern over protecting oil in foreign lands.

Solar energy is significantly more expensive than conventional hydrocarbon fuels. In Green Econometrics’ prior analysis of fuel efficiencies and costs, we found solar energy cost approximately $0.38-to-$0.53 per Kilowatt-Hour (KWH). See Understanding the Cost of Solar Energy
There is considerable variance in the cost of solar energy because sunlight availability varies by geography and climate. With limited sunlight solar costs could be over $1.00 per KWH. In terms of cost per KWH, solar energy is four-to-ten times the cost of hydrocarbon fuels.

Figure 1 Cost per Kilowatt-Hour
Energy Costs

For solar energy to be at parity with conventional fuels solar energy needs to be subsidized through tax incentives, utility rebates, and research funding. Research is perhaps the most important aspect of improving the economics of solar energy because through research companies could dramatically lower production costs. The disconnect in solar energy research is limited funding. Funding is required to incubate ideas and new approaches to solar energy in order to develop a roadmap for commercialized products that in turn, could be embraced by venture capital.

The DOE’s research funding for solar is just a drop in the bucket or barrel that better correlates the magnitude disparity. Electric utilities companies are providing electric power generated mainly through coal, which contributes heavily to CO2 emissions, and yet they don’t spend on research and development towards alternative energies. Large energy companies like Exxon Mobil (XOM) don’t have R&D budgets like pharmaceutical or technology companies that spend 14%-to-20% of their revenues on R&D. Merck (MRK) and Genentech (DNA) spent 17% and 20%, respectively on R&D while Microsoft (MSFT) and Google (GOOG) spent 15% and 14%, respectively on R&D in 2006.

If Exxon Mobil were spending 10% of its 2006 revenues of $377.6 billion towards R&D to develop alternative energies, it would amount to over $37 billion, a figure that is larger than the DOE budget of $23.6 billion. DOE spending on solar energy research is approximately $28 million. According to the DOE, U.S. energy expenditures in 2004 were over $869 billion. So with that amount of money being spent on energy, how much should be spent to avoid dependence on foreign oil?

Figure 2 Historic Energy Spending
Historic Energy Spending

Solar energy and fuel cell technologies have the potential to ameliorate our energy dilemma of foreign oil dependence and risk of climate change from carbon emissions. While it’s hard to measure the economic impact of climate change, our dependence on foreign oil leaves us with growing $450 billion debt for our presence in Iraq and our national security vulnerable to vagaries of oil prices. The Cost of Iraq War The $450 billion the U.S. is spending in Iraq is almost enough money to equip the 124.5 million homes in the U.S. with a 1 KW solar energy system. The U.S. housing units rose to 126.7 million in 2006. Of course that may not cover your total electric usage that averages about 10,760 KWH per household according to data from the Energy Information Administration Electric Power Annual 2005 – State Data Tables

Can higher R&D spending on solar energy help?
Even some of the leading domestic solar photovoltaic cell suppliers are light on R&D spending. SunPower (SPWR) and First Solar (FSLR) are budgeting their R&D spending towards the single digits as a percentage of revenues. Despite relatively low R&D spending levels, SunPower intends to lower solar panels cost by 50% by 2012. Solar photovoltaic cells undergo the same production processes as semiconductors. Experience curves associated with semiconductor production indicate a 20%-to-30% cost reduction with doubling of production. See The experience curve or cost-volume curve article from the Lockwood group TECHNOLOGY TRANSFER: A PERSPECTIVE The solar energy market is expected to grow at 80% over the next five years according to Rhone Resch, president of the Solar Energy Industries Association Solar Leader Expects >80% Market Growth Even without new advances in photovoltaic materials, with a solar energy market growth of 25% and an experience curve of 30%, solar cost could decline by 30% every three years from about $8.90 a watt ($0.45 a KWH) to $2.14 a watt or $0.11 a KWH in 15 years equal to the current price of electricity. The bottom line is that faster market growth and/or increased funding of solar energy research could significantly improve the economics of solar energy and give the U.S. greater security and energy independence.

Solar and alternative energies represent a very small percentage of our total expenditures on energy. Energy Price and Expenditure Estimates by Source
So a substantial reduction of solar energy costs, assuming somewhat elastic demand, we should see significant growth in solar energy. In addition, if we tax hydrocarbon fuels by their respective carbon emissions, we might begin to see level energy playing field.

Figure 3 Energy Spending
Energy Spending

Funding solar energy should be views as a strategic imperative at par with national surety. Energy security should equate to national security and alternative renewable energies should provide us with the means to our energy independence.

Ethanol: Benefits and Issues

There are several studies evaluating ethanol as fuel for transportation that offer both positive and negative impacts from ethanol. On the positive side there is less CO2 emitted from ethanol than conventional hydrocarbon fuels, domestic producers gain economic value from employment and purchasing power, and there is less dependence on foreign oil. Other studies have concluded less efficiencies from ethanol such as negative energy values because of the fertilizers and energy used to produce ethanol is larger than the amount of energy produced, CO2 is released during the fermentation and combustion process, and it still must be blended with hydrocarbon fuels leaving us dependent on foreign oil.

Ethanol is alcohol-based fuel made from crops. Fermenting and distilling starch crops, typically corn, into simple sugars produce ethanol. Chemically ethanol is similar to hydrocarbon fuels in that they both contain carbon and hydrogen atoms.

To understand the economics, let’s compare ethanol to hydrocarbon fuels by efficiency and costs. The first step is to convert the BTU (British Thermal Unit) value of ethanol into Kilowatt-Hours (KWH) in order to have a common measure of energy. Remember the KWH is a useful measure of energy because we can equate KWH to engine horsepower performance and compare hydrocarbon fuels to alternative energies like solar and wind and compare these energy costs on a common level.

Our fuel energy conversion links Energy Units and Conversions KEEP, and Fuel BTUs provide some useful measures to evaluate ethanol in comparison to hydrocarbon fuels like diesel and gasoline.

One KWH equals 3,413 BTUs so we divide the BTU value for each fuel by 3,413 to arrive at its corresponding KWH energy value.

Energy Comparison
1 gallon of ethanol = 84,400 BTUs = 24.7 KWH
1 gallon of diesel = 138,690 BTUs = 40.6 KWH
1 gallon of gasoline = 125,000 BTUs = 36.6 KWH
1 gallon of oil = 138,095 BTUs = 40.5 KWH

Figure 1 Kilowatt-Hours per GallonKWH per Gallon

As seen from figure 1, ethanol is not the most efficient fuel because of its low BTU value in comparison to hydrocarbon fuels. However, ethanol is a form of renewable energy because the crops can be grown to generate more fuel.

Energy Economics

To compare the energy cost of ethanol to hydrocarbon fuels we convert each fuel into a cost per KWH. Our prices are quarterly average U.S. energy prices by fuel type: Ethanol Prices, , and Oil Prices

Figure 2 Cost per Kilowatt-HoursEnergy Costs

On a cost per KWH basis, ethanol is similar to hydrocarbon fuels. So depending on current fuel cost, which varies by location, ethanol could be higher or lower than diesel or gasoline.

On the production of ethanol a bushel of corn produces about 2.76 gallons of ethanol according a study by AgUnited . According to U.S. Department of Agriculture it takes 57,476 BTUs of energy to produce one bushel of corn Energy Balance of Corn Ethanol therefore, for BTU of energy used to produce ethanol there are 4 BTUs of energy gained from the ethanol for transportation.Carbon EconomicsEthanol is produced from fermentation of starch to sugars and is represented by the equation C6H12O6 = 2 CH3CH2OH + 2 CO2 according to University of Wisconsin Chemistry Professor Bassam Z. Shakhashiri The two CO2 molecules given off from the fermentation process of ethanol does add to CO2 emissions, but the growing process and biomass also extract CO2 from the atmosphere.

Emission of CO2 from hydrocarbon fuels depends on the carbon content and hydrogen-carbon ratio. When a hydrocarbon fuel burns, the carbon and hydrogen atoms separate. Hydrogen (H) combines with oxygen (O) to form water (H2O), and carbon (C) combines with oxygen to form carbon dioxide (CO2). How can a gallon of gas produce 20 pounds of CO2 To measure the amount of CO2 produced from a hydrocarbon fuel, the weight of the carbon in the fuel is multiplied by (44 divided 12) or 3.67. For ethanol we compared its basic structure to gasoline, diesel, and crude oil.

In the combustion process, ethanol produces CO2 at a rate that is below that of gasoline. The equation for ethanol combustion is C2H5OH + 3 O2 –> 3 H2O + 2 CO2. Ethanol Combustion In our simple example, the carbon weight in ethanol (two carbon with a combined atomic weight of 24 to a total weight of 46 for the molecule of C2H5OH) is multiplied by 3.67 to determine the amount of CO2 produced from ethanol. We then compared the output of CO2 to the amount of energy produced to arrive at pounds of CO2 per KWH. Bottom line is that ethanol emits 11% less CO2 than gasoline and is a renewable fuel.

Figure 3 Pounds of CO2 by Fuel TypeEthanol CO2

There are several studies on ethanol with the majority indicating benefits. Some of these include: High-level ethanol blends reduce nitrogen oxide emissions by up to 20% and ethanol can reduce net carbon dioxide emissions by up to 100% on a full life-cycle basis. Ethanol Benefits and Clean Cities While ethanol produces less CO2 than gasoline, it still emits CO2 and keeps us dependant upon hydrocarbon fuels.

For further information on fuel combustion Combustion Equations and for Energy to Produce Ethanol Ethanol Production

How vulnerable are we to energy shocks?

The second category 5 hurricane to hit Caribbean in two weeks leaves uncertainty in the energy market as oil prices head higher. While it is hard to draw the direct correlation between global warming and hurricanes strength, the fact is the oil production in the Gulf of Mexico accounts for 32% of our total oil production. In addition, the Gulf of Mexico is one the most productive oil and gas region as the U.S. faces declining petroleum product production despite significant increase in the number of oilrigs. The increasing likelihood of a weather related energy supply disruptions particularly from the Gulf area could dramatically increases to energy prices similar to Hurricane Katrina’s impact in 2005.

Higher oil prices have driven demand for energy exploration and investment into oil and gas drilling rigs. Since 1999, the number of drilling rigs has increased 112%. In the U.S., rig count is up 181% with 1,749 rigs in operation in 2007 from 622 in 1999 according to Baker Hughes. Worldwide Rig Count
According to RigZone there are 278 offshore drilling rigs in the Gulf of Mexico RigZone

Figure 1 Worldwide Rig Count
Worldwide Rig Count

Figure 1 provides the rig count for the U.S. and the world. The U.S. accounts for over half the world oil drilling rigs yet our production is less than 10% of total global production. The Gulf of Mexico with 278 drilling rigs produces 32% of our oil with only 16% of the rigs. Hurricane Impacts on the U.S. Oil and Natural Gas Markets The rigs in the Gulf of Mexico are more productive and therefore any weather related disruption in the Gulf leaves us more vulnerable to energy shocks.

Figure 2 US Rig Count and Oil Production
Rig Count and Oil

While the U.S. rig count is up 118% from 1999, petroleum production is actually down 7%. On a global basis, oil and petroleum product production increased 13% since 1999 and this includes a 60% increase in the number of drilling rigs excluding the U.S. The bottom line is the U.S. and the rest of the world is experience diminishing returns on investments in oil production.

With diminishing returns on investment into oil, would it not be better to invest into alternative energy such as solar or wind. The truth is the cost of solar and wind are still dramatically higher than hydrocarbon fuels. The cost of solar on a kilowatt-hour (KWH) basis is approximately $0.38 per KWH in comparison to oil at $0.05 per KWH.

Figure 3 Cost per Kilowatt-Hours
Energy Costs

Initiatives such as the trading of carbon credits leave little economic incentive to invest into alternative energy. A survey last year by TreeHugger found carbon credits trading for $5.50 to $13 per metric ton of carbon dioxide. Survey of Carbon offsets A metric ton of carbon dioxide equates to about 110 gallons of gasoline and at these prices, the carbon emission amounts to about $0.05-to-$0.12 to a gallon of gasoline. The carbon penalty does not even come close to bringing solar or wind energy on the same playing filed with hydrocarbon fuels. The Carbonfund organization offers a means to offset your carbon emissions with tax-deductible contributions

The cost of carbon emissions is not reflected in the market for energy. In addition, the market is unable to establish a fair price for carbon because there is no market force used to establish the value of carbon credits. We need a mechanism to bring solar energy at par with hydrocarbon fuels to limit our vulnerability to energy shocks and supply disruptions.

How to measure fuel efficiency, energy costs, and carbon emissions for home heating

To measure the efficiency of conventional hydrocarbon fuels, we need a common measure of energy. The Kilowatt-Hours (KWH), the billing quantity of electric usage, serves as a useful measure of energy because we can equate KWH to engine horsepower performance, heat energy of a fuel, and compare energy costs on a common level. KWH can be used to determine which fuel is most efficient by measuring the heat output of each fuel.

A BTU is the amount of heat necessary to raise one pound of water by one degree Fahrenheit and each fuel has its own BTU measure. For example, one ton of coal produces about 21.1 million BTUs, which would equate to 6,182 KWH. One KWH equals 3,413 BTUs.

A framework to measure energy costs is to convert each fuel type into KWH of energy. Some helpful links to common fuel conversions Energy Units and Conversions KEEP, BTU by Tree, and Fuel BTUs

We want to establish common energy measure to evaluate home heating fuel efficiency for each fuel type. Our first step is to measure the BTU value for each fuel type. The next step is to divide the BTU value for each fuel by 3,413 to arrive at its corresponding KWH energy value.

Kilowatt-Hour per Unit of Fuel
The energy value of a unit of fuel depends on its mass, carbon and hydrogen content, and the ratio of carbon to hydrogen. In general, hydrogen generates approximately 62,000 BTU per pound and carbon generates around 14,500 BTUs per pound. The combustion process is complex and while higher hydrogen content improves energy BTU levels, not all hydrogen goes to heat. Some hydrogen combines with oxygen to form water. Coal Combustion and Carbon Dioxide Emissions

Energy Comparison
1 pound of wood = 6,401 BTUs = 1.9 KWH
1 pound of coal = 13,000 BTUs = 3.8 KWH
1,000 cubic foot of natural gas = 1,000,021 BTUs = 299 KWH
1 gallon of oil = 138,095 BTUs = 40.5 KWH
1 gallon of propane = 91,500 BTUs 26.8 KWH

Figure 1a Kilowatt-Hours per Pound
KWH per Pound

As seen from figure 1, natural gas provides the highest efficiency level followed by oil. Wood offers the lowest efficiency per pound at 1.9 KWH/lb and is followed by coal with twice the efficiency at 3.8 KWH/lb. Oil offers almost a 70% efficiency improvement over coal and propane is just slightly more efficient than coal.

Fuel Energy Efficiency
Wood = 1.9 KWH per pound
Coal = 3.8 KWH per pound
Natural Gas = 6.9 KWH per pound (liquid and gas measures are calculated at 6.3 pounds per gallon)
Oil = 6.4 KWH per pound
Propane = 4.3 KWH per pound

This is not the full story. While the energy efficiency of the fuel is important, a lot depends on the fuel efficiency of the stove or furnace that is used to heat your home. The heating efficiency of your stove or furnace has a substantial impact on the overall efficiency of the fuel’s heat value. The adjusted KWH in figure 1 indicates the fuel efficiency adjusted for the efficiency of the heating system. There is also some variance in the fuel efficiency given impurities, temperature, and water presence.

Adjusted Fuel Energy Efficiency
Wood @ 1.9 KWH per pound and stove efficiency of 70% equals 1.3 KWH/lb
Coal @ 3.8 KWH /lb and stove efficiency of 70% = 2.7 KWH/lb
Natural Gas @ 6.9 KWH /lb and furnace efficiency of 95% = 6.5 KWH/lb
Oil @ 6.4 KWH /lb and furnace efficiency of 85% = 5.5 KWH/lb
Propane @ 4.3 KWH /lb and furnace efficiency of 95% = 4.0 KWH/lb

Figure 1b Kilowatt-Hours per Kilogram
KWH/kg

Figure 1b proves the same fuel types measured by liters and kilograms. While the absolute numbers are different, the relative fuel efficiency among the fuels is the same.

Energy Economics

The final phase of our fuel efficiency exercise is to compare an economic measure of fuel cost. The market price of fuel will vary by location, usage amount, and market conditions. Our prices were quarterly average U.S. energy prices by fuel type:
Natural Gas Prices, , Oil Prices, and Propane Prices
Coal and wood prices were based on local residential delivery.

Figure 2 Cost per Kilowatt-Hours
Energy Costs

Coal and wood are among the lowest priced fuels. However, coal and wood require extensive hands-on control and cleaning which are not factored into costs. Natural gas is offered in many urban areas and is currently priced below oil or propane. Natural gas offers higher energy efficiency and is priced lower than oil or propane, but is not available in all urban markets and very limited rural availability.

The trade off between oil and propane, which can be found in most markets, is operating efficiency and maintenance. Modern oil furnaces are demonstrating higher operating efficiencies, but cost significantly more than propane. Oil does offer higher efficiency than propane, but maintenance costs are higher for oil furnaces and that cost is not reflected in these fuel costs measures.

Electric heat in some markets where utility rates are below oil or gas may offer favorable economics, but electric rates might be going higher as utilities switch to lower carbon emission fuels. The challenge is to migrate electric utilities from lower-priced coal with high CO2 emissions to natural gas with lower carbon emissions. The cost to lower CO2 emissions from coal burning utilities could force natural gas prices to rise. The bottom line is that energy prices will continue to rise with natural gas tide to oil production. Even with higher fuel prices, there is still a tremendous disparity between conventional and alternative energies with the cost of solar near $0.38 per KWH and residential electric rates of $0.11 per KWH.

Carbon Economics

Emission of CO2 from hydrocarbon fuels depends on the carbon content and hydrogen-carbon ratio. When a hydrocarbon fuel burns, the carbon and hydrogen atoms separate. Hydrogen (H) combines with oxygen (O) to form water (H2O), and carbon (C) combines with oxygen to form carbon dioxide (CO2).
How can a gallon of gas produce 20 pounds of CO2

From this example, a carbon atom has an atomic weight of 12, combines with two oxygen atoms each with a weight of 16, to produce a single molecule of CO2 an atomic weight of 44. To measure the amount of CO2 produced from a hydrocarbon fuel, the weight of the carbon in the fuel is multiplied by (44 divided 12) or 3.67.

Wood has half the carbon content than coal, but coal is twice as efficient as wood and therefore both have nearly the same high level carbon footprint. Oil benefits from having higher energy efficiency than propane giving oil 30% lower CO2 emissions pound for pound.

Figure 3 Pounds of CO2 by Fuel Type
Component Costs

Natural gas, because of its low carbon content and high fuel efficiency, achieves lower CO2 emissions than oil, propane, or coal. Natural gas produces 46% less CO2 than coal and 10% less than oil. With coal relatively abundant and cheap in comparison to oil or natural gas, energy prices may increase as electric utilities switch to lower CO2 emission natural gas or invest into emission reduction processes that add to capital costs and operating expense.