Solar Energy – Closer to Grid Parity?

Last month First Solar (FSLR) achieved a milestone in the solar industry with its announcement of $1 per Watt reducing its production cost for solar modules to 98 cents per watt, thereby braking the $1 per watt price barrier.. While the achievement is great news for the solar industry some studies suggest more work is needed. An article in Popular Mechanics $1 per Watt talks of university studies questioning the scalability of solar given the immense global needs for energy. Last year our post included an article Solar Energy Limits – Possible Constraints in Tellurium Production? discussing possible limits on tellurium production on thin film solar photovoltaic (PV) suppliers.

In addition, Barron’s published an article (March 30, 2009)_ Nightfall Comes to Solar Land providing unique insight into the economics of solar PV suppliers. High oil prices and soaring stock prices on solar PV companies fueled silicon suppliers to ramp production capacity that has now transitioned, according to the Barron’s article, into an over supply of polysilicon used in the production of PV panels and subsequently, eroding the cost advantage established by thin film PV companies such as First Solar and Energy Conversion Devices (ENER) over polysilicon PV firms such as SunPower (SPWRA).

However, the PV panels typically represent approximately half the cost of a solar energy system. The following figure, Solar Installation Costs compares the total cost of installing a solar energy system which includes labor and supporting matertials.

Figure 1 Solar Installation Costs install

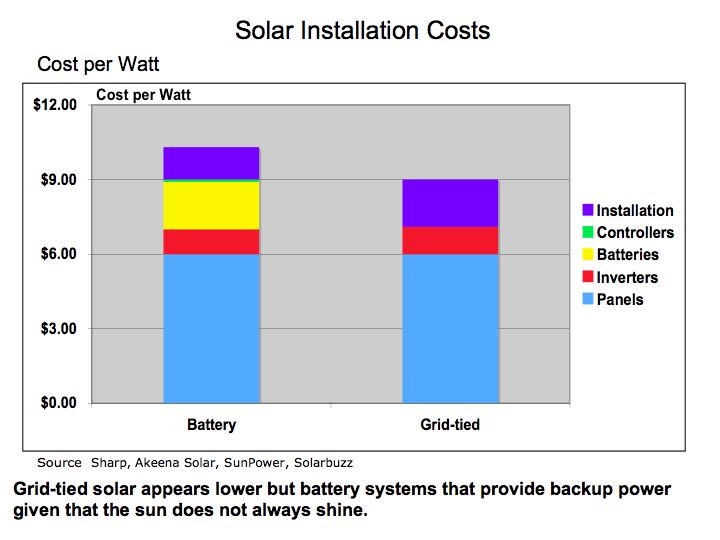
As illustrated in Figure 1, the panels represent a significant cost of installation, but the labor and support brackets for the PV panels are significant as well. While thin film PV enjoys significantly lower panel costs and is easier to install, the supporting brackets are sometimes more expensive. As prices for silicon fall, the cost disparity between thin film and silicon PV will narrow.

Figure 2 Solar Energy Economics econ

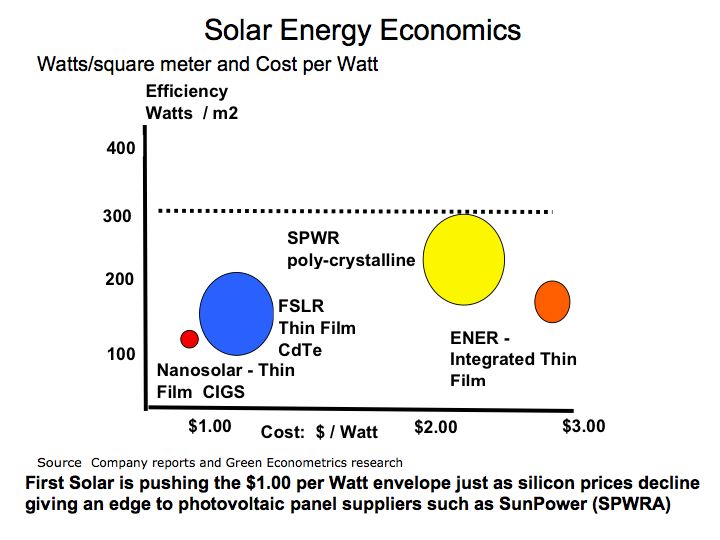
In Figure 2 Green Econometrics is comparing PV efficiency as measured by watts per square meter versus cost per watt. The selected companies represent a small portion of the global PV suppliers, but do illustrate the position of the leading US suppliers. The ideal model is to lower cost per watt while improving PV efficiency. But be cognizant that PV module cost per watt may not be indicative of the total system costs.

A comparison of wind and solar energy costs is demonstrated by Detronics and offers a useful framework to compare wind and solar costs by kilowatt-hour (KWH). As a caveat, wind and solar resources will vary dramatically by location. In the Detronics example, the costs per KWH represent the production over one year and both wind and solar have 20-year life spans. Over twenty years the 1,000-watt wind systems cost per KWH of $7.35 would average approximately $0.36 per KWH and the 750-watt solar systems cost of $10.68 would amount about $0.53 per KWH over the investment period.

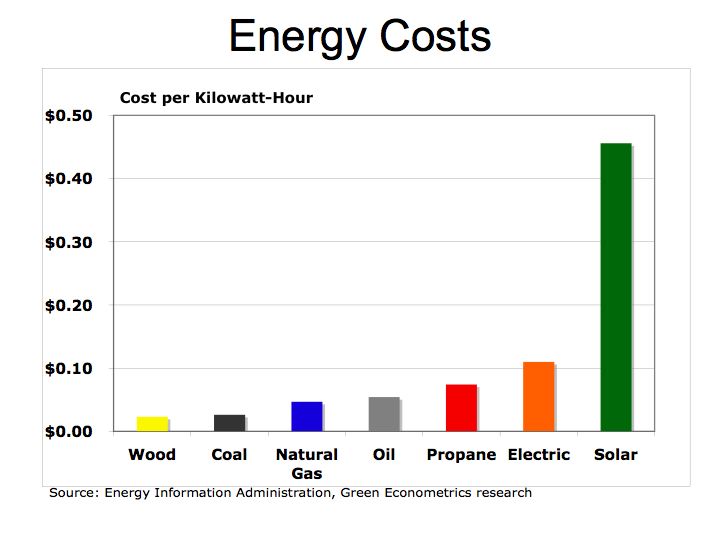
Figure 3 Alternative Energy PricingEnergy Pricing

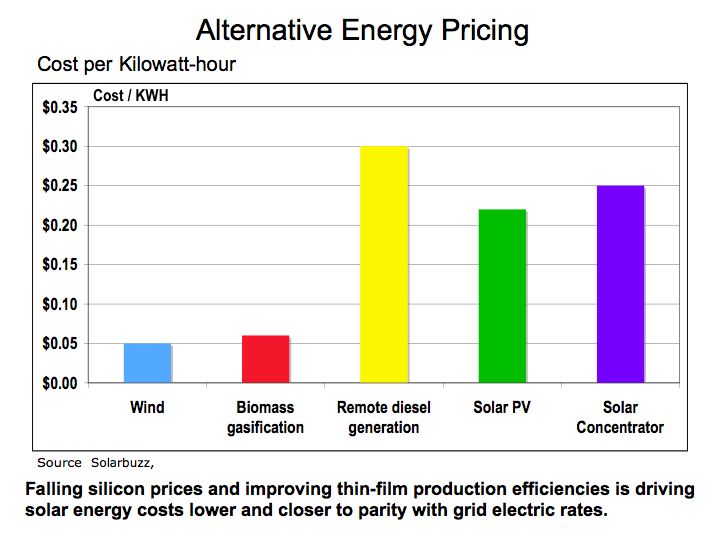
The Alternative Energy Pricing chart was base on research from Solarbuzz which is one of the leading research firms in solar energy. The cost per KWH that Solarbuzz provides is a global average. Even with cost per watt falling below $1.00, the system costs after installation are closer to $5.00 according to Abound Solar (formerly known as AVA Solar) and is still higher than parity with grid with a cost of $0.21 per KWH.

The bottom line is that despite the lower PV panel costs; we are still not at parity with hydrocarbon fuels such as coal and oil. Carbon based taxing or alternative energy stimulus and more investment into alternative energy is required to improve the economics of solar and wind.

Dramatic Drop in Oil Consumption – What’s the Implication?

America’s appetite for oil declined sharply as the economy weakened over 2008. According to the latest reported information from the Energy Information Administration (EIA), Monthly Oil Consumption oil consumption declined 13% y/y from September 2007 through September 2008.

Historically, the US has seen this type of demand erosion before. From 1979 to 1983, oil demand in the US declined 28% with annualized rate of a 10% decline per year. Over this same period, oil prices actual rose despite the fall in demand. Oil prices by barrel (42 US gallons) rose from $3.60 in 1972 to $25.10 in 1979. In 1983, oil prices increased to $29.08 a barrel, representing an increase of nearly 16% from 1979.

Economics would normally dictate that as demand declines so should prices. However, the geopolitical events and oil supply disruption maintained higher oil prices despite the subsequent decline in oil demand. It was not until structural changes in energy conservation and driving patterns were felt before leading to a fall in oil prices during the 1980’s.

Figure 1 Monthly Oil Consumption Oil Demand

As illustrated in Figure 1, the precipitous fall in oil demand over the last half of 2008 is quite dramatic in comparison to historical price data. The large fluctuations in monthly oil consumption during the 70’s and 80’s, were primarily due to supply disruptions. The higher oil prices resulting from supply disruptions over this period led to structural changes in the energy market that later resulted in falling oil prices.

Figure 2 Oil Prices Oil Prices

While falling demand and rising oil prices during the 70’s and 80’s is an anomaly, we see from Figure 2, that currently there is significant correlation between falling oil demand and a subsequent decline in the price of oil. Excluding the peak oil price in July 2008, oil declined 33% from the average price per barrel of $64 in 2007.

Perhaps the precipitous fall in oil prices can explain why demand for oil on a global basis has not declined as dramatically as in the US. As we can see from Figure 3, the drop in US oil consumption is matched with a slight increase in demand in Europe and only a moderate decline in Japan.

Figure 3 Global Oil Demand Global Oil Demand

The bottom line is the financial shock that hit global markets is dramatically impacting consumption. As a recovery inevitably ensues, demand for oil will increase and so will oil prices. Let’s not be complacent with hydrocarbon fuels. Falling energy prices act as a disincentive for investment into alternative energies.

Obama, Energy Efficiency and Lighting Retrofit

As President Obama takes office, energy efficiency takes center stage. One of he fastest roads to energy efficiency is to reduce consumption and the simplest approach to energy conservation is to change a light bulb.

Compact Fluorescent Light bulbs (CFL) recommended by the U.S. Department of Energy (DOE) offer substantial savings to homeowners. In the commercial market, lighting fixtures consume the greatest amount of electric energy; three times the energy consumption of air conditioning. According to research report from the Energy Information Administration (EIA), Commercial Buildings Energy Consumption Survey lighting consumes the largest amount of electricity in commercial buildings as measured by Kilowatt-hours (KWH) per Square Foot

To calculate KWH, multiply the wattage of your lighting fixture x the yearly hours of operation for your facility divided by 1,000. KWH per square foot provides a useful means of measuring the energy intensity of a building. Just divide KWH by the total square footage of the building.

In an energy audit one can determine the energy intensity of your building as measured by KWH/Sq Ft. Figure 1 illustrates the energy intensity by end use according to the EIA’s report in 2008 Electricity Consumption (kWh) Intensities by End Use.

Figure 1 Lighting Consumes Most Energy Lighting KW

Furthermore, as part of the same research from the EIA, most commercial buildings are not using energy efficient lighting. The study finds that most commercial buildings, even those built after 1980, still rely on legacy incandescent and standard fluorescent light fixtures.

Figure 2 Most Commercial Buildings Lack Energy Efficient Lighting Commercial Buildings

After your energy audit is complete and one knows their energy intensity the next step is to understand the efficiency of lighting systems. Lighting efficiency is measured in Lumens per Watt and is calculated by dividing the lumen output of the light by the Watts consumed. A lumen is one foot-candle foot-candle falling on one square foot of area.

While lumen output is important in measuring brightness, color temperature, measured in degrees Kelvin, indicates the hue color temperature of the light and is also important in evaluating lighting systems because lighting systems operating near 5500 degrees Kelvin simulate sunlight at noon. Energy efficient lighting fixtures provide twice the lumens per watt of electricity than legacy metal halide fixtures while offering higher color temperature enabling near daylight rendering.

Figure 3 Energy Efficient Lighting  Lighting

The bottom line is small steps sometimes produce big results. Retrofitting your building with energy efficient lighting systems saves energy, reduces operating expenses, and improves employee productivity and safety, while saving the environment. A 1.3 KWH reduction in power consumption reduces carbon dioxide (CO2) emissions by 1 pound. Coal generates about half the electric power in the U.S. and produces roughly ¾ of a pound of CO2 for every KWH of electric. In addition, the feasibility of alternative energy such as solar and wind are more viable by reducing energy consumption in buildings.

Vote the Economy by Voting for Energy

Access to energy was instrumental fueling the Industrial Revolution. Over the last 200 years, industrial nations have migrated from wood to coal and now to oil as a source of energy. During the 1700’s, wood was used for just about everything from fuel to constructing houses and building wagons and even tools. As demand for wood increased, the cost of wood rose as deforestation led to the scarcity. The scarcity of wood resulted in deteriorating economics.

It was the availability and access to coal that enabled the growth of Industrial Revolution by providing accessible energy. The Industrial Revolution was predicated upon the availability of Labor, Technology, Capital, and Energy. Scarcity of any of these inputs could undermine economic growth, as was the case with capital during the Great Depression of the 1930’s and the Energy Shock of the 1970’s.

Oil, driven by rapid growth in automobile usage in the U.S, has replaced coal as the main energy fuel. According to the Energy Information Administration (EIA), the 70% of oil consumption in the U.S. is for transportation .

Figure 1 US Oil Imports Oil Imports

Figure 1 illustrates US historical oil imports, as measured by the Energy Information Administration in U.S. Crude Oil Field Production (Thousand Barrels per Day) that dates back to 1970. The EIA provides oil import data dating back to 1910. To estimate the amount of money the US spends on oil imports every year, we can use the data from the State of Alaska Department of Revenue, which provides historical data on the price of oil an derive an average yearly figure.

Figure 2 US Oil Import Spending Oil Spending

Figure 2. appears quite staggering given the amount of money we send to oil producing countries. The US is spending hundreds of billions to import oil. According to the EIA, the US imported an average of 10,031,000 barrels per day equating to $263 billion in imported oil during 2007 when the State of Alaska measured the yearly average spot price for a barrel of oil at $72.

According to Solarbuzz, Germany leads the world in solar photovoltaic (PV) installations with 47% of the market while China increased its market share of PV production from 20% to 35%. The US accounts for 8% of the world solar PV installations. Solarbuzz indicates the global solar PV industry was $17 billion in 2007 and the average cost of solar electricity is $0.2141 per KWH. If a portion of our $260 billion sent to oil producing countries were to be invested into solar energy, perhaps the US would not lag the world in alternative energy.

The bottom line is that the money spent on importing oil has a deleterious impact on our economy and continues our dependence on hydrocarbon fuels producing carbon and other harmful byproducts that negatively impact our climate and health of our children. The longer we are dependent on oil, the longer our economy and environment suffer. Use your vote for alternative energy and not drill baby drill.

Energy Crisis- Can we drill our way out?

Rising energy prices and our diminishing supply of oil threaten our national security. Without access to energy our economy and national defense are vulnerable to collapse. As a solution to our energy needs, we hear political rhetoric to expand oil drilling, but our energy strategy requires a long term solution that means embracing alternative/renewable energy technologies such as solar and wind. It only takes a quick review of oil production statistics to realize how formidable the challenge is that we face.

According to the Energy Information Administration (EIA) in 2007, the US consumed 20.6 million barrels of oil per day (bpd) but we were only able to produce 8.5 million bpd, leaving a deficit of approximately 12.2 million bpd. This means the US needs to import 60% of its oil and at a cost of $130 per barrel, the US will spend approximately $600 billion a year on imported oil.

Oil prices have increased dramatically with an increase of 420% since 2001. The combined impact of rising prices and diminishing oil production leaves the US in a precarious position. Yet, drilling for more oil may not rectify this tenuous situation.

As an example, back in the 1980’s, drilling activity in Alaska helped to ameliorate the oil crisis of the 1970’s. Today, oil production in Alaska has declined significantly. From its peak in 1988, oil production in Alaska has decline 64%. In Figure 1, oil production in Alaska in contrasted to the price of oil per barrel from 1980 to June 2008.

Figure 1 Alaska Oil Production
Alaska Oil

When we measure the supply and demand for oil, we find in the US, it is really a supply problem. According to the EIA , US demand for oil is growing at an annual rate of one percent over the last ten years, but oil production is down 20% since 1987.

Figure 2 US Oil Production
Oil

The energy problem however, is global. The demand for oil in the US may slow, yet supply constraints driven by growing consumption in developing countries could exacerbate this already bleak picture. On a per capita basis, the US consumes approximately 25 barrels of oil per person annually or a little over 600 gallons a year. That figure greatly exceeds other countries and particularly those in developing nations such as China.

In China, oil consumption per person is only 2 barrels or 84 gallons a year. However, oil consumption in China on a per capita basis has increased 88% from 1996 to 2006 according to data from the EIA. Despite China’s one percent population growth, at its current oil consumption growth rate, China is expected to double its current oil consumption by 2015 to over 14 million bpd and exceed the US in oil consumption by 2020. China’s current oil appetite suggests that in 14 years China will require an additional 14.6 million barrels per day. Even if oil producing countries are able to produce the additional oil, those countries that are unable to meet their own needs such as the US and China, will continue to be held hostage to oil producing states.

Figure 3 China Oil Consumption per Capita
China Oil

The bottom line: the energy model based on hydrocarbon fuels is broken. Neither drilling for more oil will not satisfy our energy needs nor will corn-based ethanol. We need to rapidly embrace electric vehicles using solar, wind, and fuel cell technologies to provide alternative energy solutions. It time to put energy as the most critical component of our national security. Energy should be front and center for the US election. It’s time to invest into clean and renewable energy solutions.

Solar Energy Limits – Possible Constraints in Tellurium Production?

Solar energy is gaining considerable attention from Wall Street and countries looking to achieve energy independence. Solar energy represents one of the most significant energy solutions to help eradicate our addiction to oil. Despite the tremendous success offered with solar photovoltaic (PV), more research is required to sustain further deployment and achieve energy independence. Some semiconductor materials used to develop photovoltaic devices are scarce and may limit PV from achieving mass penetration. Let’s review the current solar PV market to better understand the dynamics of this market.

Figure 1 PV Production by Year
PV Production

Figure 1 demonstrates the rapid market growth of solar PV and Solarbuzz is astute to point out some critical data points: cumulative PV deployment is still less than 1% of global electric usage, PV industry faces capacity constraints, and Germany and Spain account for 47% and 23% of total PV deployment in 2007. With the significant growth in both the production and deployment of solar PV devices, the stock price of some of the leading PV suppliers have appreciated dramatically even despite a recent pull back in the beginning of the year.

Figure 2 PV Production of Leading Suppliers
MkPV Suppliers

Despite the turbulence on Wall Street in 2008 with the NASDAQ down 14% year-to-date, and Dow Jones Industrial Average down 7.3% YTD, investor appetite for clean technology stocks remains robust. First Solar (FSLR), a leading supplier of thin film solar PV remains in positive territory and is up nearly ten-fold from its IPO in November 2006. Thin film PV offers a cost advantage over traditional crystalline PV cells. PV devices employ various elements with different band gap properties to achieve improving solar efficiencies. (See our post on semiconductor band gaps: What’s Pushing Solar Energy Efficiency?, October 1st, 2007)

Figure 3 Market Capitalization Solar PV Suppliers
Mkt Cap

There are several elements used in thin film PV production. Among the elements used include cadmium and tellurium (CdTe), copper, indium, and selenium, (CuInSe), and copper, indium, gallium, and selenium (CIGS). These various elements are used to improve operating efficiencies and lower production costs of PV devices. In general, crystalline PV devices have higher solar efficiencies, but cost more due to their material thickness of 200-to-300 microns. Whereas, thin film PV are usually about 3 microns deep offering significantly lower production costs. However, SunPower (SPWR) the leading polycrystalline silicon PV supplier offers the highest solar efficiency a rating of 22.7% that started shipping in 2007.

Figure 4 FSLR and SPWR Solar PV Production
Mkt Cap

FSLR and SPWR are the two leading PV players as measured by Wall Street in terms of market valuation. The cost-efficiency tradeoff between these two PV suppliers offers an interesting framework to evaluate the solar PV market.

Figure 5 PV Cost-Efficiency
Cost-Efficiency

The stock market appears to be betting on FSLR given its market capitalization of $22 billion and trading at 43 times 2007 revenues of $504 million. FSLR employs CdTe in its solar modules. In several postings on Seeking Alpha starting back in November 2007, Anthony and Garcia de Alba have provided valuable insight into material constraints in the production of PV devices.

Tellurium is a rare metalloid element that is used in producing semiconductor materials because it does not conduct electricity. Tellurium is recovered as a by-product in refining and processing of gold and copper as well as other ores. Tellurium was primarily used to create metal alloys that enable easier machining of end products.

Because of its unique properties, Tellurium and cadmium (CdTe) have been used in thin film PV production since the 1980’s. According to a comprehensive study by Fthenakis and earlier work by Moskowitz “The Life Cycle Impact Analysis of Cadmium in CdTe PV Production”, CdTe is deposited on a thin film substrate using electrodeposition, chemical surface deposition, and vapor transport deposition. FSLR reports in their 10K that they employ a proprietary vapor transport deposition process for CdTe PV production.

A thin film of CdTe is deposited on a substrate at a thickness of 3 microns. According to the Fthenakis and Moskowitz, back in the 1980’s, a 10 megawatt (MW) PV facility employing vapor transport deposition of CdTe uses 3,720 kilograms (kg) of CdTe to achieve a10% efficiency at 3 microns. A one-one bond of CdTe with an atomic weight of Cd at 112.41 and Te at 127.60 suggests Te comprises 53% of the weigh of CdTe. With 3,720 kg of CdTe used at 10MW, the amount of Tellurium used is estimated at 1,978 kg or 197.8 kg/MW.

The electrodeposition CdTe process using a mixture of cadmium sulfate and tellurium dioxide used 880 kg of tellurium dioxide, which amounts to approximately 696.8 kg of Te for 10 MW PV productions. The electrodeposition CdTe process would equate to about 69.7 kg of Te per MW. For a 100 MW PV production approximately 7 tons of Te are consumed.

One would assume the PV production process would improve significantly from the 1980’s and the amount of Te consume would decline with improving efficiencies. This would suggest that FLSR at 200 MW PV capacity in 2007 would consume somewhere between 14 and 38 metric tons of tellurium. This figure is significantly higher than the estimates derived from the FSLR tellurium posts on Seeking Alpha that are closer to10 tons per 100 MW (100 kg/MW).

Figure 6 Te Production
Te

Let’s proceed with the conservative figure of 100 kg/MW (10 tons at 100 MW) to assess the tellurium constraints. Tellurium production is a by-product of gold, copper and other ores. We have found Te production estimates ranging from 132 metric tons (MT) to 300 MT per annum. In a National Renewable Energy Laboratory (NREL) report Assessment of Critical Thin Film Resources in 1999 estimated Te production between 200 and 300 metric tons per year in 1997 and indicated under utilization of capacity for the production of tellurium.

Let’s compare our conservative estimate of 100kg/MW Te usage for FSLR to the optimistic production forecast of 300 MT to evaluate capacity constraints for FSLR. With 300 MT (300,000 kg) global Te production and FSLR using 80% of the Te production, capacity of PV tops out at 2,400 MW (2.4 GW).

The U.S. electric energy usage in 2006 was 4,059.91 billion kilowatt hours (KWH) which translates into 463,460 MW (divide 4060 by 365 days x 24 hours). So without significant investment into research and development for PV FSLR could be constrained at 2,400 MW representing only 0.5% of the U.S. electric usage in 2004. Further more, if FSLR were to be constrained at 2.4 GW annual production, revenues ($2.60 per watt Q4/07) would peak at approximately $6.24 billion, a price-to-sales multiple of 3.4x with its market capitalization of $22 billion.

However, in comparison to leading companies in energy, pharmaceuticals, technology and finance, FSLR’s market capitalization is relatively small. Perhaps with improving production processes, FSLR could reduce the amount of Te per panel and improving mining and metal refinement process could increase Te production to expand the market for CdTe thin film PV devices.

Figure 7 Market Capitalization of Leading Companies
Mkt Cap

The bottom line is that more research and investment into alternative energies is required to ameliorate the world from being held hostage to oil and hydrocarbon fuels that are directly linked to rising CO2 levels and climate change.

Oil Tax could Facilitate Alternative Energy Development

Oil continues to trade above $100 per barrel with the NYMEX CRUDE FUTURE closing at $101.84 on the last day of February 2008 and the US House of Representative passes legislation to raise $18 billion in new taxes for Big Oil to foster development of alternative energies. While President Bush plans to veto the legislation and Republicans claim the legislation unfairly impacts the oil industry, let’s look at the numbers. The legislation calls $18 billion tax over the next ten years so the impact amounts to $1.8 per year. The oil demand is approximately 20.6 million barrels per day according the to latest data from the Energy Information Administration. With oil at $100 per barrel the US will spend about $2 billion a day on oil and that equates to over $750 billion a year. In comparison to the total amount of oil we use, the tax is about 2/10th of one percent.

Figure 1 US Oil Supply and Demand
US OIL

Well maybe that’s not a fare comparison. The bill, H.R. 6, the CLEAN Energy Act. would roll back two tax breaks for the five largest U.S. oil companies and offer tax credits for energy efficient homes and gas-electric hybrid vehicles.
According to the CNN article, the money to be collected over the 10-year period would provide tax breaks for solar, wind and other alternative energies and for energy conservation. The legislation was approved 236-182, and is expected to cost the five largest oil companies an average of $1.8 billion a year over that period, according to an analysis by the House Ways and Means Committee. So in other words this bill just repeals tax breaks given to Big Oil to become more competitive in the global market.

Figure 2 Oil Prices and World Rig Count
OIL PRICES

So what is the $1.8 in tax impact on Big Oil? Let’s just look at the impact this would have if just Exxon Mobil Corp (XOM) had to endure the tax only. Exxon Mobil generated $404 billion revenues in 2007, which means if Exxon had to face this tax only, it would be less than ½ of 1% of revenues. Considering that some states impose a 6% sales tax on consumers, a tax impact of 0.2% on the largest oil companies seems rather innocuous.

If the world has to depend upon OPEC oil production, questions do arise over the expansion of oil production and OPEC’s willingness to supply oil despite oil over $100 per barrel. As figure 3 illustrates production among OPEC nations is faltering. Could this be a prelude to Peak Oil?

Figure 3 OPEC Oil Production
OPEC Oil

The bottom line is that without incentives and further research on alternative energies, the world continues to be held hostage to oil and hydrocarbon fuels which are directly linked to rising CO2 levels and climate change.

The Economics of Energy – why wind, hydrogen fuel cells, and solar are an imperative

From the Industrial Revolution we learned that economic growth is inextricably linked to energy and as a result, our future is dependent upon equitable access to energy. When the Stourbridge Lion made entry as the first American steam locomotive in 1829 it was used to transport Anthracite coal mined in nearby Carbondale, PA to a canal in Honesdale that in turn linked to the Hudson River and onto New York City. Coal fueled the growth of New York and America’s Industrial Revolution because coal was cheap and more efficient than wood.

Advances in science and technology gave way to improvements in manufacturing, mining, and transportation. Energy became the catalyst to industrial growth. Steam power such as Thomas Newcomen’s steam powered pump in 1712 developed for coal mining and James Watt’s steam engine in 1765 were initially used to bring energy to market.

In terms of heating efficiency, coal at the time offered almost double the energy, pound for pound, in comparison to wood. Energy Units and Conversions KEEP Oil offers higher energy efficiencies over coal and wood, but as with most hydrocarbon fuels, carbon and other emissions are costly to our economy and environment.

With rapid growth in automobile production in the U.S., oil became the predominant form of fuel. According to the Energy Information Administration, in 2004 the U.S. spent over $468 billion on oil.

Figure 1 U.S. Energy Consumption by Fuel
Energy Consumption

We all need to become more conversant in understanding energy costs and efficiency and as a corollary, better understand the benefits of renewable energy such as solar, wind, and hydrogen fuel cells. A common metric we should understand is the kilowatt-hour (KWH) – the amount of electricity consumed per hour. The KWH is how we are billed by our local electric utility and can be used to compare costs and efficiency of hydrocarbon fuels and alternative energies.

One-kilowatt hour equals 3,413 British Thermal Units (BTUs). One ton of Bituminous Coal produces, on the average, 21.1 million BTUs, which equals 6,182 KWH of electric at a cost of about $48 per short ton (2,000 pounds). That means coal cost approximately $0.01 per KWH. To put that into perspective, a barrel of oil at $90/barrel distilled into $3.00 gallon gasoline is equivalent to 125,000 BTUs or 36.6 KWH of energy. Gasoline at $3.00/gallon equates to $0.08 per KWH. So gasoline at $3.00 per gallon is eight times more expensive than coal.

Is oil and gasoline significantly more efficient than coal? Let’s compare on a pound for pound basis. A pound of coal equates to about 10,500 BTUs or approximately 3.1 KWH per pound. A gallon of gasoline producing 125,000 BTUs weighs about 6 pounds equating to 6.1 KWH per pound (125,000 /3,413 /6). While gasoline is almost twice as efficient as coal, coal’s lower cost per KWH is why it is still used today to generate electric.

The Bottom Line: the economics of energy determines its use – coal still accounts for approximately half of our electric generation because it has a lower cost than other fuels. However, there are two factors to consider 1) the cost of carbon is not calculated into the full price of coal or other hydrocarbon fuels and 2) the cost of conventional fuel is calculated on a marginal basis while alternative fuel costs are calculated on a fixed cost basis. Meaning the cost of roads, trucks, and mining equipment is not factored into the price of each piece of coal, only the marginal cost of producing each ton of coal. For solar, hydrogen fuel cells, and wind energy systems, the cost to construct the system is factored into the total cost while the marginal cost of producing electric is virtually free. We need a framework to better measure the economics of alternative energy. The impact of carbon on our climate and global warming are clearly not measured in the costs of hydrocarbon fuels nor is the cost of protecting our access to oil such the cost the Iraq War.

Despite the carbon issues surrounding coal, (coal has higher carbon-to-hydrogen ratio in comparison to oil or gas) coal is more abundant and therefore is cheaper than oil. As electric utilities in 24 states embrace alternative energies through such programs as Renewable Portfolio Standards (RPS), perhaps the benefits of alternative energies will begin to combat the negative economics of hydrocarbon fuels.

Ethanol offers short-term solutions, but corn-based ethanol is not the answer

Ethanol may emit less CO2 and help reduce the demand for foreign oil in the short term, but ethanol and in particular, corn-based ethanol raises food prices, is less efficient than gasoline, diesel, and biodiesel, and is not a substitute for oil.

According to research compiled by National Geographic Magazine , the energy balance of corn ethanol, (the amount hydrocarbon fuel required to produce a unit of ethanol) is 1-to-1.3 whereas for sugar cane ethanol the ratio is 1-to-8. This suggests corn-based ethanol requires significantly more energy to produce than sugar cane ethanol. Corn ethanol is only marginally positive.

A major issue with corn ethanol is its impact on corn prices and subsequently, food prices in general. It is the price of oil that is impacting the price of corn because nearly all ethanol produced in the U.S. is derived from corn. Therefore, corn prices are inextricably linked to oil prices as well as to the supply and demand of corn as food and feedstock. Corn Prices while volatile and impacted from weather and other variables appear to follow the rising price of oil as illustrated in Figure 1. In turn, corn prices are also influencing other commodity prices where corn is used for feed for livestock.

The rising motor vehicle usage in China and India is escalating the already tenuous situation in the oil markets. With ethanol tied to oil prices we are beginning to see corn prices exacerbate the inflationary pressures at the retail level. Over the last year consumers are paying more for food with large increases in the prices of eggs, cereal poultry, pork, and beef which are tied to corn.

Figure 1 Corn Prices
Corn Prices

Senate legislation for Renewable Fuels Standard calls for ethanol production to increase to 36 billion gallons by 2022 with 21 billion derived from as cellulosic material such as plant fiber and switchgrass . Corn is expected to comprise 42% of the ethanol production in 2002 from virtually all today. The fact is that ethanol production at its current level of 6 billion gallons equates to only 4% of our gasoline usage and is already impacting food prices. Gasoline consumption in 2005 amounted to 3.3 billion barrels or 140 billion gallons. Current estimates put gasoline consumption at 144 billion gallons a year in 2007. Even if vehicles could run entirely on ethanol, there is not enough corn harvest to substitute our demand for oil. We need a cohesive and coordinated effort using multiple technologies to develop alternative energies to reduce our dependence on foreign oil.

Performance

According to Renewable Fuels Association ETHANOL FACTS:
ENGINE PERFORMANCE,
ethanol offers higher engine performance with octane rating of 113 in comparison to 87 for gasoline and has a long history in the racing circuit. In 2007, the Indy Racing League, sponsors of the Indianapolis 500 started using ethanol in racecars. However, the higher engine performance may come at a cost of lower fuel efficiency.

Table 1 Specific Energy, Energy Density & CO2
Specific Energy

Efficiency

Gasoline offers 56% higher energy efficiency (specific energy) over ethanol as measured by kilo-joules per gram (kj/g). (As a reference: 1 kilowatt-hour = 3,600 kilojoules = 3,412 British Thermal Units) Biodiesel with 35 kj/g is 33% more energy efficient than ethanol at 24.7 kj/g.

In terms of energy density, ethanol would require larger storage capacity to meet the same energy output of gasoline diesel, and biodiesel. Ethanol requires a storage tank 48% larger than gasoline and 41% larger than diesel for the same energy output.
Please see Hydrogen Properties and Energy Units

For a quick review of Specific Energy and Energy Density – (Molecular Weight Calculator) the specific energy of a fuel relates the inherent energy of the fuel relative to its weight and is measured in kilo-joules per gram.

CO2 Emission

The molecular weight of CO2 is approximately 44 with two oxygen molecules with an approximately weight of 32 and one carbon atom with a weight of 12. During the combustion process, oxygen is taken from the atmosphere producing more CO2 then the actual weight of the fuel. In the combustion process a gallon of gasoline weighing a little over six pounds produces 22 pounds of CO2.

CO2 emission is a function of the carbon concentration in the fuel and the combustion process. During combustion ethanol produces approximately 13 pounds of CO2 per gallon. Gasoline and diesel produce approximately 22 and 20 pounds per gallon, respectively. CO2 emissions per gallon appear quite favorable for ethanol. However, the results are less dramatic when CO2 emissions are compared per unit of energy produced.

Figure 2 CO2 per KWH
CO2 / KWH

When measured in pounds of CO2 per kilowatt-hours (KWH) of energy, the results show ethanol producing 6% less CO2 than diesel or biodiesel and 5% less than gasoline. In the case of ethanol, the lower specific energy of the fuel negates the benefit of its lower CO2 emissions. Meaning more ethanol is consumed to travel the same distance as gasoline or diesel thereby limiting the benefit of its lower CO2 emissions.

The bottom line is ethanol does not ameliorate our dependence on foreign oil and while it demonstrates higher performance for racecars, it is still less efficient than gasoline diesel, and biodiesel, and diverts food production away from providing for people and livestock. The reality is there are special interest groups that obfuscate the facts about ethanol for their own benefit. The real solution to our imminent energy crisis is alternative energies including cellulosic ethanol, solar, hydrogen fuel cells, and wind.

Economics of Solar PV Suppliers

Improving economics and high market valuations should help drive research for alternative energy. With the release of Q3/07 financials, it’s clear that the economics of solar photovoltaic (PV) suppliers is improving. Some of the leading pure play publicly traded PV stocks are demonstrating significant improvements in financial performance that should drive further investment into solar and green technology. The improving economics of solar should continue to drive further investment into alternative energy companies as venture capital firms and Wall Street find that alternative energy is a significant secular trend with sustainable economic foundation.

Most visible among the solar PV suppliers is First Solar (FSLR) with y/y revenue growth for Q3/07 increasing 290% and gross margins exceeding 50% and operating margins above 30%. FSLR’s management was clear in articulating that these strong Q3 numbers reflect ramping on of its German manufacturing facility and would not be sustainable. However, with gross margins exceeding 50% and operating margins above 30% Wall Street takes notice and rewards the firm with valuation multiple envious of leading technology companies such as Google (GOOG) and Cisco Systems (CSCO).

Figure 1 Revenues, Margins, and Capacity
Solar Financial Performance

The stronger financial performance of solar PV suppliers is significant because it improves the viability of the solar PV business model thereby attracting more investors and in turn drives funding for alternative energy start up companies. FSLR went public in November 2006 with a closing price of $24.74 on its first day. With a closing price one year later of $212.63, FSLR offers investors a yearly return of 759%. The attractive return generated by solar stocks tends to attract more investors and drives market valuations higher thus feeding the flow of additional venture capital funding.

In terms of market valuation FSLR trades at a significant premium to most companies in the S&P 500 as well as leading technology companies including GOOG and CSCO. . Most solar PV companies trade at higher market valuation multiples than CSCO and GOOG. Both FSLR and Sun Power (SPWR) trade at premium price-to-sales (P/S) and price/earnings-to-growth (PEG) multiples in comparison to some leading technology stocks. In terms of PEG ratios, FSLR and SPWR trade at 2.9x and 2.2x respectively while CSCO and GOOG trade at 1.3x and 1.2X, respectively. In comparison, the S&P 500 index trades at a PEG of 0.8x while the technology and energy segments trade at 0.6x and 2.2x, respectively. These high market valuations prove the venture capital community with high exit values on their current crop of alternative energy investments. Please see Figure 2.

It is this premium market valuation multiple that suggests the importance of alternative energy. Wall Street tends to be a leading indicator and keen in its ability to identify secular trends. Major trends command premium valuations and reward venture capital with attractive exist strategies. Wall Street rewards cash flow growth fueling further venture capital funding that in turn, fuels the flow of intellectual and financial capital. The value migration measured by price-to-sales multiples and illustrated by A. Slywotsky in his book Value Migration provide a framework to gauge the significance of trend towards alternative energies. Capital gravitates to the business model that creates economic value and is measured by a stock’s price-to-sale ratio. By that measure solar stocks is where the value is headed.

Figure 2 Price-to-Sales Ratio
PS Ratio

The bottom line is that high market valuations attract research funding and brain power. Rising oil prices, rapid industry growth, and high public market valuations of solar PV companies, should act to attract further venture capital funding of alternative energy companies. Increased solar funding should translate into increased research and talent migration that could improve solar efficiency and reduce costs that in turn could bring solar to electric grid parity.

A small investment produces huge savings on your electric bill

My September electric bill arrived the other day and I was interested in comparing my energy savings after swapping 60 and 100-watt light bulbs for Compact Fluorescent Light bulbs (CFL), as recommended by the U.S. Department of Energy (DOE). Our progress in migrating to solar and wind energy is moving slower than expected. The CFL bulbs were a cheap investment so last year 12 standard light bulbs (two 100-watt and ten 60-watt) for ten 60-watt and two 100-watt CFL bulbs.

The results are impressive with improving energy reductions and money savings. Energy usage as measured by kilowatt-hours (KWH) is down an average of 30% from last and attributable to CFL, outdoor solar lighting as well as electric conservation efforts. However, the savings attributable to the CFL bulbs, of nearly $8 per month equate to an impressive return on investment of over 190% in one year.

While our initial calculations suggested energy savings (for lighting) called for reductions of over 70% when switching to CFL bulbs, the electric bill reduction was not that dramatic because large appliance usage account for a larger portion of electric power bill. However, when measuring the return on investment for a fast, cheap, and easy step to lower your electric bill, the CFL produces real savings,

The CFL bulbs cost around $4.00 for either a 100-watt or 60-watt equivalent light bulb. GE’s compact fluorescent lights were installed in August 2006 at a total cost of $48.00 (12 times $4.00 a light). According to GE the 60-watt CFL used 15-watts of power and the 100-watt CFL used approximately 26-to-29 watts of power. So theoretically, energy use, assuming lights were in operation for 4 hours per day, would save about 71 KWH a month. Our electric rates are currently at $0.108 per KWH which is at par with the U.S. average rate of Electricity Prices for Households $0.104 per KWH in 2006. Therefore, the CFL bulbs are saving about $7.71 per month from our electric bill amounting to $92.50 in savings over a year. That yields an investment return of 193% on a $48 investment in CFL bulbs.

Figure 1 CFL Energy SavingsEnergy Savings

Now of course, power usage varies by household, including the diligent habits of our children, so savings will vary. The bottom line is little steps sometimes produce big results – CFL bulbs do help reduce your electric bill with a small investment and also help the environment as each 1.3 KWH reduction in power use reduces carbon dioxide (CO2) emissions by 1 pound. Coal generates about half the electric power in the U.S. and produces roughly ¾ of a pound of CO2 for every KWH of electric. That means for every 1.3 KWH of electricity used (a 100-watt light used for 13.3 hours) produces one pound of CO2. CFL help reduce CO2 emissions by approximately 1.4 pounds per bulb based on light usage of just 1-hour/day a month.

The DOE’s Change a Light, Change the World campaign misses the bigger point.

The U.S. Department of Energy (DOE) is quite correct in suggesting that if every household in the U.S. substituted a 100-watt standard light bulb for a Compact Fluorescent Light bulb (CFL), it would eliminate an amount of carbon dioxide (CO2) equivalent to one million automobiles. However, it is the bigger picture that matters, – motor vehicles contribute the most to CO2 emissions. We must not forget that by focusing on CO2 emissions, they are admitting that CO2 is a real issue that potentially leads to global warming and climate change.

Let’s look at some facts about our carbon footprint. A 100-watt light in operation for 13.3 hours produces approximately one pound of CO2 when the electricity is generated by coal. Coal has significantly higher carbon emissions per kilowatt-hour (KWH) than oil or gas. Please see Carbon content of fossil fuels . Coal generates about half the electric power in the U.S. and produces roughly ¾ of a pound of CO2 for every KWH of electric. That means for every 1.3 KWH of electricity used (a 100-watt light used for 13.3 hours) we produce 1 pound of CO2. And remember it’s the oxygen in the air that contributes nearly 73% to the weight of CO2. This is why more CO2 is created than the actual weight of the fuel.

Using the same fuel emissions data, a motor vehicle with an average fuel efficiency of 22 miles per gallon (MPG), produces approximately 90 pounds of CO2 for every 100 miles driven. A gallon of gasoline produces nearly 20 pounds of CO2. That equates to one pound of CO2 for every mile driven by an SUV with a fuel efficiency of 19 MPG. (19.9 pounds/gallon times 1 mile divided by 19 MPG)

While it makes sense to address the issue of CO2 emissions, particularly as coal accounts for half of electric power generation and has higher CO2 emissions per KWH than oil, the real issue is an energy plan that givers us energy independence. Energy independence should equate to national security.

With choices like Biodiesel and Ethanol, what’s the best fuel for your vehicle?

With the rapid growth in vehicle use around the world, it would be nice to know what are the most efficiency, economic, and least carbon emitting fuels. The number of motor vehicles on the road is increasing rapidly. The number of cars and trucks in China is up over 3,600 percent in the last thirty years. Data from the U.S. Department of Energy (DOE) and Ward’s Communications, Ward’s World Motor Vehicle Data provide an interesting view of the growth in motor vehicle use.

Figure 1 China Truck and Car Registration
China Vehicles

While the U.S. still accounts for the largest motor vehicle market, the rest of the world is quickly accelerating towards more vehicles on the road. Figure 2 shows the number of vehicle registrations over the last thirty years for China, the U.S. and the rest of the world (ROW). Vehicle registration growth in the U.S. has been growing at a 2% per year rate from 1975 to 2005. The largest growth in vehicle registration is in China and India where growth in the last ten years is up 195% and 99%, respectively.

Figure 2 World Vehicle Registration
World Vehicles

With an explosion in motor vehicle use, what fuel should we be using to better performance and reduce emissions? Let’s go back to two basic concepts of energy: Specific Energy and Energy Density. For a quick review, (Molecular Weight Calculator) the specific energy of a fuel relates the inherent energy of the fuel relative to its weight. Specific energy is often measured in kilo-joules per gram (kj/g). One kilo-joule equals one kilowatt-second meaning one kilowatt-hour (KWH) equals to 3,600 kilo-joules. Also one British Thermal Unit (BTU) equals 1,055.05585 joules. A reference to the specific energy and energy values of most fuels can be found at Hydrogen Properties

Figure 3 Specific Energy
Specific Energy

By specific energy hydrogen is the clear leader. However, vehicles must inherently carry their fuel supply, so to determine which fuel is best for motor vehicles, energy density of the fuel is the next measurement. While vehicle fuel efficiency is dependent upon a number of factors such as engine type and performance, make and model of vehicle, road conditions and fuel, we are focusing on fuel energy.

Figure 4 Energy Density: KWH per Gallon
Energy Density

Figure 4 illustrates how fuels compare with respect to energy density, that is, energy relative the container size. We again are using KWH to measure energy value. Hydrogen, because it is so light, requires 15.9 times the container volume to provide the same energy as diesel. Biodiesel provides more power per gallon than Ethanol, which requires 1.6x, the container size for the same amount of energy as diesel. Biodiesel and diesel are relatively similar with respect to energy density. While both Ethanol and Biodiesel are both form of renewable energy, Biodiesel offers more bang per gallon. Before we are able invest more into hydrogen and solar energy to bring alternative energy into parity with conventional hydrocarbon fuels, diesel and biodiesel offer better energy efficiency among hydrocarbon fuels.

Table 1 Specific Energy, Energy Density & CO2
Specific Energy

As a final assessment of hydrocarbon fuels, let’s compare carbon dioxide (CO2) emissions among our list of fuels. CO2 emission is a function of carbon concentration and combustion process of the fuel. Fuel energy research at the Department of Environmental Protection (EPA) and DOE indicate 99% to nearly 100% combustion of with fuels used in vehicles. That means almost all of the atoms in the fuel are converted to either heat or byproducts such as CO2.

Figure 5 illustrates how much CO2 is produced per gallon of fuel. Remember the molecular weight of CO2 is about 44 with oxygen contributor nearly 73% of the weight and is taken from our atmosphere during combustion. This is why more CO2 is created than the actual weight of the fuel. A second factor needs to be considered when evaluating CO2 emission and that is how much CO2 is produced per energy value. In comparing CO2 emissions per KWH of energy, Ethanol produces about 7% less CO2 than diesel or Biodiesel and 5% less than gasoline. Neither of these estimates considers the emissions from the processing to produce Ethanol or Bioiesel.

Figure 5 CO2 per Gallon
CO2

The bottom line is Ethanol and Biodiesel provide marginal relief to our energy crisis with biodiesel offering better efficiency and Ethanol marginally less CO2 missions. The only real solution to our imminent energy crisis is alternative energies such as solar, hydrogen fuel cells, and wind.

Research at Caltech may provide clues to improving solar cell efficiency

With rising energy prices and growing concern over global warming, will advances in solar and alternative energies enable the development of affordable and efficient energy solutions. Caltech research on the energy conversion process may offer some insight.

Energy conversion, ways of converting sunlight to electric and chemical energy, offers promising advancements to make solar and hydrogen energies more practical and affordable. On the forefront of energy conversion research, the framework of developing disruptive energy technologies, is The Lewis Group, that is part of the California Institute of Technology’s division of Chemical and Chemical Engineering. The Lewis Group is working in several research areas some geared towards to better understanding of energy capture, conversion of light into electrical and chemical energy, and energy storage. These research projects include photo-electrochemical, which focuses on the chemistry of semiconductors and materials, surface modification of semiconductors to improve electrical properties, and nanocrystalline titanium dioxide that could potentially lead to significantly lower cost for converting sunlight to electrical energy. The Lewis Group research projects are much more than improving photovoltaic devices; they are also exploring ways to convert sunlight into stored fuel energy.

While we are providing a brief and very oversimplified view of the solar energy research, it is important to understand the dynamics of energy conversion because the conversion process impacts the efficiency and the production cost of photovoltaic (PV) devices and fuels cells. The Lewis Group has an interesting PowerPoint presentation available for download providing an overview of energy from consequences of CO2 emissions to the latest in new technologies to improve alternative energies. Of particular interest are the historical efficiency trends for various materials used in crystalline and thin-film solar cells, energy conversion strategies of turning light to fuel and electric, and the cost/efficiency tradeoff in photovoltaic devices.

Cost/Efficiency Tradeoff
Photovoltaic devices are limited in their practical efficiencies governed by the thermodynamic limits and production costs that involve tradeoffs in materials, production processes, and PV device packaging. The Lewis Group provides a thorough illustration of the efficiency trends for various PV devices materials such as crystalline silicon used in semiconductors as well as the new approaches to thin film PV including amorphous silicon, cadmium telluride (CdTe), copper indium deselenide (CIS) and copper indium gallium deselenide materials (CIGS). These thin film material could offer substantial PV devices price reductions as a result of higher efficiency or lower production costs.

Figure 1 Cost/Efficiency Tradeoff
Cost/Efficiency

There is a tradeoff between improving the efficiency of a PV device, that is the amount of electric energy per solar panel, and the cost to produce the PV device. The average efficiency for a PV device is between 15%-to-16% and the average cost between $100-to-$350 a square meter. The cost per square meter and PV efficiency measured in watts per square meter can equate to a cost per watt, which ranges from $1.25/watt to $2.00/watt. SunPower (SPWR), offers the leading PV single junction device efficiency of 22% employing crystalline silicon and is expected to reach 500 megawatts (MW) production capacity by late 2009 from 330 MW in 2007. First Solar (FSLR) is ramping its thin film cadmium telluride (CdTe) solar technology by leveraging its low cost advantage with high volume production with its 75 MW in operations Ohio and 100 MW coming online in Germany. Startup Nanosolar is focusing on thin film solar PVs with a blend of copper indium gallium deselenide (CIGS) materials along with a manufacturing process much like printing, by placing the material blend upon metal foil. Evergreen Solar (ESLR) employs an integrated manufacturing process from wafers to cells and panels based on its proprietary String Ribbon Wafer technology with production levels at 118 MW in 2007.

There is presently a practical limit to solar efficiencies of approximately 30% and a thermodynamic limit of about 83%. The Shockley-Queisser limit at 30% for single junction solar cell efficiency is a function photon absorption in a material. “Detailed Balance Limit of Efficiency of p-n Junction Solar Cells” (W Shockley and HJ Queisser, Journal of Applied Physics, 1961) found that photons delivering excitation energy above a threshold (the band gap) for charge carrier electrons is lost to heating, meaning excess photon energy generates heat and not electric current. Photons with energy levels below the band gap pass through the material and photons above the threshold are absorbed. The absorbed photons transfer their energy to excite the electrons in the material and create pairs of negative electrons and positive charges that, because of their repulsion, travel to opposite ends thereby generating electric current.

According to the Lewis Group, other factors that limit PV cell efficiency include reflective loss of approximately10% for a material like silicon and a fill factor constraint that peaks at 83%. The fill factor restraint is attributable to the current-voltage characteristics of a PV cell that deals with matching the photocurrent density and voltage.

NREL (DOE lab) and Spectrolab (a Boeing company BA) using a multijunction semiconductor approach along with solar concentrators have achieved solar cell efficiencies of 40.7% in lab experiments while commercial products operate at 26.5%-to-28.3% efficiency range. Solar cell suppliers could reduce costs through production improvements or improve PV efficiencies without adding to costs. PV cell suppliers should benefit from economies of scale to reduce production costs while advances in technology improve PV efficiencies.

Research conducted by the Lewis Group at Caltech indicates that materials selected for PV devices have unique properties in their ability to absorb sunlight and generate electricity. In their analysis of semiconductor materials, the Lewis Group research found two parameters, determined by the physical properties of the material, that influence the PV’s efficiency. One is the thickness of the material, measured in microns, required to absorb enough sunlight to bring particular atoms in the material to an excited state, thereby freeing the electron to generate an electric current. The second parameter in the PV material is length of time the excited electrons last before recombining to generate heat instead of electric. Some materials such as silicon require material thickness of 100 microns while gallium arsenide (GaAs) only 1-to-3 microns.

Energy Conversion
Conversion of energy into electric or fuel is advancing through research in photoelectrochemical materials for solid and liquid fuels. Improvements in efficiencies for PV devices and fuel cells offer tremendous potential for transportation and home electric use.

Figure 2 Efficiency of Photovoltaic Devices
Photovoltaic Devices

From figure 2, it seams quite apparent that PV efficiency has improved substantially since the 1950’s. Please see the Department of Energy (DOE) Basic Research Needs for Solar Energy Utilization for detailed analysis of solar energy. Further progress in PV and fuel cell technologies is predicated upon successful funding of further research. The bottom line is that only through innovative research will a truly disruptive technology be developed that has the ability of changing the economics to deliver an energy solutions to all nations.

Home Heating Concerns

With oil prices over $80 per barrel, the National Energy Assistance Directors’ Association in its press release today Record Home Heating Prices for Heating is expecting the average home heating cost for the ’08-’08 season to rise 9.9%. For homeowners using oil heat, heating costs are expected to increase 28% and for homes using propane, a 30% increase is expected.

With rising energy costs driven by costly oil extraction, the potential impact from carbon emissions with our continuing use of oil on climate change and rising sea levels, as well as the potential for fuel supply disruptions, could exacerbate our tenuous relationship with energy.

Eventually, as price rise dramatically, alternative energy becomes more compelling. The problem is our economy is so inextricably link to oil, that our energy security is based on securing foreign oil.

Figure 1 Oil Prices and Home Heating CostsHome Heating

Without support and research on alternative energies such as solar and fuel cell technologies, we are hostage to oil. The U.S. economy is facing one of the most crises since the Oil Embargo of the 1973. Inflation driven by escalating oil prices is impacting the cost of home heating, transportation, production, materials, and food, particularly as corn is diverted to ethanol production. The housing market is in turmoil with falling home values, rising foreclosures, and a credit crisis that is making it more difficult to secure a mortgage may lead to slower consumer spending. With rising inflation and slower growth we may find ourselves in an economic world described as stagflation that was coined in the ’70’s to describe the bleak environment when gas stations rationed fuel, unemployment grew and the Federal Reserve raised rates dramatically to quell inflation.If we could limit our dependence on foreign oil through investment into solar energy and fuel cell technologies, we would not be impacted by the exogenous events in oil producing nations.

We believe there are a number of catalyst that could serve to dramatically lower the cost of alternative energies. It takes initiatives from all of us to change the balance. After all, oil is becoming more costly to extract, new oil discoveries are in difficult and challenging environments, and oil will eventually run out – it is finite. If we wait to long, our ability to make a difference may not be available.

Hostage to Oil

Without greater investment into solar and hydrogen energies, we are held hostage to rising oil prices. Alternative energies such as solar and hydrogen fuel cells offer tremendous potential to provide energy independence and energy security. The dependence of the U.S. upon imported foreign oil raises inflation, weakens our currency, exacerbates the trade deficit, and forces consumers to pay higher prices for home heating and transportation. With oil exceeding $80 a barrel in late September 2007, the only beneficiaries are countries exporting oil and oil conglomerates. I guess when countries such as Dubai, after accumulating a large trade surplus based on inflated oil prices, decides to diversify away from oil and buy a non-voting stake in the NASDAQ market, it’s a wake-up call.

To better understand the potential of alternative energy, we should try to understand two basic concepts of energy: Specific Energy and Energy Density. Without digressing into chemistry 101, (Molecular Weight Calculator) the specific energy of a fuel relates the inherent energy of the fuel relative to its weight. Typically, specific energy is measured in kilo-joules (kj) per gram. A joule is a measure of kinetic energy – one joule is the amount of energy needed to move two kilograms at a velocity of one meter per second. Or a kilo-joule equals one kilowatt-second meaning one kilowatt-hour (KWH) equals to 3,600 kilo-joules. Your local electric utility bills you by the KWH, which according to the US Department of Energy Average Retail Price of Electricity in 2007 is approximately $0.11 per KWH.

Table 1 Specific Energy and Energy Density
Specific Energy

The specific energy of a fuel tells us how much energy can be derived from a measured amount fuel by weight. By ranking each fuel by its specific energy, one can determine how efficient each fuel is. Specific energy and fuel density are often proportional to the ratio of carbon and hydrogen atoms in the fuel. A reference to the specific energy and energy values of most fuels can be found at Hydrogen Properties

Figure 1 Specific Energy
Specific Energy
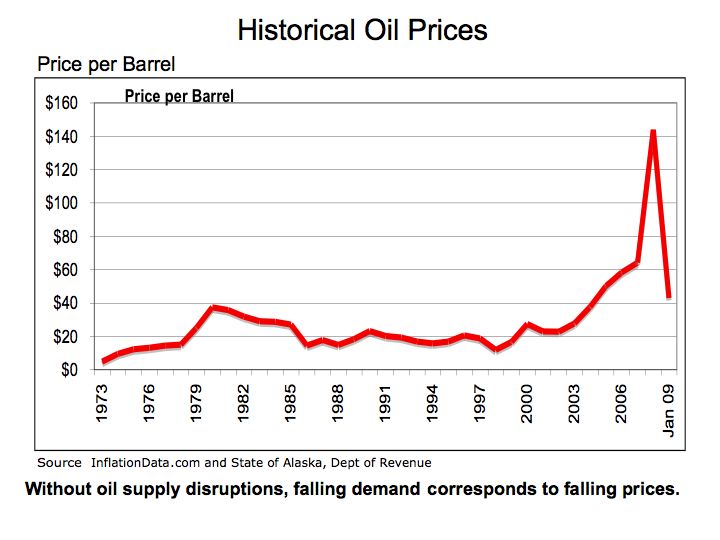
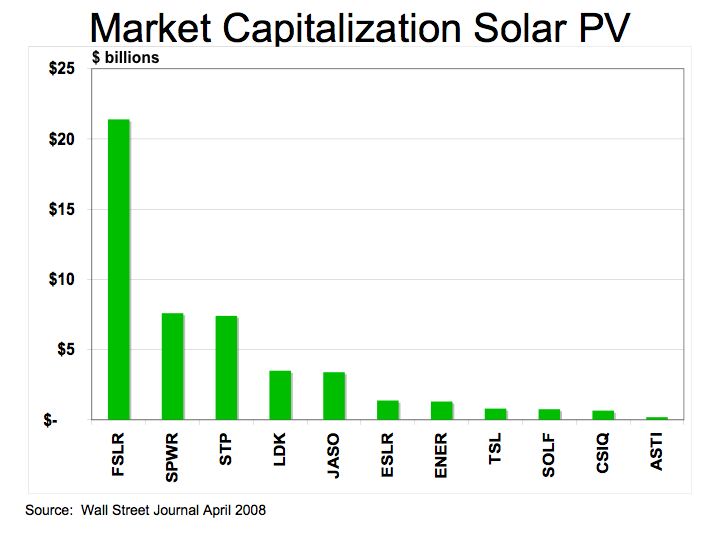
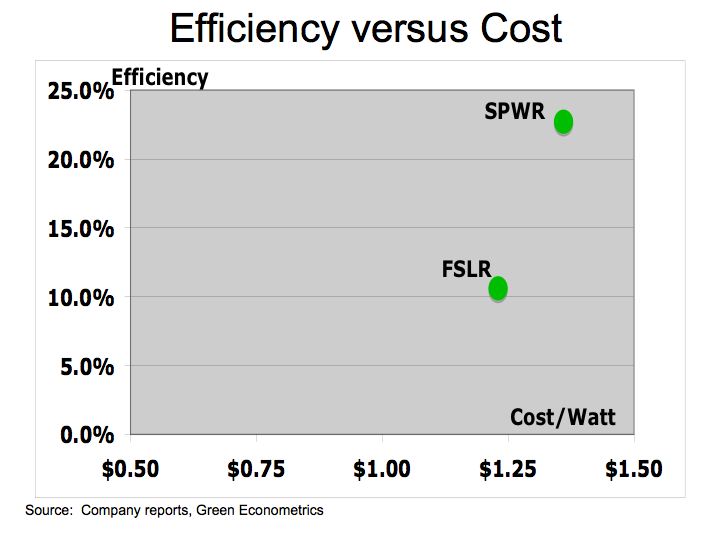
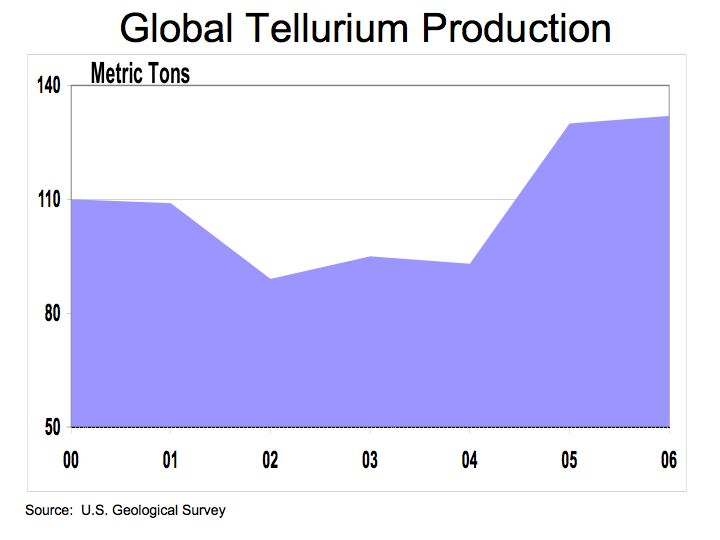
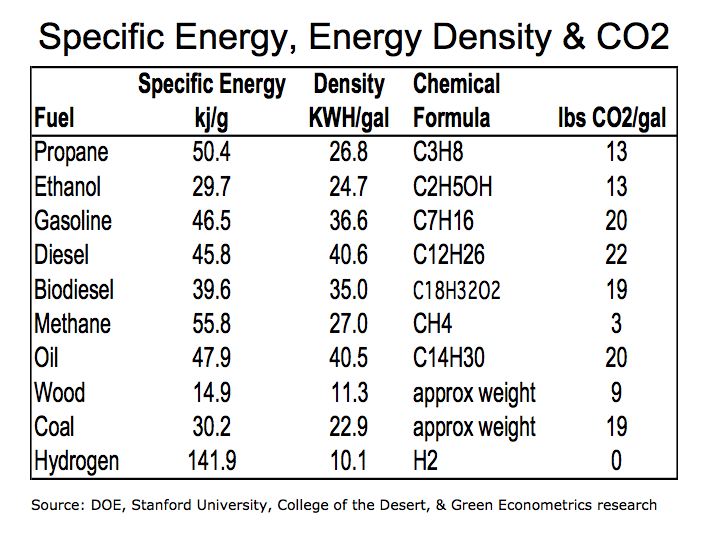
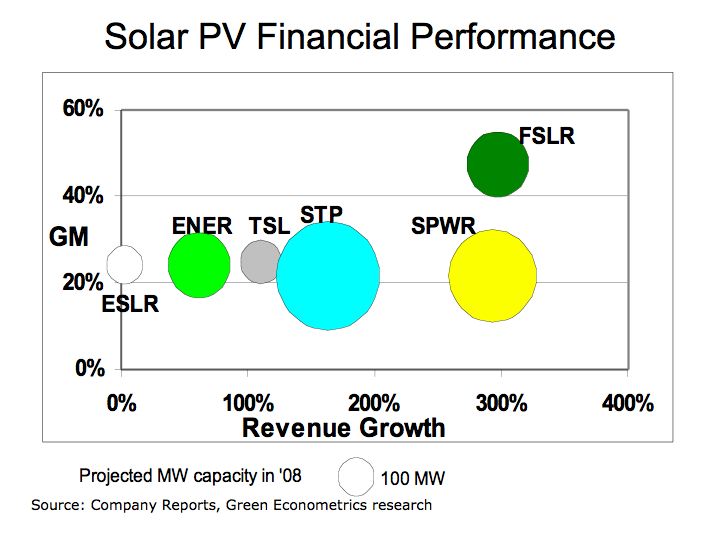
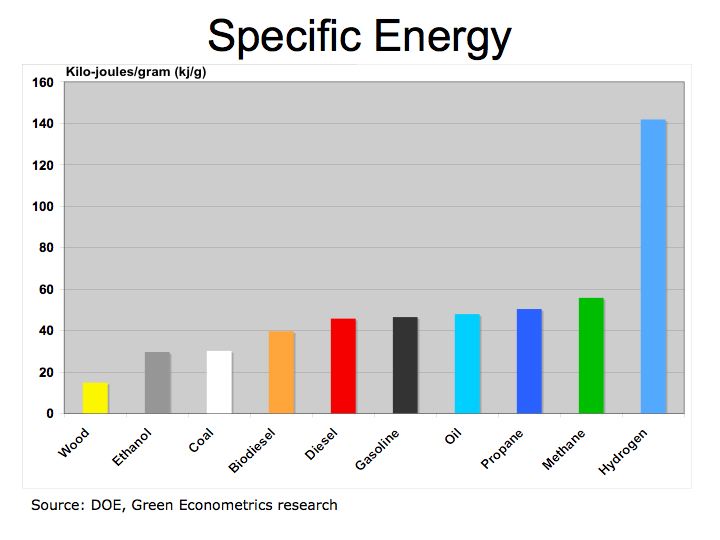
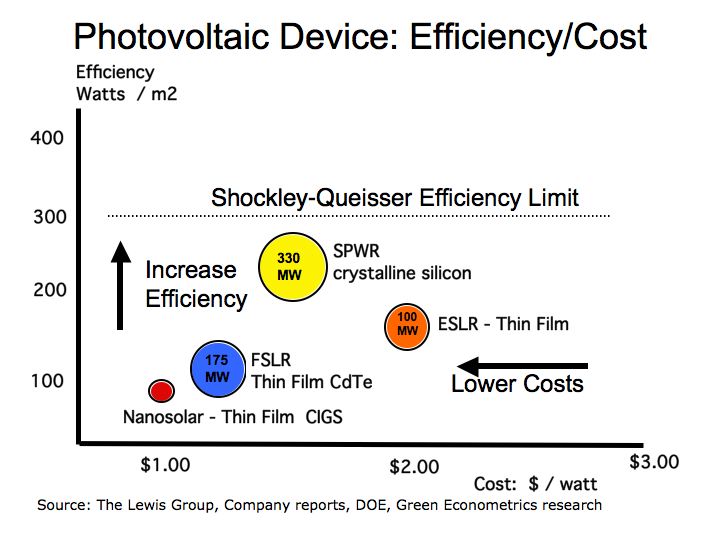
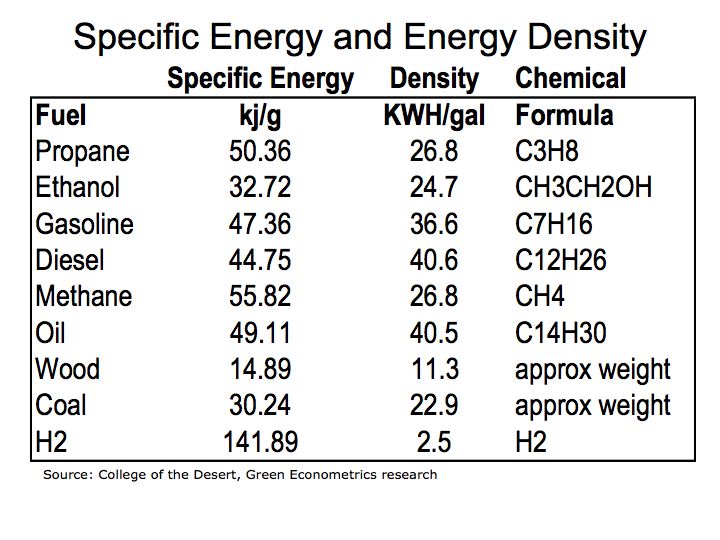
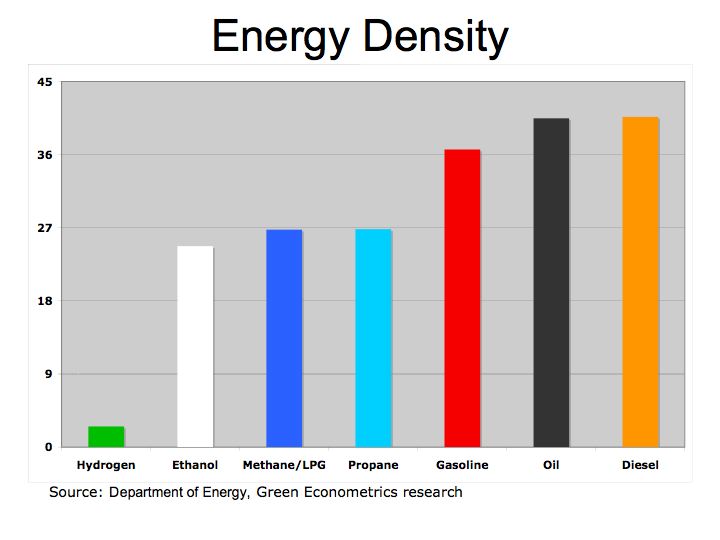
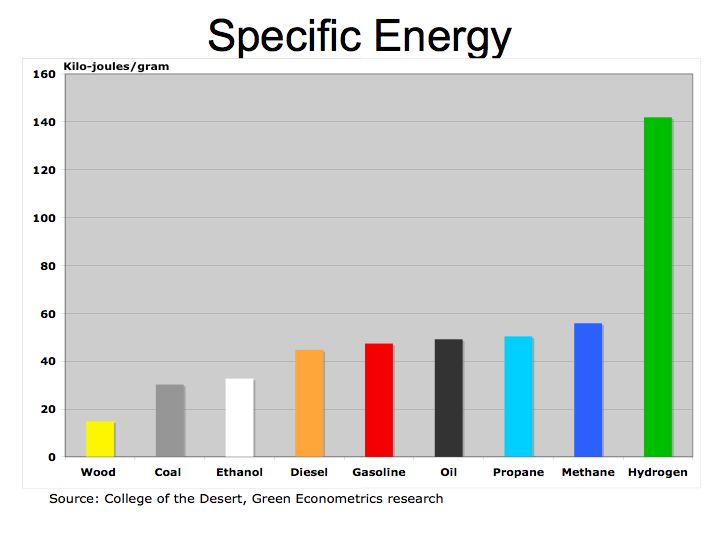
Figure 1 illustrates how fuels compare according to their specific energy. As we can see, hydrogen, because it’s extremely light, has the highest specific energy in comparison to hydrocarbon fuels.

This however, is not the full story because volume or energy storage requirement becomes a significant factor for gaseous fuels. Specific energy is important to analyze fuel efficiency by weight, but for hydrogen that must be pressurized and cooled to bring to a liquid state, the energy density become more relevant to fuel efficiency.

Figure 2 Energy Density: KWH per Gallon
Energy Density

Figure 2 illustrates how fuels compare according to their energy density, that is, energy relative the container size. As we can see from figure 2, hydrogen, because it is so light, requires 15.9 times the container volume to provide the energy of diesel or oil. In comparison to diesel, ethanol requires 1.6x the container size for the same amount of energy.

The container size becomes a significant detriment for housing hydrogen. Energy density is usually measured in kilo-joules per cubic meter (kj/m3). As kilo-joules are readily translated into KWH by multiplying by the number of seconds in an hour (3,600) and the College of the Deserts’ computation into gallons, we are converting the data into KWH per gallon for those of us in the U.S.

Hydrogen fares poorly relative to energy density. However, technology offers an approach to enhance the benefits of hydrogen with fuel cells. Fuel cell enable hydrogen molecules to interact with oxygen through a membrane that allows transmission in only one direction to convert H2 into an electric current to power your automobile. Fuel Cell Basics Fuel cells often capture the hydrogen electron from hydrocarbon fuel such as methane allow convention fuels to generate hydrogen for electric generation.

In a hydrogen-based economy, solar energy can provide electric to generate hydrogen through electrolysis and vice versa. Jeremy Rifkin’s The Hydrogen Economy eloquently illustrated the hydrogen economy where fuel cell act as mini power plants and the electric network resembles the Internet where cars plug into an electrical grid supplemented by solar cells at your home and work. Electric power generation moves from large utility generation to a distributed generation – everyone plugged in can generate power to the grid. The key benefit of hydrogen is that it democratizes the energy economy bringing power to all countries in the world.

An interesting technical analysis of hydrogen energy is provided by Ulf Bossel and Baldur Eliasson Energy and the Hydrogen Economy The bottom line is that solar and hydrogen energies offer tremendous potential to low long-term fuel costs and improve our environment and climate. More research is required to lower costs and improve feasibility.

Solar Energy: The Security Perspective

The U.S. Department of Energy (DOE)’s $23.6 Billion Spending Plan for FY’07 calls for $1.5 billion for the Office of Energy Efficiency and Renewable Energy where spending includes $28 million in solar, $16 million for thin-film photovoltaic manufacturing equipment to reduce the cost of solar panels, $23 million for researching ethanol, and $100 million for carbon sequestration research. However, more than half of the DOE spending is targeted towards research on weapons, defense, and security. Perhaps our national security would be better served if the U.S. were not dependent on foreign oil. Investment into alternative energies like solar and fuel cells could provide us with energy independence with less concern over protecting oil in foreign lands.

Solar energy is significantly more expensive than conventional hydrocarbon fuels. In Green Econometrics’ prior analysis of fuel efficiencies and costs, we found solar energy cost approximately $0.38-to-$0.53 per Kilowatt-Hour (KWH). See Understanding the Cost of Solar Energy
There is considerable variance in the cost of solar energy because sunlight availability varies by geography and climate. With limited sunlight solar costs could be over $1.00 per KWH. In terms of cost per KWH, solar energy is four-to-ten times the cost of hydrocarbon fuels.

Figure 1 Cost per Kilowatt-Hour
Energy Costs

For solar energy to be at parity with conventional fuels solar energy needs to be subsidized through tax incentives, utility rebates, and research funding. Research is perhaps the most important aspect of improving the economics of solar energy because through research companies could dramatically lower production costs. The disconnect in solar energy research is limited funding. Funding is required to incubate ideas and new approaches to solar energy in order to develop a roadmap for commercialized products that in turn, could be embraced by venture capital.

The DOE’s research funding for solar is just a drop in the bucket or barrel that better correlates the magnitude disparity. Electric utilities companies are providing electric power generated mainly through coal, which contributes heavily to CO2 emissions, and yet they don’t spend on research and development towards alternative energies. Large energy companies like Exxon Mobil (XOM) don’t have R&D budgets like pharmaceutical or technology companies that spend 14%-to-20% of their revenues on R&D. Merck (MRK) and Genentech (DNA) spent 17% and 20%, respectively on R&D while Microsoft (MSFT) and Google (GOOG) spent 15% and 14%, respectively on R&D in 2006.

If Exxon Mobil were spending 10% of its 2006 revenues of $377.6 billion towards R&D to develop alternative energies, it would amount to over $37 billion, a figure that is larger than the DOE budget of $23.6 billion. DOE spending on solar energy research is approximately $28 million. According to the DOE, U.S. energy expenditures in 2004 were over $869 billion. So with that amount of money being spent on energy, how much should be spent to avoid dependence on foreign oil?

Figure 2 Historic Energy Spending
Historic Energy Spending

Solar energy and fuel cell technologies have the potential to ameliorate our energy dilemma of foreign oil dependence and risk of climate change from carbon emissions. While it’s hard to measure the economic impact of climate change, our dependence on foreign oil leaves us with growing $450 billion debt for our presence in Iraq and our national security vulnerable to vagaries of oil prices. The Cost of Iraq War The $450 billion the U.S. is spending in Iraq is almost enough money to equip the 124.5 million homes in the U.S. with a 1 KW solar energy system. The U.S. housing units rose to 126.7 million in 2006. Of course that may not cover your total electric usage that averages about 10,760 KWH per household according to data from the Energy Information Administration Electric Power Annual 2005 – State Data Tables

Can higher R&D spending on solar energy help?
Even some of the leading domestic solar photovoltaic cell suppliers are light on R&D spending. SunPower (SPWR) and First Solar (FSLR) are budgeting their R&D spending towards the single digits as a percentage of revenues. Despite relatively low R&D spending levels, SunPower intends to lower solar panels cost by 50% by 2012. Solar photovoltaic cells undergo the same production processes as semiconductors. Experience curves associated with semiconductor production indicate a 20%-to-30% cost reduction with doubling of production. See The experience curve or cost-volume curve article from the Lockwood group TECHNOLOGY TRANSFER: A PERSPECTIVE The solar energy market is expected to grow at 80% over the next five years according to Rhone Resch, president of the Solar Energy Industries Association Solar Leader Expects >80% Market Growth Even without new advances in photovoltaic materials, with a solar energy market growth of 25% and an experience curve of 30%, solar cost could decline by 30% every three years from about $8.90 a watt ($0.45 a KWH) to $2.14 a watt or $0.11 a KWH in 15 years equal to the current price of electricity. The bottom line is that faster market growth and/or increased funding of solar energy research could significantly improve the economics of solar energy and give the U.S. greater security and energy independence.

Solar and alternative energies represent a very small percentage of our total expenditures on energy. Energy Price and Expenditure Estimates by Source
So a substantial reduction of solar energy costs, assuming somewhat elastic demand, we should see significant growth in solar energy. In addition, if we tax hydrocarbon fuels by their respective carbon emissions, we might begin to see level energy playing field.

Figure 3 Energy Spending
Energy Spending

Funding solar energy should be views as a strategic imperative at par with national surety. Energy security should equate to national security and alternative renewable energies should provide us with the means to our energy independence.